Back to Journals » Risk Management and Healthcare Policy » Volume 19
Development and Internal Validation of an Early Warning Predictive Model for Critically Ill Patients in the Emergency Department Utilizing Easily Obtainable Clinical Indicators
Authors Li X, Lv J, Guo H, Li H, Zhao Q, Qi H, Li J
Received 10 October 2025
Accepted for publication 7 February 2026
Published 26 February 2026 Volume 2026:19 566920
DOI https://doi.org/10.2147/RMHP.S566920
Checked for plagiarism Yes
Review by Single anonymous peer review
Peer reviewer comments 3
Editor who approved publication: Dr Gulsum Kaya
Xurui Li,* Jian Lv,* Hui Guo, Hongling Li, Qian Zhao, Huijun Qi, Jianguo Li
Department of Emergency, Hebei General Hospital, Shijiazhuang, People’s Republic of China
*These authors contributed equally to this work
Correspondence: Jianguo Li, Department of Emergency, Hebei General Hospital, No. 348 West HePing Boulevard, Shijiazhuang, 050051, People’s Republic of China, Tel +86 13730104245, Email [email protected]
Objective: This study aimed to develop and internally validate an early warning predictive model to identify the risk of critical illness among patients presenting to the emergency department (ED).
Methods: A retrospective analysis was conducted using clinical data from 3859 patients admitted between November 1, 2021 and December 31, 2021. Patients were randomly assigned to a training cohort (n = 2,703) and a validation cohort (n = 1,156) in a 7:3 ratio. Fourteen readily accessible physiological indicators obtained during the early stage of emergency department presentation were adopted as predictive parameters. Independent predictors of early critical risk were identified in the training cohort using generalized additive models, stepwise multivariate logistic regression and clinical practical considerations. The resulting model was used to stratify risk levels.
Results: No statistically significant differences were observed in in baseline characteristics between the training and validation cohorts (p> 0.05). Sex, age, heart rate, respiratory rate, systolic blood pressure, pulse oximetry saturation, level of consciousness, pupil status, mental status, and pain score were identified as independent predictors of critical risk (all p< 0.05). Risk stratification using conditional inference trees categorized patients into low-risk (p≤ 0.129), medium-risk (0.129<p≤ 0.867), and high-risk (p> 0.867) groups. The model demonstrated strong discriminatory ability, with area under the curve values of 0.926 (95% CI: 0.913– 0.940) in the training cohort and 0.914 (95% CI: 0.889– 0.938) in the validation cohort. Calibration was satisfactory, as indicated by Hosmer–Lemeshow test p-values of 0.318 and 0.654, respectively.
Conclusion: The developed predictive model demonstrated good discrimination, calibration, and clinical utility for the early identification of patients at critical risk in the ED setting. All predictors can be obtained during the initial clinical assessment, which facilitates real-time application in triage. This practical accessibility supports the model’s potential integration into routine emergency workflows and primary healthcare settings.
Keywords: critical risk in emergency department, early identification, nomogram, predictive model, risk stratification, visualization
Introduction
Emergency medicine, as a secondary clinical discipline, emphasizes the timely diagnosis and treatment of acute conditions.1 Physicians working in emergency departments (EDs) are required to conduct rapid assessments and initiate treatment within a limited timeframe and under resource constrained conditions. These operational demands contribute to high workload and large patient volumes. Currently, ED crowding and patient retention represent global challenges and similarly restrict the development of emergency care systems in China.2
To reduce overcrowding and improve patient flow in emergency departments, many countries have adopted “five-level triage systems,” such as the Emergency Severity Index (ESI) in the United States, the Canadian Triage and Acuity Scale (CTAS), and the Manchester Triage System (MTS) in the United Kingdom.3–5 The ESI system emphasizes patient acuity and anticipated resource utilization, placing high demands on the clinical judgment of triage nurses. CTAS assigns triage levels based on a comprehensive integration of patients’ chief complaints, high-risk histories, symptoms, signs, and physiological parameters. The MTS provides standardized flowcharts for 52 common chief complaints, each containing six key indicators, aiming to minimize subjective variability through structured, algorithmic assessment. In China, most hospitals employ a “four-level, three-area” triage system.6 Objective assessment criteria include vital signs, point-of-care testing results, and other diagnostic data, complemented by patients’ symptoms and physical findings. The triage process is conducted manually and centers on four core dimensions (airway, breathing, circulation, and disability) based on which clinicians determine both the triage level and the appropriate treatment area. Despite improvements offered by these systems, notable limitations remain. Their assessments require numerous parameters, including objective indicators (eg vital signs) as well as subjective indicators (eg pain and mental status).7 In the high-pressure environment of the emergency department, the use of numerous triage assessment indicators can prolong triage waiting time, subsequently increasing overall ED length of stay. This often leads to inefficient utilization of emergency resources and may delay timely treatment for critically ill patients.
The present study aimed to develop a visualized predictive model based on 14 vital sign indicators to facilitate the early warning of patients at critical risk in the ED. The predictive performance and clinical utility of the model were evaluated, with the core objectives of improving triage efficiency, providing a rapid and user-friendly decision-making tool for clinical practice, supporting timely clinical interventions, and alleviating ED pressure as well as patient retention.
Materials and Methods
Study Participants
A retrospective analysis was conducted using the clinical data of 4,997 patients admitted to the emergency internal medicine and surgical departments of Hebei General Hospital between November 1, 2021, and December 31, 2021. Following screening based on inclusion and exclusion criteria, 3,859 patients were eligible for analysis. Inclusion criteria were: (1) age ≥18 years and (2) availability of complete and accurate clinical data. Exclusion criteria were: (1) patients presenting solely for prescription refills, laboratory orders, or inpatient admission certificates without undergoing diagnostic evaluation, and (2) individuals who were deceased upon arrival at the ED. Ethical approval for this study was granted by the hospital’s ethics committee, and the study was conducted in compliance with medical ethical regulations.
Study Methods
Outcome Assessment Method
(1) The triage criteria applied in the ED were derived from the Expert Consensus on Emergency Triage issued in 2018.8 (2) Initial triage was performed by ED triage nurses with at least 3 years of work experience, who conducted the assessment using a standardized electronic checklist, the subsequent secondary assessment was carried out by on-duty attending physicians of the ED with no less than 5 years of work experience. All the aforementioned assessments were completed within 10 minutes of the patient’s arrival to ensure the accuracy of the initial triage. All patients were classified into one of four triage levels: grade I, II, III, or IV. Grade I and II were classified as representing critical conditions. Specifically, Grade I (Resuscitation Level) refers to patients with immediate life-threatening conditions (eg, cardiac arrest, severe respiratory failure or shock) who require immediate intervention. Grade II (Emergency Level) refers to patients with potential life-threatening conditions (eg, acute myocardial infarction with stable vital signs, sepsis) who require urgent intervention within 10 minutes.
Inclusion of Predictive Indicators
The selection of predictive indicators was informed by real-world clinical scenarios and research from Chinese and international literature.3–9 The following indicators were included: sex, age, body temperature, heart rate (HR), respiratory rate (R), systolic blood pressure (SBP), peripheral oxygen saturation (SpO2), pain score, levels of consciousness, pupil status, mental state, peripheral circulation, urine output, and profuse sweating, these indicators are readily accessible upon the patient’s presentation to the emergency department. Among these, sex, pupil status, mental state, peripheral circulation, urine output, and profuse sweating were classified in accordance with expert recommendations. Body temperature, level of consciousness, HR, R, SBP, and SpO2 were categorized following the National Early Warning Score (NEWS) guidelines.9 For pain assessment, the Numerical Rating Scale (NRS) was used for conscious patients, while the Behavioral Pain Scale (BPS) was employed for unconscious patients. BPS scores were then converted to NRS scores using a formula from the literature (BPS = 3.288 + 0.519×NRS),10 enabling standardized pain measurement using a single scale across all patients. Age and pain score were initially treated as variables to be analyzed, and their final form of inclusion in the model would be determined through statistical methods combined with clinical practice in subsequent steps. The current model specifically excludes laboratory test values to ensure its practicality during the initial triage phase in the ED, as such test results are usually unavailable at this point. (see Table 1).
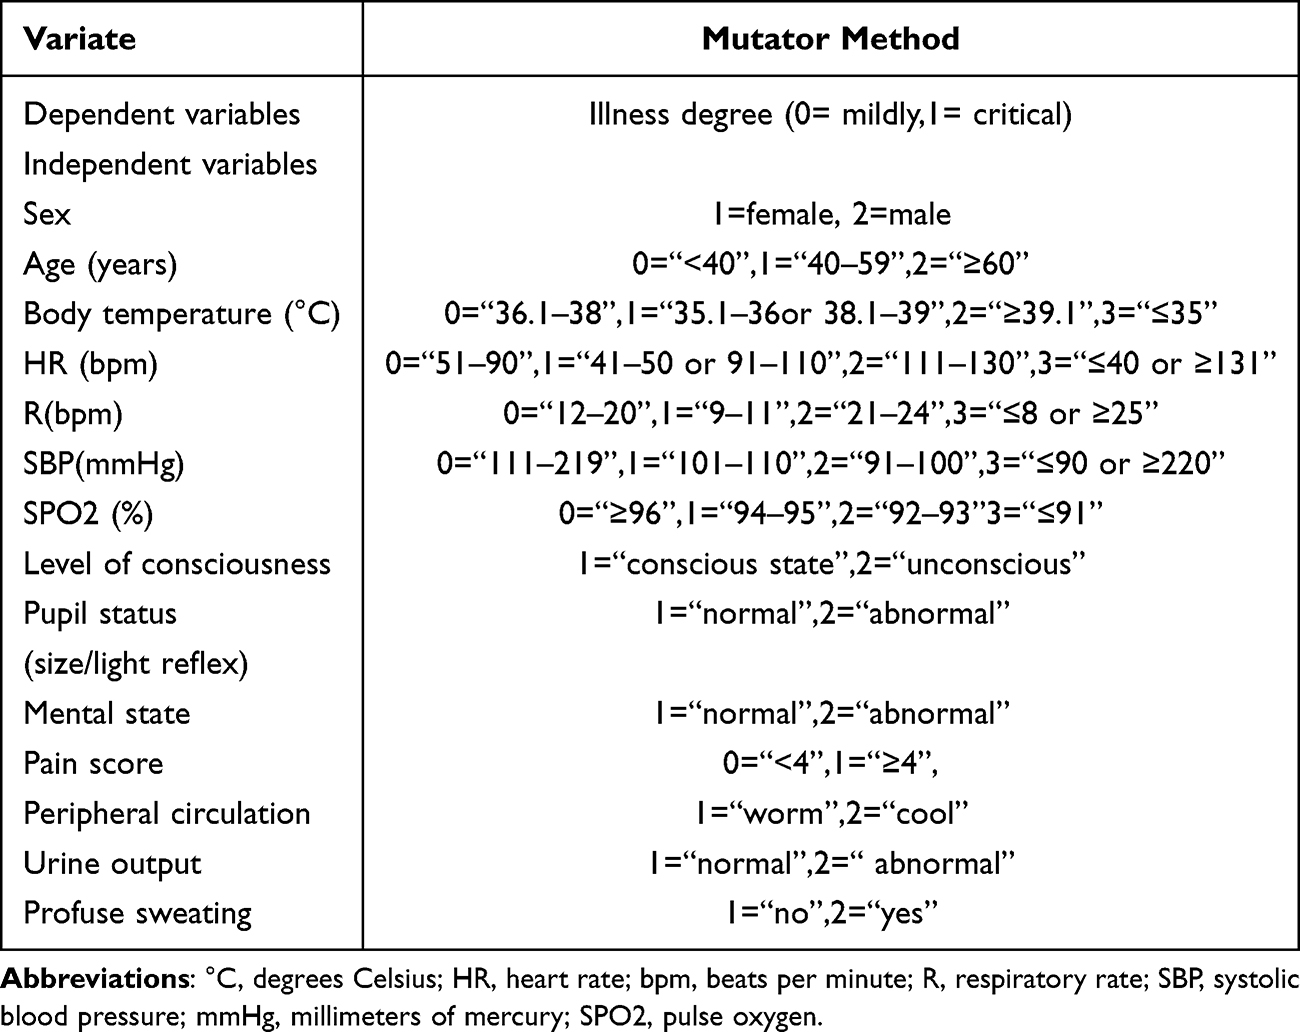 |
Table 1 Variable Definitions and Assignments for Model Development |
Data Quality Control
All data were obtained from the emergency electronic medical record system within the hospital’s information system. A quality control framework was established comprising two data entry personnel, one reviewer, and one quality control specialist. The reviewer was selected from among the attending physicians, and the quality control specialist was selected from the senior physician group. Data were independently entered by two personnel using the established predictive indicator collection form. Consistency, repeatability, and logical coherence of the two datasets were examined by the reviewer. Any discrepancies identified during the review process were submitted to the quality control specialist for verification of data authenticity and accuracy.
Statistical Methods
The number of finally included patients was verified to meet the sample size requirements for analysis using the optimal sample size calculated by the Events Per Variable (EPV) Threshold Criteria and the Riley formula.11 Via the createDataPartition function in the R caret package, the included patients were randomly allocated into a training set and a validation set at a 7:3 ratio using a stratified random sampling method based on unique patient identifiers (ID).12 Statistical analyses were performed using SPSS software, version 26.0 and R version 4.5.1 (https://www.r-project.org/). Data are expressed as frequencies (percentages). Categorical data were compared using the chi-squared (χ2) test. Generalized additive models (GAM), multivariate and logistic regression analysis, were used to analyze the optimal form of variable inclusion in the training set and identify independent predictors of early critical risk in ED patients. These predictors were incorporated into the development of the predictive model. Predictive probabilities generated by the model were stratified into low-, medium-, and high-risk categories using the conditional inference tree (CIT) method, thereby establishing a risk stratification system for the early identification of critical conditions in patients in the ED.
The predictive model was subsequently validated for discrimination, calibration, and clinical utility in both the training and validation sets. Discrimination was assessed using the area under the receiver operating characteristic curve (AUC), with values interpreted as follows: 0.50–0.70 (low), 0.71–0.90 (moderate), and >0.90 (high). The optimal cut-off value was determined based on the Youden index (sensitivity + specificity - 1), and the sensitivity and specificity corresponding to this cut-off value were calculated. To quantify the random fluctuation range of the indicators, the DeLong method was employed to compute the 95% confidence interval (95% CI) of AUC. The Bootstrap method (1000 repeated samplings, with the sampling ratio consistent with the original sample) was used to verify and calculate the 95% CIs of sensitivity and specificity. Calibration was assessed using calibration plots and the Hosmer–Lemeshow goodness-of-fit test, with closer alignment between the predicted and observed outcomes indicating better model fit. Clinical utility was assessed through decision curve analysis (DCA).
A p-value < 0.05 was considered statistically significant. A detailed flowchart illustrating the statistical analysis process is presented in Figure 1.
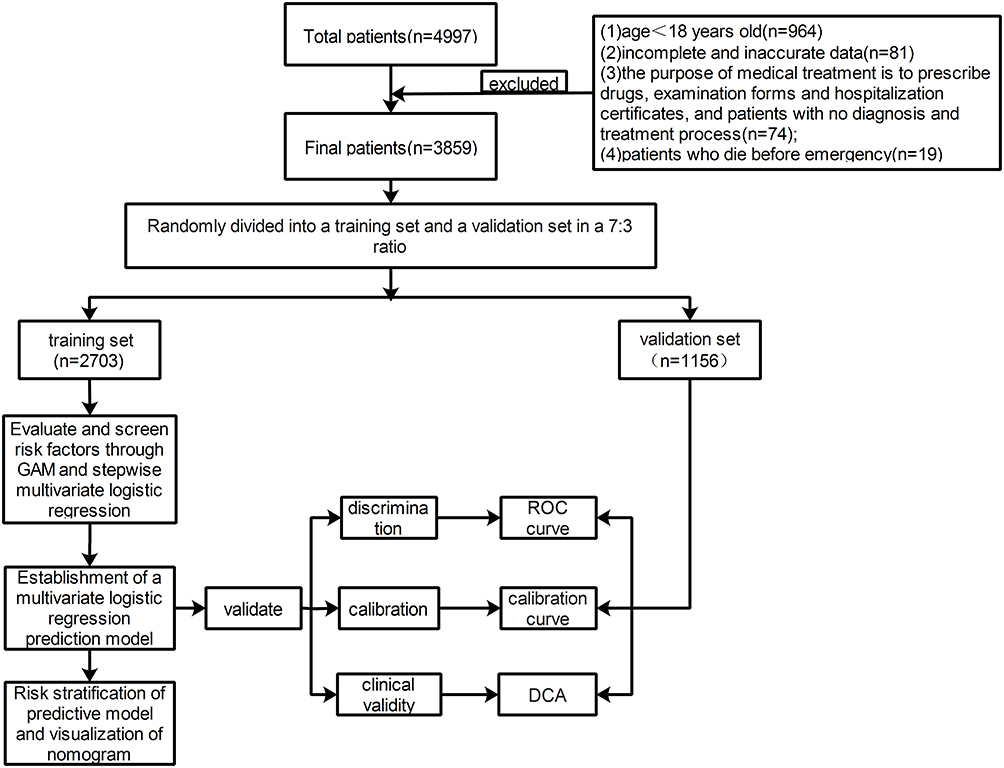 |
Figure 1 Flowchart of study design. Patients were screened based on predefined criteria. Eligible patients were randomly divided into a training set and a validation set in a 7:3 ratio. The training set was used to identify independent risk factors through GAM and multivariate logistic regression analysis and to construct a predictive model. Model validation was performed through assessments of discrimination (ROC curve), calibration (calibration plot and Hosmer–Lemeshow test), and clinical utility (DCA). Risk stratification was performed using the conditional inference tree method, and the final model was visualized using a nomogram. Abbreviations: GAM, Generalized additive models; ROC, Receiver Operating Characteristic; DCA, decision curve analysis. |
Results
Results of Variable Effect Exploration and Grouping Optimization
A total of 3,859 patients in the ED were included in this study, comprising of 2,703 patients in the training set and 1,156 patients in the validation set. Of these, 612 patients (15.9%) were determined to be critical cases. The cohort included 1,970 males (51.0%) and 1,889 females (49.0%). GAM analysis revealed significant non-linear associations of age and pain score with critical risk: age-related critical risk increased gently before 40 years, accelerated after 40 years, and further intensified after 60 years. In addition, the critical illness risk varied notably when the pain score was around 4 points (Figure 2). Accordingly, age was categorized into three groups (<40, 40–59, ≥60 years) and pain score initially into two groups (<4 vs ≥4 points) for multivariate logistic regression.
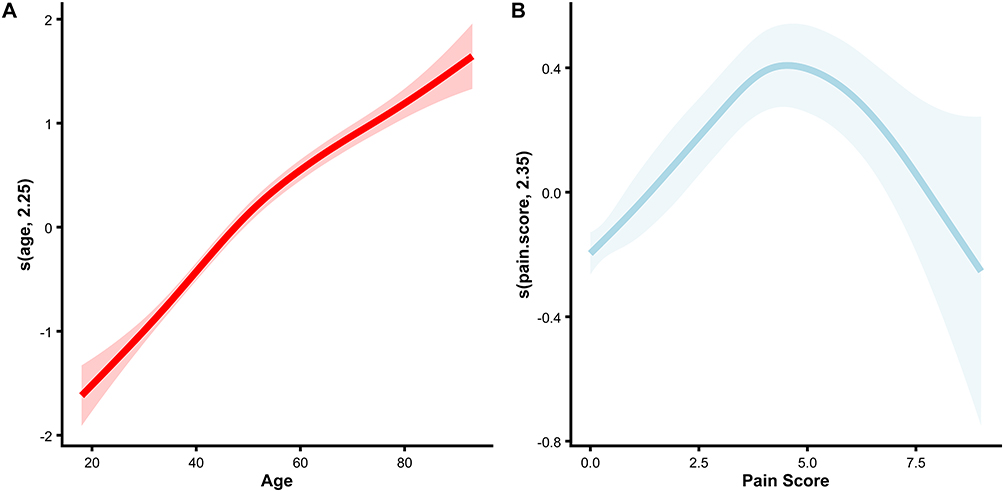 |
Figure 2 Non-linear Effect of Age and Pain Score. (A) Non-linear relationship between age and the log odds of critical risk, assessed via generalized additive model (GAM). The solid line represents the estimated smooth function, and the shaded area denotes the 95% confidence interval. (B) Non-linear relationship between pain score and the log odds of critical risk, assessed via GAM. The solid line represents the estimated smooth function, and the shaded area denotes the 95% confidence interval. Abbreviation: GAM, Generalized additive models. |
General Data
Comparisons between the training and validation sets regarding sex, age, body temperature, HR, R, SBP, SpO2, pain score, level of consciousness, pupil status, mental status, peripheral circulation, urine output, and profuse sweating indicated no statistically significant differences (p> 0.05), indicating comparability between the two groups (see Table 2).
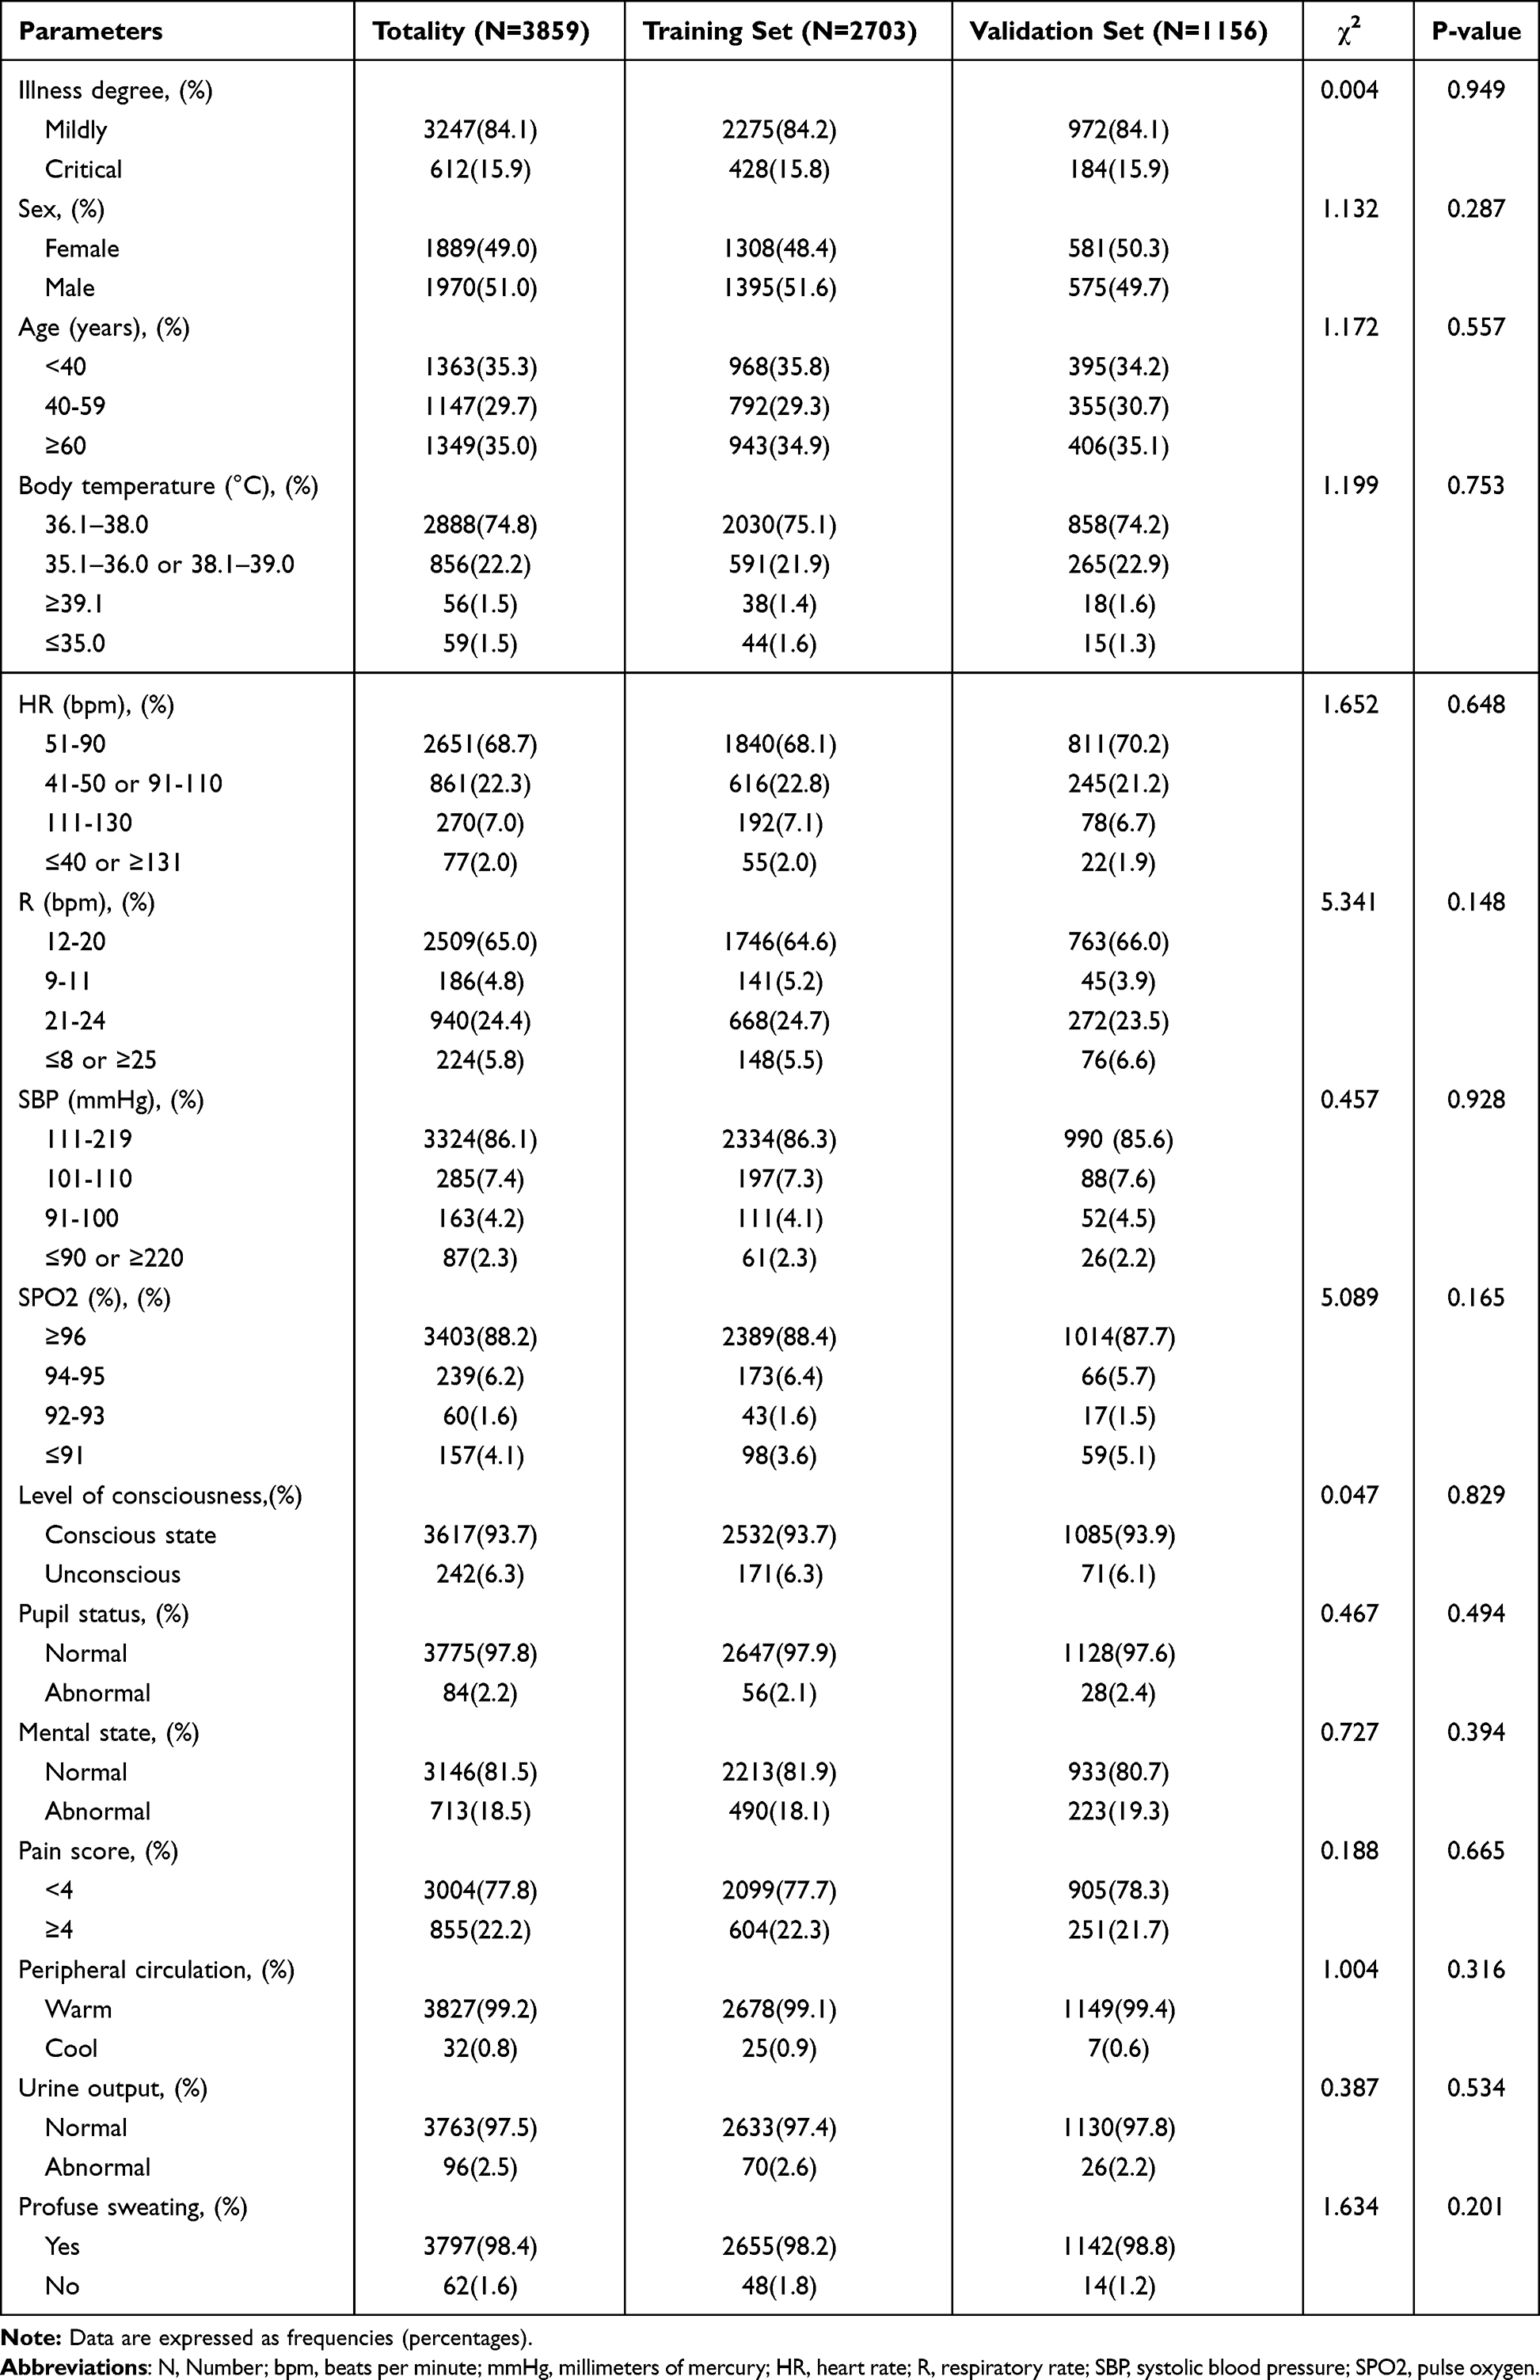 |
Table 2 Baseline Clinical Characteristics of the Training and Validation Sets |
Development of the Predictive Model via Stepwise Multivariate Logistic Regression
Stepwise multivariate logistic regression analysis showed that sex, age, HR, R, SBP, SpO2, level of consciousness, pupil status, mental state, and pain score exhibited obvious gradient effects on critical risk (all p<0.05). Compared with the reference group of < 40 years old, patients aged 40–59 years (OR = 3.983, 95% CI: 2.534–6.384) and ≥ 60 years old (OR = 7.691, 95% CI: 5.020–12.089) had significantly increased critical risk, which increased with age; compared with the reference group of males, female patients had a higher critical risk (OR = 2.276, 95% CI: 1.674–3.113); in terms of vital signs, the critical risk was significantly elevated when HR was ≤ 40 beats/min or ≥ 131 beats/min (OR = 8.726, 95% CI: 3.782–19.792), R was ≤ 8 beats/min or ≥ 25 beats/min (OR = 9.662, 95% CI: 5.583–16.609), SBP was ≤ 90 mmHg or ≥ 220 mmHg (OR = 7.930, 95% CI: 3.592–17.200), and SPO2 was ≤ 91% (OR = 6.458, 95% CI: 3.142–13.807), and the risk of each indicator increased with the severity of abnormalities; regarding level of consciousness and pupil status, patients with unconsciousness (OR = 7.039, 95% CI: 4.208–11.907) and abnormal pupil status (OR = 5.168, 95% CI: 1.546–18.925) had significantly increased critical risk; in terms of clinical symptoms, abnormal mental state was the strongest predictor (OR = 10.244, 95% CI: 7.407–14.254), and moderate to severe pain (≥ 4 points, OR = 1.727, 95% CI: 1.232–2.413) was also associated with the critical outcome (see Table 3).
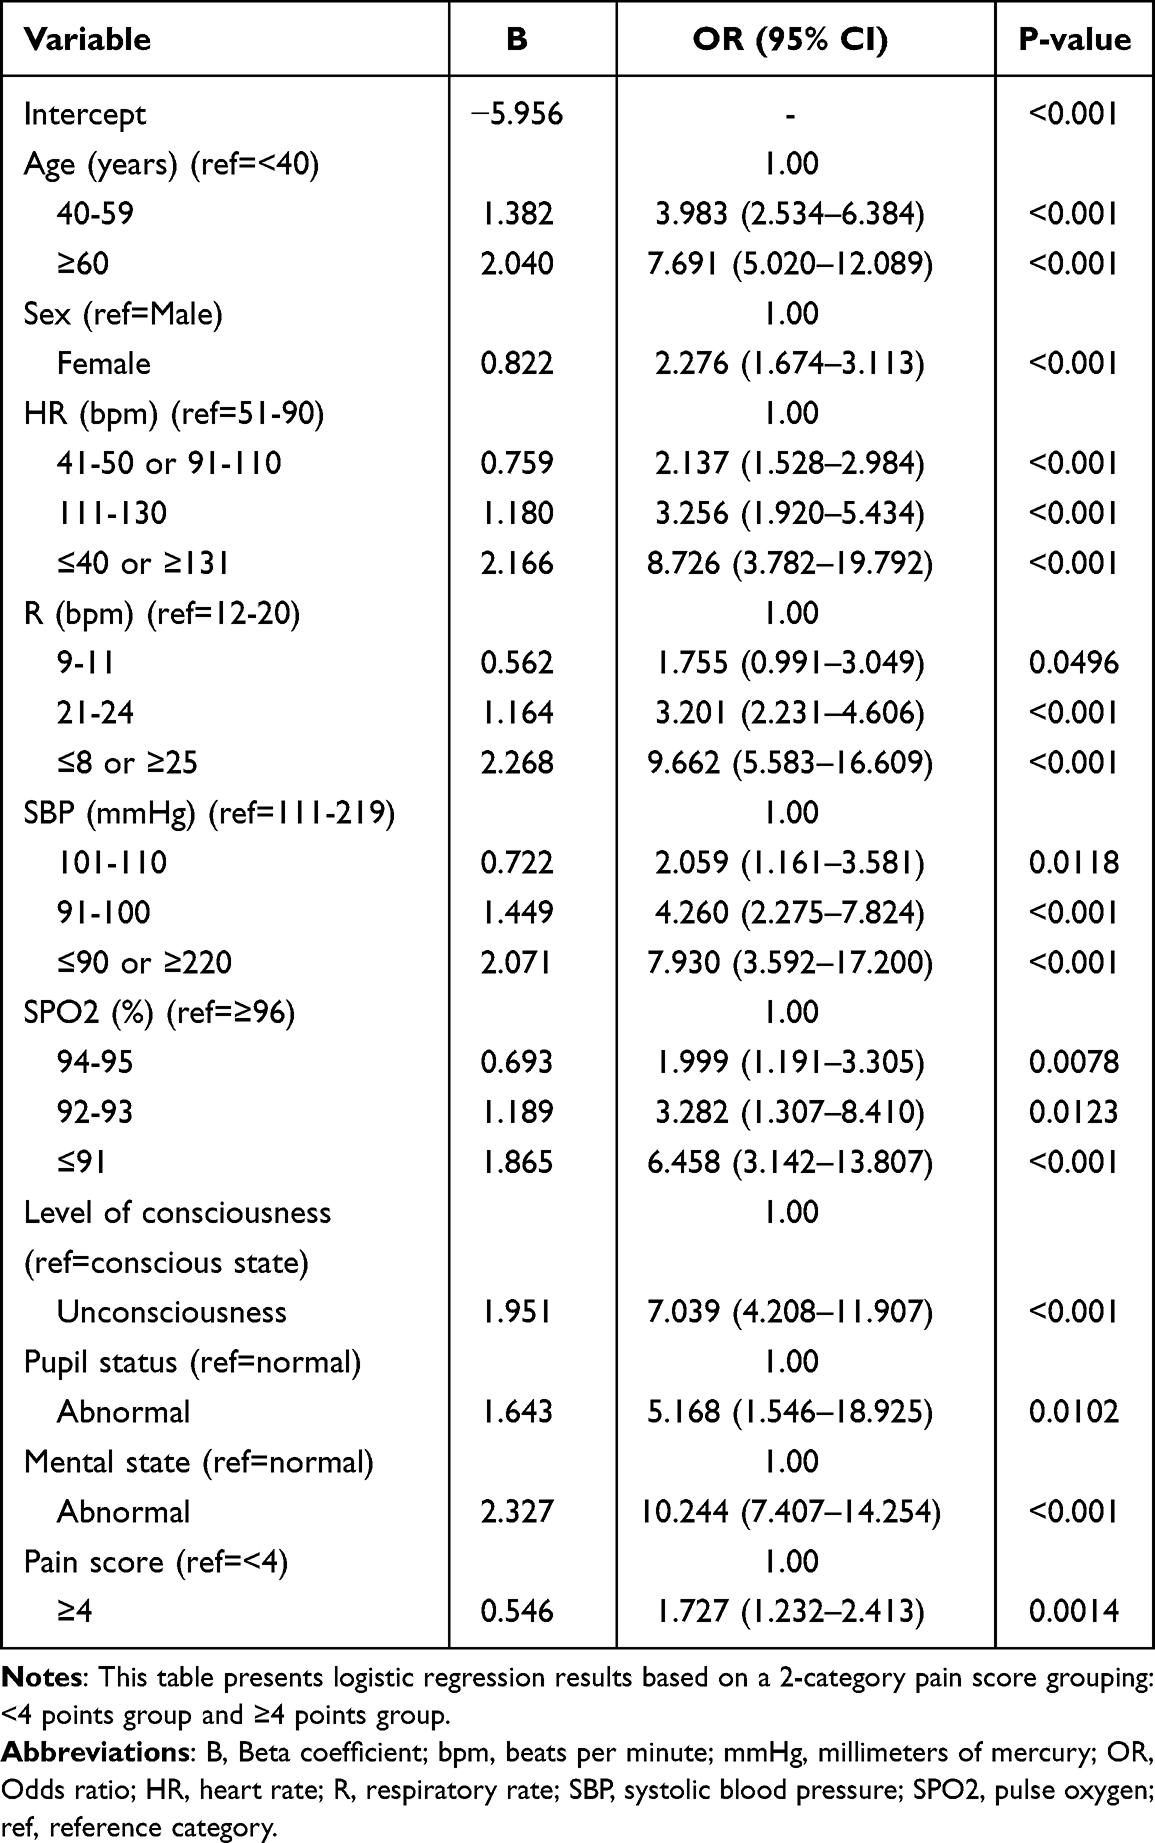 |
Table 3 Logistic Regression Analysis Results of Training Set |
Risk Stratification and Nomogram Construction
Predictive probabilities were calculated for each patient in the training set using the developed prediction model (Figure 3A). The distribution of these probabilities demonstrated a distinct positive skewness, indicating a decreasing number of patients as the predicted risk of critical condition increased.
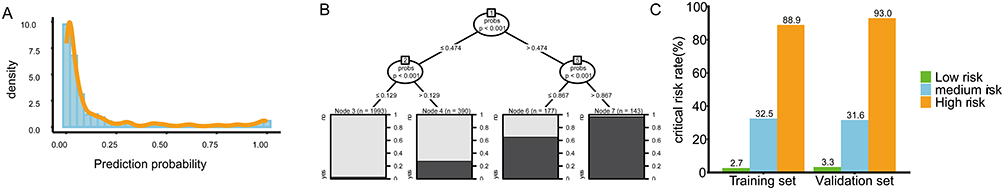 |
Figure 3 Analysis of predicted clinical risk probabilities and risk stratification in patients in the ED. (A) Distribution of predicted probabilities for critical risk in the training set, calculated using the multivariate logistic regression model. (B) Risk stratification based on the conditional inference tree (CIT) method. (C) Comparison of actual critical risk rates and mean predicted probabilities across different risk levels. Abbreviation: ED, Emergency department. |
Risk stratification was performed using the CIT method to classify the predicted probabilities in the training set (Figure 3B). An initial two-level CIT-based partition yielded four risk groups based on thresholds at 0.129 and 0.867. To enhance clinical applicability, the two intermediate groups (0.129–0.867) were merged, resulting in three final risk categories: low risk (p≤0.129), medium risk (0.129<p≤0.867), and high risk (p>0.867). Observed critical risk rates and mean predicted probabilities in both the training and validation sets were consistent across these three categories (Figure 3C).
A nomogram was constructed to visualize the predictive model (Figure 4). The nomogram incorporated ten risk factors and their corresponding scores. A total score was generated by summing the individual scores for each variable. A perpendicular line drawn from the total score to the probability axis yielded the estimated probability of critical risk, representing allowing clinicians to intuitively assess the likelihood of critical risk in patients in the ED.
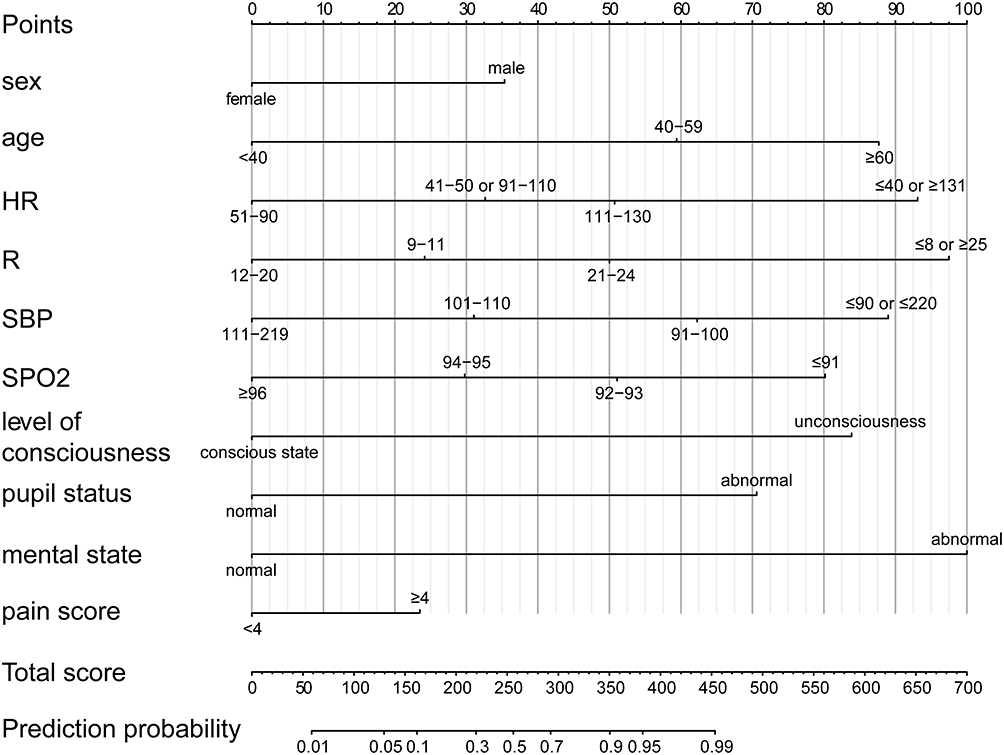 |
Figure 4 Nomogram based on the multivariate logistic regression model. The nomogram presents final predictive model derived from the training set, incorporating the ten identified risk factors. Risk stratification thresholds established by the conditional inference tree method are integrated into the model. Abbreviations: HR, Heart rate; R, Respiratory rate; SBP, systolic blood pressure; SPO2, pulse oxygen. |
Validation of the Predictive Model
Discrimination
The discriminative ability of the model in the training and validation sets was evaluated through ROC curve analysis (Figures 5A and B). For the training set, the AUC of the ROC curve was 0.926 (95% CI: 0.913–0.940), and the optimal cut-off value determined by the Youden index was 0.132, corresponding to a sensitivity of 0.850 (95% CI: 0.818–0.883) and a specificity of 0.848 (95% CI: 0.834–0.862). For the validation set, the AUC of the ROC curve was 0.914 (95% CI: 0.889–0.938), with an optimal cut-off value of 0.168 that yielded a sensitivity of 0.826 (95% CI: 0.778–0.885) and a specificity of 0.866 (95% CI: 0.821–0.866).
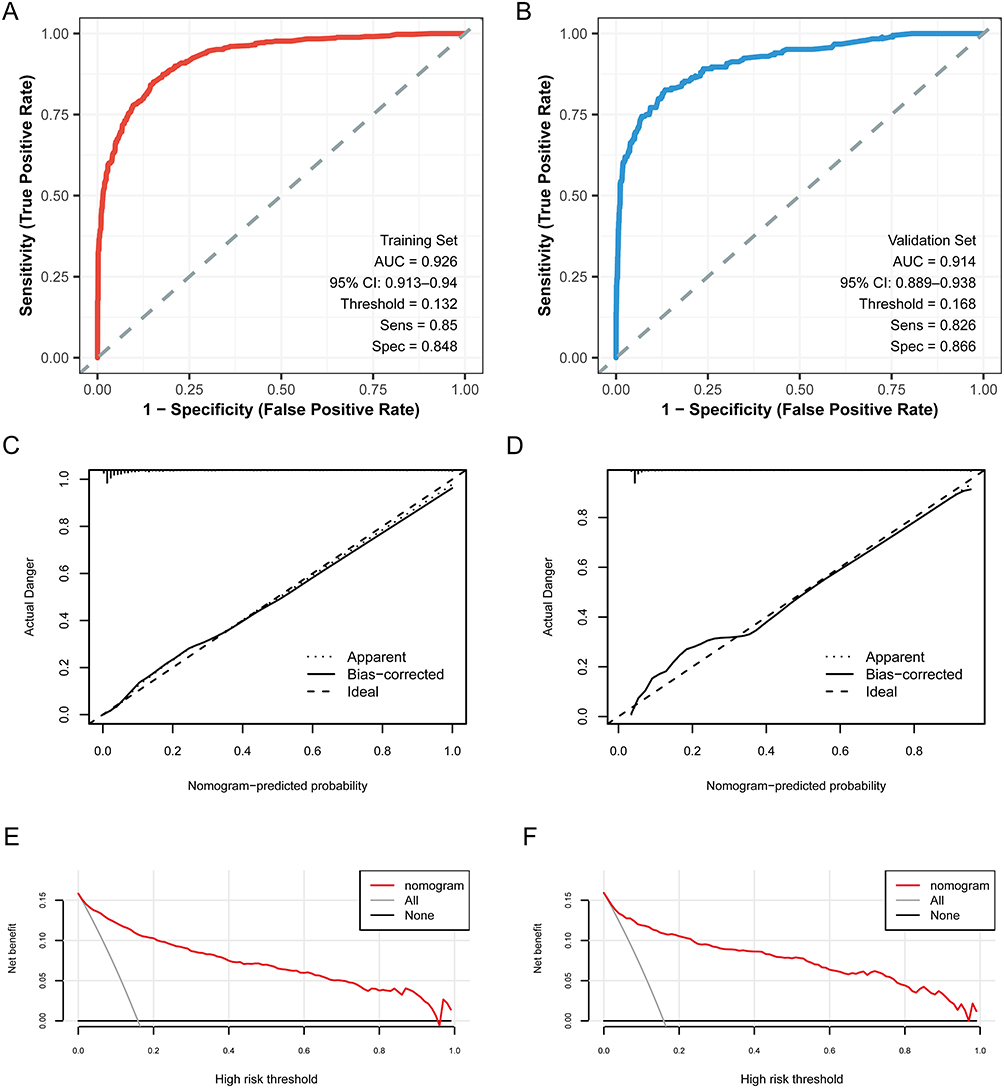 |
Figure 5 Validation of the ED critical risk prediction model. Model validation was conducted in both the training and validation sets, with assessments of discrimination, calibration, and clinical utility. (A) Receiver operating characteristic (ROC) curve demonstrating the model’s discrimination performance in the training set. (B) ROC curve demonstrating discrimination in the validation set. (C) Calibration curve in the training set. (D) Calibration curve in the validation set. (E) Decision curve analysis (DCA) evaluating clinical utility in the training set. (F) DCA assessing clinical utility in the validation set. Abbreviations: ED, Emergency department; ROC, Receiver Operating Characteristic; DCA, decision curve analysis. |
The AUC values of both sets exceeded 0.90, and the 95% CI intervals were narrow (the width of the AUC interval in the training set was only 0.027, and that in the validation set was 0.049), indicating high reliability of the point estimates. There was significant overlap in the 95% CIs of AUC between the training and validation sets (both covering the interval of 0.91–0.93), demonstrating the stability of the model’s discriminative ability across different datasets.
Calibration
Calibration plots were used to assess the agreement between predicted and observed outcomes. In the training set, the calibration curve of the model closely aligned with the standard reference line. In the validation set, a slightly deviation was observed, however, overall alignment remained acceptable (Figures 5C and D). Hosmer-Lemeshow tests yielded results of χ2 = 9.292, p = 0.318, and χ2 = 5.942, p = 0.654 for the training set and the validation set, respectively. In both cases, p-values were greater than 0.05, indicating no statistically significant differences, confirming good model calibration.
Clinical Utility
The clinical utility of the model was assessed using DCA (Figures 5E and F). In the DCA plots, the x-axis represents the threshold probability, and the y-axis represents the net benefit. The horizontal line reflects the assumption that no patients are assumed to be critically ill and thus none receive intervention, resulting in a net benefit of zero. The diagonal line reflects the assumption that all patients are assumed to be critically ill and therefore all receive intervention, resulting a decreasing net benefit. In both the training and validation sets, the net benefit obtained with the prediction model was greater than that of the two extreme curves across a considerable range of threshold probabilities, demonstrating clinical utility.
Visualization Application of the Predictive Model
A user-friendly web-based interface was developed based on the constructed predictive model to facilitate individualized risk estimation for critical conditions in patients in the ED (https://hbghemergency85988120.shinyapps.io/dynnomapp-1/). The web interface uses R’s Shiny framework, with a step-by-step input form for the 10 predictors. After input, it instantly generates: (1) predicted critical risk probability; (2) risk level (low/medium/high); (3) a simplified nomogram for reference. For example, in the case of a 68-year-old female patient with a heart rate of 95 beats per minute, respiratory rate of 22 breaths per minute, systolic blood pressure of 105 mmHg, SPO2 of 95%, clear consciousness, normal pupils, impaired mental status, and a pain score of 4 points, the predicted risk of critical condition was 0.908. This value exceeded the high-risk threshold of 0.867 defined in the model’s risk-stratification scheme. According to the DCA results, patients with predicted probabilities in the high-risk category may benefit from early and proactive intervention.
Discussion
Emergency medicine differs from other disciplines in its strong emphasis on timely intervention. In the ED, early identification of life-threatening conditions is essential to facilitate prompt and appropriate clinical management.1,13 In recent years, overcrowding in EDs has become increasingly prevalent, making it crucial to identify critically ill patients early under high-workload conditions and to enhance the accuracy of triage and assessment.2,13,14 Current approaches to identifying critically ill patients in the ED primarily depend on the evaluation of vital signs, the NEWS, the Expert Consensus on Emergency Triage, and the adult five-level emergency triage system.15,16 Scoring systems that rely on a limited number of variables are convenient to implement but may lack accuracy, whereas models that incorporate a broader range of indicators often improve accuracy but include variables that are not easily obtainable, potentially prolonging triage time. Furthermore, the inclusion of subjective indicators may introduce variability in assessments performed by medical professionals and triage systems, thereby increasing the risk of over-triage or under-triage.
This study incorporated predictive indicators that are readily available in routine clinical practice to construct a visualized prediction model for early risk estimation of critical illness in ED patients. The primary aim was to ensure that all predictors could be conveniently obtained during the initial clinical assessment, thereby enabling real-time triage, shortening assessment time, and facilitating into primary healthcare settings.
Risk Factors of the Predictive Model
Current studies on the early identification of critically ill patients in the ED have examined parameters such as body temperature, HR, R, SBP, SPO2, pain score, levels of consciousness, pupil status, mental status, glucose levels, complete blood count, creatinine, and potassium levels. However, no universally accepted set of predictive indicators has been established.3,8,10,17,18
In this study, multivariate logistic regression analysis identified sex, age, HR, R, SBP, SPO2, level of consciousness, pupil status, mental status, and pain score as independent risk factors for the early prediction of critical risk in patients in the ED. Conversely, body temperature, peripheral circulation, urine output, and profuse sweating were not identified as independent risk factors.
Age-related physiological decline and the higher prevalence of chronic conditions such as diabetes mellitus, coronary artery disease, hypertension, and stroke among older adults in China have been well documented.19,20 Older adults account for a substantial proportion of ED visits.21 Age was identified as a risk factor in the prediction model, with the probability of critical risk increasing progressively with advancing age. This finding is consistent with previous studies, including that by Yang et al, which reported a higher incidence of critical condition and resuscitation procedures among older adult patients in the ED.22 The mean age of patients in the present study was 50.61 ± 18.99 years.
Sex was also identified as a significant predictor, with male patients exhibiting a higher risk of critical illness than female patients (OR 2.276, 95% CI: 1.674–3.113). Although the overall proportion of male and female patients was similar, the risk distribution was skewed toward males. Kim et al reported higher mortality rates among males, and Engebretsen et al observed an increased rate of ICU admission in male patients.23,24 This disparity may be associated with the predominance of males in the workforce and their higher susceptibility to severe acute conditions such as cardiovascular and cerebrovascular diseases.
HR, R, SBP, SpO2, and level of consciousness are widely used vital signs in clinical practice for monitoring disease progression and predicting severity and mortality.3–5,8,10,15,16 During model development, heart rate, respiratory rate, systolic blood pressure, and SpO2 were initially considered as continuous numerical variables. However, in clinical practice, heart rate, respiratory rate, and systolic blood pressure demonstrate critical implications at both low and high values, indicating non-linear associations. For example, SpO2 values between 96% and 100% indicate minimal variation in risk level. Accordingly, these four parameters were categorized and assigned values according to the NEWS system. Level of consciousness was treated as a binary variable. Incorporation of these parameters into the predictive model identified heart rate, respiratory rate, systolic blood pressure, SpO2, and impaired consciousness as risk factors for the early prediction of critical condition in the ED, consistent with findings reported by Kim et al and Simnawa et al.18,23
Along with the assessment of the central nervous system through changes in consciousness, abnormalities in pupil size and pupillary light reflex (PLR) were identified as significant predictors (OR 5.168, 95% CI: 1.546–18.925). Pupillary examination plays an important role in monitoring parameters in patients with impaired consciousness.25 Minami et al reported that pupillometry in the ED offers a faster and more accessible method for assessing consciousness than electroencephalography or imaging modalities.26 However, direct examination with a flashlight is less accurate than automated pupillometry. Future ED practice may benefit from integrating more accurate and accessible pupil assessment tools.27
Mental status was identified as a risk factor in this predictive model (OR 10.244, 95% CI: 7.407–14.254), with the highest OR value among the 10 risk factors. Mental lethargy is frequently associated with critical conditions such as pneumonia, acute myocardial infarction, and various forms of shock. However, limited attention has been given in Chinese and international studies to the role of mental status in assessing critical condition among patients in the ED, underscoring the need for greater clinical consideration of this parameter.
Pain, a frequent presenting complaint in the ED, was also identified as a risk factor for critical condition (OR 1.727, 95% CI: 1.232–2.413). Pain can induce changes in heart rate and blood pressure and is a prominent manifestation of disease exacerbation. Giusti et al and Hämäläinen et al recognized pain as the fifth vital sign, although they also emphasize the considerable challenges and variability associated with acute pain assessment in the ED setting.28,29 Discrepancies between clinician and patient ratings, ED overcrowding, and the administration of analgesics may influence pain scores. These factors highlight the need for more standardized and nuanced approaches to pain assessment in emergency settings.
Body temperature, peripheral circulation, urine output, and profuse sweating were not identified as independent risk factors in this study. Kim et al and Kushimoto et al reported that hypothermia is positively correlated with disease severity in critically ill patients with sepsis, whereas hyperthermia and normal body temperature provide limited value for assessment.23,30 In the present study, no categorized body temperature range was associated with critical risk. This outcome may be attributable to the limited accuracy of axillary temperature measurements, which are affected by ambient temperature, emotional agitation, and patient cooperation, thereby reducing their evaluative value in the ED. Similarly, variables such as profuse sweating and peripheral circulation are substantially influenced by environmental and subjective factors. Few studies have incorporated these variables into predictive models, indicating the need for further investigation with more refined assessment criteria. Although urine output is a well-established indicator of circulatory and renal function, its reliability is diminished in patients with chronic renal failure, which may explain its exclusion as a significant risk factor in this model.
Visualized Prediction Model
Currently, limited research is available on the development and implementation of predictive models for the early identification of critical risk in patients in the ED within clinical practice. Nomograms provide a convenient method for individualized risk estimation and have demonstrated significant clinical utility.31 In this study, a nomogram was constructed based on the final prediction model to provide an intuitive and accessible means of estimating critical risk in the ED. In parallel, the CIT method was used to stratify patients into clinically meaningful risk categories. The results indicated that a predicted risk greater than0.867 represented a high-risk scenario in which immediate intervention would be clinically beneficial. Conversely, a predicted risk less than or equal to 0.129 suggested that intervention could be deferred, and dynamic observation maintained. Predicted risks within the intermediate range warranted close monitoring, with therapeutic strategies adjusted in response to changes in the patient’s condition. This tiered risk stratification supports more efficient resource allocation and may help mitigate ED overcrowding.
Promotion of the Model
The real-world implementation of this model is divided into three concise and feasible phases: integration with existing systems, pilot application, and full-scale promotion. In practice, the model will first be embedded into the current electronic medical record systems of hospitals, followed by pilot testing and iterative optimization across hospitals at different levels, and ultimately promoted through standardized training programs. Potential challenges compared with existing triage systems include healthcare providers’ lack of confidence in adopting the new model and differences in equipment or system configurations among hospitals. To address these, we have developed targeted strategies: simplified and easy-to-understand training materials that do not require staff to learn complex theoretical principles, role-specific training modules, implementation plans tailored to the technical capabilities of each hospital, and system-level optimizations to ensure smooth operation. In addition, continuous evaluation will be conducted from both process and clinical outcome perspectives to ensure the model effectively supports and enhances frontline clinical practice.
Study Limitations
This study adopted a retrospective design, with data derived from existing clinical records. Although the risk of documentation bias was mitigated through independent data extraction by two researchers, and only 2.1% of data with missing values were excluded, the inherent limitations of retrospective studies cannot be fully eliminated. The study sample was exclusively collected from a single institution, which may restrict the generalizability of the findings to other clinical settings. The applicability of the model in diverse populations and healthcare environments remains to be validated. In future research, multi-center data with a larger sample size should be incorporated, and external validation should be conducted across various clinical scenarios to further enhance the robustness and generalizability of the model.
Conclusion
We identified 10 independent risk factors for the early prediction of ED patients and developed a nomogram-based risk stratification model. This model exhibits excellent discriminatory ability, good calibration, and strong clinical utility. Notably, all predictors are readily accessible during the initial clinical assessment, enabling its application in real-time triage and holding promise for integration into primary healthcare settings.
Abbreviations
ED, Emergency department; ESI, Emergency Severity Index; CTAS, Canadian Triage and Acuity Scale; MTS, Manchester Triage System; NEWS, National early warning score; HR, Heart rate; R, Respiratory rate; SBP, systolic blood pressure; SPO2, pulse oxygen; GAM, Generalized additive models; ROC, Receiver Operating Characteristic; AUC, area under the subject working characteristic curve; DCA, decision curve analysis; CI, confidence interval; OR, Odds ratio.
Data Sharing Statement
All data generated or analysed during this study are included in this article. Further enquiries can be directed to the corresponding author.
Ethics Approval
The study was conducted in accordance with the principles of the Declaration of Helsinki, and the study protocol was approved by Hebei General Hospital ethics committee (2025 Research Ethics Review No. 445). Due to the retrospective nature of the study, the requirement of patient consent for inclusion was waived. Patient personal privacy and data confidentiality has been upheld.
Acknowledgments
We would like to acknowledge the hard and dedicated work of all the staff that implemented the intervention and evaluation components of the study.
Funding
This study was supported by a grant from 2025 Government-funded Training Program for Outstanding Talents in Clinical Medicine (No.ZF2025009).
Disclosure
The authors declare that they have no conflicts of interest relevant to this study.
References
1. Yu XZ. The development and development of emergency medicine. Pract J Clin Med. 2012;9:1–15. doi:10.3969/j.issn.1672-6170.2012.01.001
2. Tan ZX, Wu ST, Chen YQ. Research on the causes and management countermeasures of emergency critical patients’ retention in tertiary public hospitals. Chin Hospital Manage. 2021;41:42–46.
3. Kuriuama A, Urushisani S, Nakauama T. Five-level emergency triage systems: variation in assessment of validity. Emerg Med J. 2017;34:703–710. doi:10.1136/emermed-2016-206295
4. Davis S, Ju C, Marchandise P, et al. Impact of pain assessment on canadian triage and acuity scale prediction of patient outcomes. Ann Emerg Med. 2022;79:433–440. doi:10.1016/j.annemergmed.2022.01.014
5. Zaboli A, AusserhofeR D, Pfeifer N, et al. Acute abdominal pain in triage: a retrospective observational study of the manchester triage system’s validity. J Clin Nurs. 2021;30(7–8):942–951. doi:10.1111/jocn.15635
6. Ministry of Health PRC. Guidelines for grading the condition of emergency patients (draft for comment). Chin J Critic Care Med. 2011;4:241–243. doi:10.3877/cma.j.issn.1674-6880.2011.04.006
7. Mistry B, Stewart De Ramirez S, Kelen G, et al. Accuracy and reliability of emergency department triage using the emergency severity index: an international multicenter assessment. Ann Emerg Med. 2018;71:581–587.e3.
8. Emergency Pre-screening Expert Consensus Group. Emergency pre-screening expert consensus. Chin J Emerg Med. 2018;27:599–604 10.3760/cma.j.issn.1671-0282.2018.06.006
9. Royal College of Physicians. National Early Warning Score (NEWS) 2: Standardising the Assessment of Acute-Illness Severity in the NHS. London Royal college of physicians; 2017.
10. Bao Y, Wang S, Zhuo L, et al. Research on the conversion model of pain assessment tools in critical ill adults. J Xuzhou Med Univ. 2022;42(05):385–390. doi:10.3969/j.issn.2096-3882.2022.05.014
11. Riley RD, Ensor J, Snell KIE, et al. Calculating the sample size required for developing a clinical prediction model. BMJ. 2020;368:m441. doi:10.1136/bmj.m441
12. Hu Q, Hong X, Xu L, Jia R. A nomogram for accurately predicting the pathological upgrading of prostate cancer, based on 68 Ga-PSMA PET/CT. Prostate. 2022;82(11:1077–1087. doi:10.1002/pros.24358
13. Sartini M, Carbone A, Demartini A, et al. Overcrowding in emergency department: causes, consequences, and solutions-a narrative review. Healthcare. 2022;10(9):1625. doi:10.3390/healthcare10091625
14. Badr S, Nyce A, Awan T, et al. Measures of emergency department crowding, a systematic review. how to make sense of a long list. Open Access Emerg Med. 2022;14:5–14. doi:10.2147/OAEM.S338079
15. Li HW. Comparative analysis of application of vital sign assessment method and early warning scoring method in emergency treatment. J Rational Drug Use Clin Pract. 2018;11:130–131. doi:10.15887/j.cnki.13-1389/r.2018.31.075
16. Mao SL, Cao J, Gong LL, et al. V5 adult emergency triage criteria for accurate classification of critically ill patients: a real-world retrospective study. Chin J Critic Care Emerg Med. 2016;28:828–833.
17. Fu YW, Liang Y, Ge HX, et al. Comparative study of emergency system risk prediction model and improved early warning score to predict short-term mortality of critically ill patients in emergency department. China Emerg Med. 2020;40:922–925. doi:10.3969/j.issn.1002-1949.2020.10.003
18. Simbawa JH, Jawhari AA, Almutairi F, et al. The association between abnormal vital signs and mortality in the emergency department. Cureus. 2021;13:e20454. doi:10.7759/cureus.20454
19. Wang B. Health status and health changes of older adults in China and the relevant socioeconomic impacts:an analysis based on the data of the seventh national census. J Yunnan Minzu Univer. 2022;68–75. doi:10.13727/j.cnki.53-1191/c.20220905.007
20. Tu Q, Hyun K, Hafiz N, et al. Age-Related variation in the provision of primary care services and medication prescriptions for patients with cardiovascular disease. Int J Environ Res Public Health. 2022;19(17):10761. doi:10.3390/ijerph191710761
21. Dai RX, Meng Q, Chen GB, et al. Epidemiological characteristics among emergency triage patients in a comprehensive Tertiary Hospital in Kunming in 2020. J Kunming Med Univ. 2022;43:81–86. doi:10.12259/j.issn.2095-610X.S20220811
22. Yang ZW, Jian ZJ, Liu YH, et al. Clinical characteristics of emergency care for elderly critically ill patients. Chin J Gerontol. 2021;41:1010–1013. doi:10.3969/j.issn.1005-9202.2021.05.035
23. Kim S, Kang H, Cho Y, et al. Emergency department utilization and risk factors for mortality in older patients: an analysis of Korean National Emergency Department Information System data. Clin Exp Emerg Med. 2021;8:128–136. doi:10.15441/ceem.20.098
24. Engebretsen S, Bogstrand ST, Jacobsen D, et al. Characteristics, management and outcome of critically ill general medical patients in the Emergency Department: an observational study. Int Emerg Nurs. 2021;54:100939. doi:10.1016/j.ienj.2020.100939
25. Couret D, Boumaza D, Grisotto C, et al. Reliability of standard pupillometry practice in neurocritical care: an observational, double-blinded study. Crit Care. 2016;20:99. doi:10.1186/s13054-016-1239-z
26. Minami Y, Mishima S, Oda J. Prediction of the level of consciousness using pupillometer measurements in patients with impaired consciousness brought to the emergency and critical care center. Acute Med Surg. 2020;7(1):e537. doi:10.1002/ams2.537
27. Olsen MH, Jensen HR, Ebdrup SR, et al. Automated pupillometry and the FOUR score - what is the diagnostic benefit in neurointensive care. Acta Neurochir. 2020;162:1639–1645. doi:10.1007/s00701-020-04381-y
28. Giusti GD, Reitano B, Gili A. Pain assessment in the emergency department. Correlation between pain rated by the patient and by the nurse. An observational study. Acta Biomed. 2018;64–70. doi:10.23750/abm.v89i4-S.7055
29. Hämäläinen J, Kvist T, Kankkunen P. Acute pain assessment inadequacy in the emergency department: patients’ perspective. J Patient Exp. 2022. 9;23743735211049677. doi:10.1177/23743735211049677
30. Kushimoto S, Abe T, Ogura H, et al. Impact of body temperature abnormalities on the implementation of sepsis bundles and outcomes in patients with severe sepsis: a retrospective sub-analysis of the focused outcome research on emergency care for acute respiratory distress syndrome, sepsis and trauma study. Crit Care Med. 2019;47(5):691–699. doi:10.1097/CCM.0000000000003688
31. Kong X, Li J, Cai Y, et al. A modified TNM staging system for non-metastatic colorectal cancer based on nomogram analysis of SEER database. BMC Cancer. 2018;18:50. doi:10.1186/s12885-017-3796-1
 © 2026 The Author(s). This work is published and licensed by Dove Medical Press Limited. The
full terms of this license are available at https://www.dovepress.com/terms
and incorporate the Creative Commons Attribution
- Non Commercial (unported, 4.0) License.
By accessing the work you hereby accept the Terms. Non-commercial uses of the work are permitted
without any further permission from Dove Medical Press Limited, provided the work is properly
attributed. For permission for commercial use of this work, please see paragraphs 4.2 and 5 of our Terms.
© 2026 The Author(s). This work is published and licensed by Dove Medical Press Limited. The
full terms of this license are available at https://www.dovepress.com/terms
and incorporate the Creative Commons Attribution
- Non Commercial (unported, 4.0) License.
By accessing the work you hereby accept the Terms. Non-commercial uses of the work are permitted
without any further permission from Dove Medical Press Limited, provided the work is properly
attributed. For permission for commercial use of this work, please see paragraphs 4.2 and 5 of our Terms.