Back to Journals » Diabetes, Metabolic Syndrome and Obesity » Volume 14
Development and Internal Validation of a Prognostic Model for 4-Year Risk of Metabolic Syndrome in Adults: A Retrospective Cohort Study
Authors Zhang H, Chen D, Shao J, Zou P ![]() , Cui N
, Cui N ![]() , Tang L
, Tang L ![]() , Wang D, Ye Z
, Wang D, Ye Z
Received 27 October 2020
Accepted for publication 22 April 2021
Published 18 May 2021 Volume 2021:14 Pages 2229—2237
DOI https://doi.org/10.2147/DMSO.S288881
Checked for plagiarism Yes
Review by Single anonymous peer review
Peer reviewer comments 2
Editor who approved publication: Prof. Dr. Antonio Brunetti
Hui Zhang,1 Dandan Chen,1 Jing Shao,1 Ping Zou,2 Nianqi Cui,3 Leiwen Tang,1 Dan Wang,1 Zhihong Ye1
1Zhejiang University, School of Medicine, Sir Run Run Shaw Hospital, Hangzhou, Zhejiang, People’s Republic of China; 2School of Nursing, Nipissing University, Toronto, Ontario, Canada; 3Department of Nursing, The Second Affiliated Hospital, Zhejiang University School of Medicine, Hangzhou, Zhejiang, People’s Republic of China
Correspondence: Zhihong Ye
Zhejiang University, School of Medicine, Sir Run Run Shaw Hospital, Qingchun Dong Road, Jianggan Strict, Hangzhou, Zhejiang, People’s Republic of China
Tel +86 13606612119
Email [email protected]
Purpose: A prognostic prediction model for metabolic syndrome can help nurses or physicians evaluate the future individual absolute risk of MetS in order to develop personalized care strategies. We aimed to derive and internally validate a prognostic prediction model for 4-year risk of metabolic syndrome in adults.
Patients and Methods: This was a retrospective cohort study conducted in a tertiary care setting, and the dataset was obtained from the Healthcare Information and Management Systems of a tertiary hospital. The cohort included Chinese adults attending health examination from 1 January 2011 to 31 December 2014. A total of 6793 participants without metabolic syndrome were included in the cohort and were followed up for 4 years. Available candidate predictors in the dataset were weight, MCV, MCH, AST, ALT, BMI, NGC, TC, serum uric acid, gender, smoking, WBC, LC, Hb, HCT, and age. A logistic regression model was adopted to build the risk equation, and bootstrapping was used when considering internal validation. Calibration, discrimination, and the clinical utility were calculated for the model’s performance.
Results: Of the 6793 participants, 1750 participants were diagnosed with metabolic syndrome within 4 years. The developed prediction model contained 5 predictors (body mass index, age, total cholesterol, alanine transaminase, and serum uric acid). After internal validation, the C-statistic was 0.783 (95% CI, 0.772– 0.795). Additionally, the current model had good calibration. Calibration slope was 0.995 (95% CI, 0.934– 1.058), and calibration intercept was − 0.008 (95% CI, − 0.088– 0.073). The Brier score was 0.156. The decision-curve analysis indicated that the prediction model provided greater net benefit than the default strategies of providing treatment or not providing treatment for all patients.
Conclusion: A prognostic risk prediction model for determining 4-year risk of metabolic syndrome onset in adults was developed and internally validated. This model was based on routine clinical measurements that quantified individual future risk of metabolic syndrome.
Keywords: prediction model, prognosis, metabolic syndrome, algorithms, calibration, discrimination
Introduction
Metabolic syndrome (MetS) refers to a group of risk factors for metabolic disorders: raised fasting plasma glucose, abdominal obesity, high cholesterol, and high blood pressure.1 The world’s adult population is facing a significant epidemic of MetS. In the Asia-Pacific region, nearly 20% of the adult population was influenced by MetS.2 Eleven cohort studies found that the prevalence of MetS was 15.7% in males and 14.2% in females among non-diabetic people in many European countries.3 This syndrome can increase the risk of developing atherosclerosis, cardiovascular disease, type 2 diabetes mellitus (T2DM), and all-cause mortality.4,5 Compared with people without metabolic syndrome, affected individuals are twice as likely to die of and three times as likely to have heart attacks or strokes.1 The metabolic syndrome results in cardiovascular-related illness, diabetes, and death, causing an inevitable and profound impact on global healthcare systems. Consequently, primary prevention and screening are needed to combat this epidemic and reduce the morbidity and mortality associated with it.
A prognostic prediction model can help nurses or physicians evaluate future individual absolute risk of MetS in order to develop personalized care strategies. Meanwhile, the prognostic prediction model can keep patients informed about their future outcomes and help patients appraise subsequent health management possibilities.6
We first conducted a systematic review to identify all existing prediction models for MetS by searching in English databases (PubMed, EMBASE, CINAHL, and Web of Science) and Chinese databases (Sinomed, WANFANG, CNKI, and CQVIP).7 Eleven prognostic prediction modelling studies were identified from 29,668 retrieved papers. For critical appraisal, the prediction model risk of bias assessment tool (PROBAST) was used to evaluate the risk bias and application of those prognostic prediction models. We found that all models were at a high risk of bias mainly caused by the low quality of the domains of outcome and statistical analysis (e.g., appropriate selection of predictors, missing data, transformation of predictors, and sample size). This suggests that it is not appropriate to apply any of them to clinical practice. Apart from this, it is recommended to develop and validate prediction models by adhering to TRIPOD (Transparent Reporting of a multivariable prediction model for Individual Prognosis Or Diagnosis) statement to improve the quality of a prediction model.
Therefore, by following TRIPOD, this study aimed to develop and internally validate a prognostic prediction model for MetS based on identified candidate predictors from the systematic review.
Methods
Study Design and Data Source
This was an observational study in a tertiary care setting, and one retrospective cohort was obtained from the Healthcare Information and Management Systems of a tertiary hospital. This cohort included Chinese adults attending health examination from 1 January 2011 to 31 December 2014. Participants were included if they attended health examination consecutively for 4 years (2011–2014) and were not diagnosed with metabolic syndrome at baseline. Participants were excluded if they were not adults (younger than 18) and were pregnant.
Outcomes
The outcome was metabolic syndrome (MetS), and the 2009 Joint Scientific Statement (harmonizing criteria 2009) was chosen to diagnose MetS.8 The criteria includes five risk factors: ① waist circumference (WC)≥85 cm (male); waist circumference≥80 cm (female) ② Triglycerides (TG)≥1.7 mmol/L or treatment; ③ lasma high-density lipoprotein cholesterol (HDL-C) <1.0 mmol/L (male) or treatment; Plasma high-density lipoprotein cholesterol <1.3 mmol/L (female) or treatment; ④ Systolic blood pressure (SBP)≥130 and/or diastolic blood pressure (DBP)≥85 mmHg or treatment ⑤ Fasting plasma glucose (FPG)≥5.6 mmol/L or treatment. MetS can be diagnosed if any three out of five were present.
Predictor Variables
Usually, predictors can be obtained from participant demographic characteristics, medical history, physical examination, and test results. It is recommended that candidate predictors should be obtained from a related prediction model systematic review.6,9 Before conducting this study, our team finished a related systematic review by searching English and Chinese databases. Eleven studies were finally included in the review, and a set of predictors were recommended for consideration as candidate predictors when developing prognostic prediction models for MetS because those predictors were used in at least two studies. They were serum HMW-adiponectin, total adiponectin, HOMA-IR, serum insulin, free fatty acids, weight, glycated albumin, hip circumference, physical activity, MCV, MCH, AST, ALT, BMI, NGC, TC, serum uric acid, LDL-cholesterol, gender, smoking, WBC, LC, Hb, HCT, and age. Information was extracted from the dataset. We found that serum HMW-adiponectin, total adiponectin, HOMA-IR, free fatty acids, glycated albumin, hip circumference, and physical activity were not available in the dataset, so these variables were excluded in the analysis. Additionally, there is a high possibility of multicollinearity between weight and BMI,10 and BMI is a more comprehensive index, so weight was excluded in the analysis. Serum insulin, smoking, and LDL-cholesterol were missing above 50% in the dataset. This means that it is not appropriate to conduct multiple imputation for them, so they were also excluded in the analysis. It is suggested that blind assessment of predictors and outcomes is vital for subjective judgment and assessment (eg, imaging, electrophysiology, and pathology results), but it is of minimal influence for candidate predictors in our study, such as age, sex, or quantitative laboratory values, because they were measured and were greatly independent of observer interpretation.11
Sample Size
In prediction modelling studies, the effective sample size can be determined by outcome events per variable (EPV); the number of participants with the outcome relative to the number of candidate predictor parameters should be ≥20. There were 14 candidate predictors in this study, so at least 320 participants with outcome events were needed.
Statistical Analysis
Multiple imputation with chained equations was used to deal with missing data, and five imputations were created because it was a pragmatic method to account for the size of the datasets and has a relatively high efficiency.12 All candidate predictors and the indicators of outcome were included in the imputation model.
Continuous predictors were kept as continuous, and continuous predictors that were not normally distributed were handled by log transformation. Fractional polynomial (FP) functions were adopted to deal with nonlinearity. We treated the presence of MetS within 4 years of follow-up as binary outcomes, so a logistic model was used to estimate the coefficients associated with potential predictors. The least absolute shrinkage and selection operator (LASSO) regression analysis was adopted to further limit the number of candidate predictors and select the most useful predictors among candidate predictors. This technique allows each predictor effect to be shrunk differently and eventually excludes some predictors to adjust overfitting and optimism. Predictors identified by LASSO method were entered into the logistic regression model to fit the model.13 We did not include any interactions in the final model, since previous studies rarely reported interactions in prediction models for MetS, and it is reasonable that interaction terms rarely add to the predictive ability of the prediction models.6
For model performance, discrimination (C-statistic) was assessed, and calibration was plotted. Additionally, calibration slope and intercept were calculated, and a prediction model with perfect calibration has a calibration slope of 1 and an intercept of 0 ideally.14 To evaluate the overall predictive ability, the Brier score was calculated. This score can be both influenced by discrimination and calibration, and therefore is a metric of overall performance.15 The brier score for flipping a fair coin is 0.25.16 We adopted bootstrapping methods (100 bootstrap resamples) for internal validation because this internal validation technique can quantify the extent of model overfitting and optimism.6
Additionally, the clinical utility of this prediction model was assessed by decision curve analysis (DCA). This analysis aims to establish the net benefit (weighted average of true positives and false positives) of the prediction model across a wide range of threshold probabilities. When the provider has determined their threshold probability for adopting interventions, DCA can show the expected utility (net benefit) of using the prediction model at that specific threshold.
TRIPOD statement was used when reporting this study.6 The TRIPOD checklist can be found in Data Supplement 1. The calculator tool for the probability of risk was developed. Statistical analysis was conducted with R software (version 3.6.2, R Foundation), and P < 0.05 was considered statistically significant.
Ethical Approval
This study was approved by the ethics committee of Zhejiang University School of Medicine Sir Run Run Shaw Hospital (20181220–3). The ethics committee waived the requirement of written informed consent for participation because this was the secondary use of the data. This study was conducted in accordance with the principles of the Declaration of Helsinki. Patient data were protected and confidential. The datasets presented in this article are not readily available due to hospital policy. Requests to access the datasets should be directed to [email protected].
Results
Baseline Characteristics
In total, 6793 participants were included in the derivation cohort based on inclusion and exclusion criteria (Figure 1) and were followed up for 4 years. Of the 6793 participants, 1750 participants were diagnosed with MetS within 4 years, so EPV was above 100. Table 1 provides the baseline characteristics, candidate predictors, and outcome indicators of the study population.
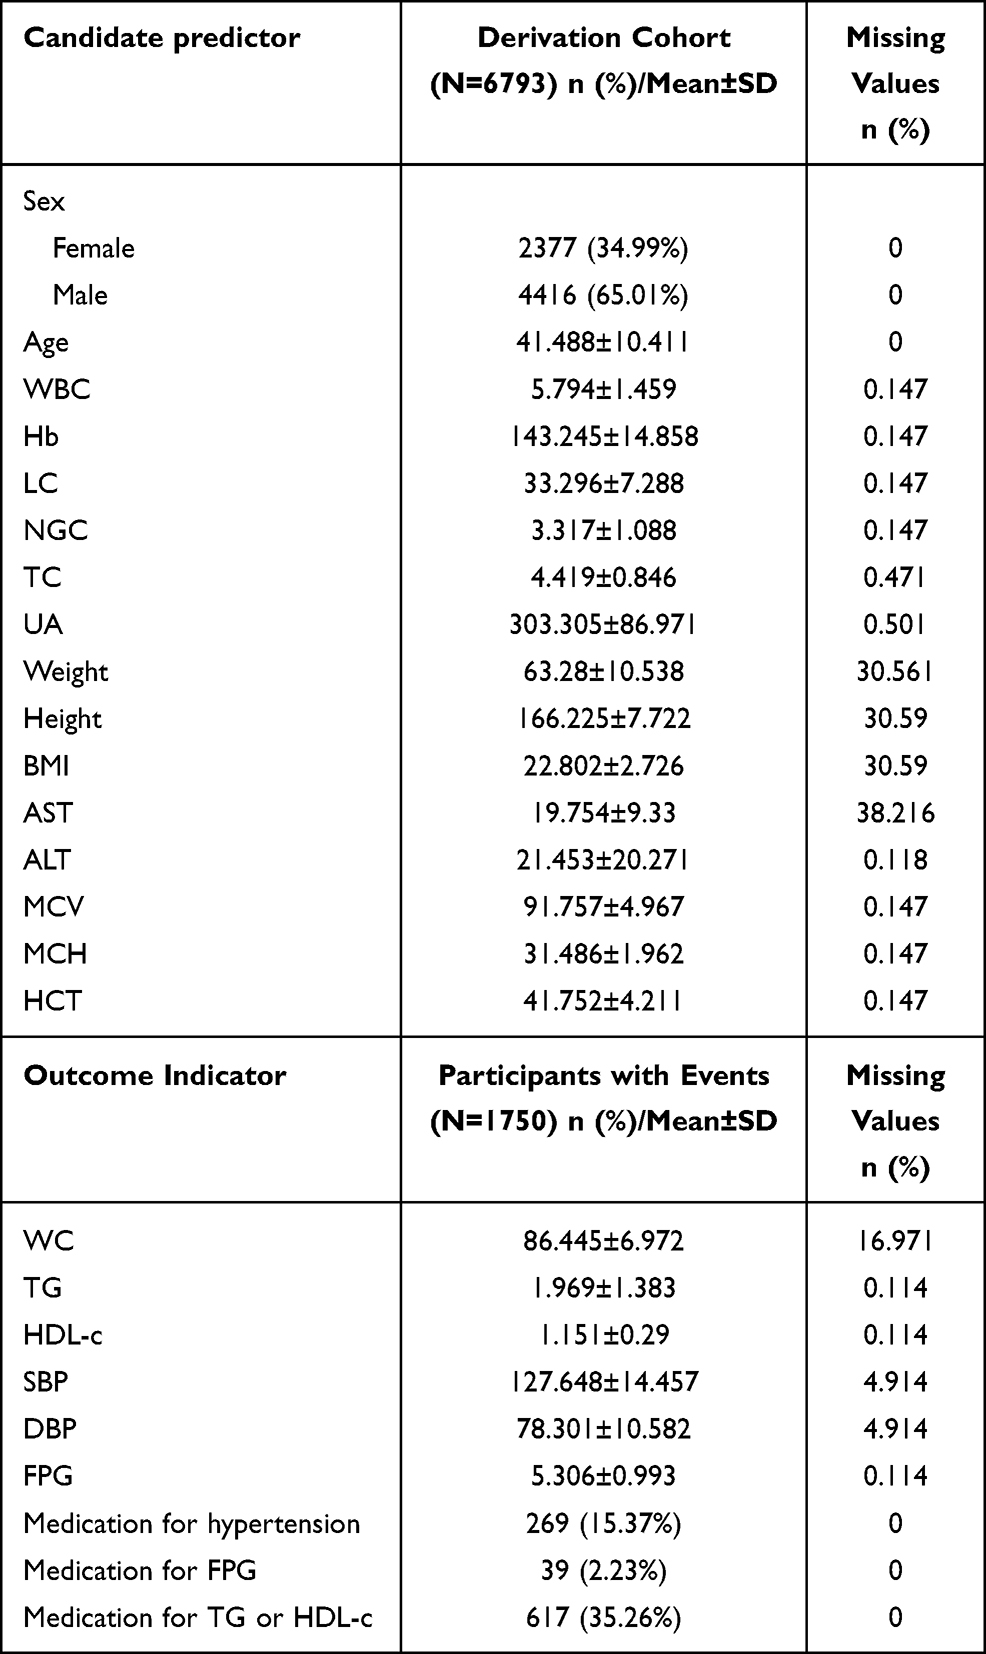 |
Table 1 Characteristics of Participants |
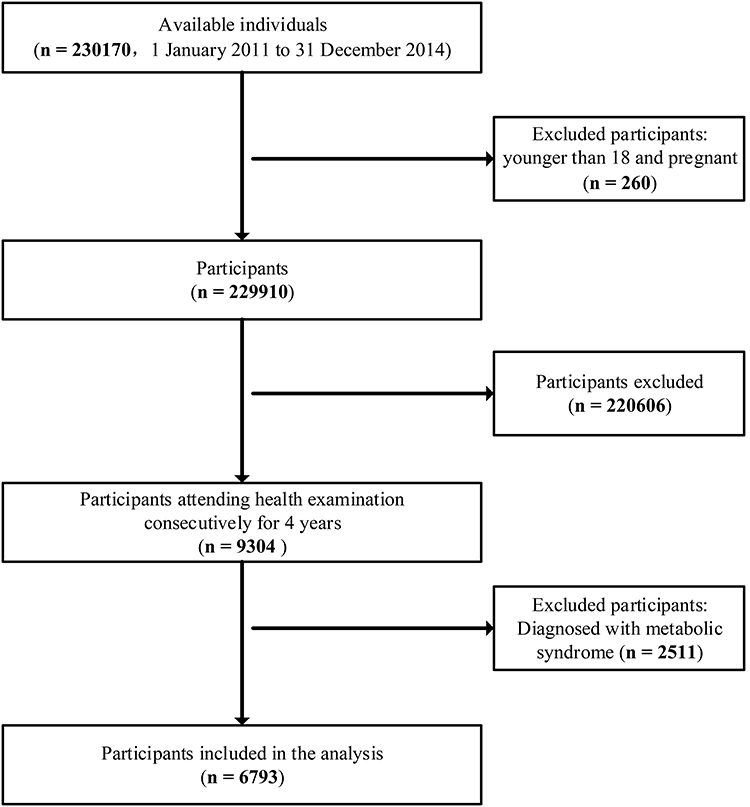 |
Figure 1 Participant flow. |
Predictor Variables
Among 14 candidate predictors, 5 predictors were selected in the LASSO regression model on the basis of the derivation cohort and were with nonzero coefficients in the LASSO regression model (Figure 2A and B). These predictors included age, TC, UA, ALT, and BMI.
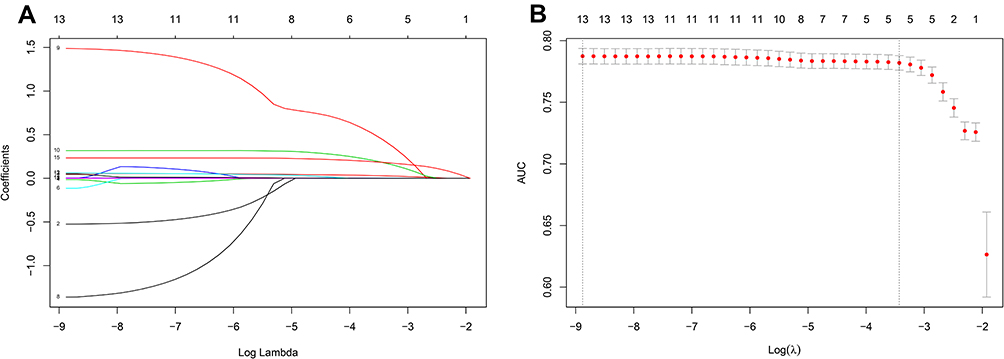 |
Figure 2 Predictors selection using the least absolute shrinkage and selection operator (LASSO) binary logistic regression model. (A) LASSO coefficient profiles of the 14 texture features. A coefficient profile plot was produced against the log (λ) sequence. (B) Hyperparameter (λ) selection in the LASSO model used 10-fold cross-validation via minimum criteria. Dotted vertical lines were drawn at the optimal values by using the minimum criteria and the 1 standard error of the minimum criteria (the 1-SE criteria). |
Prediction Model Development and Apparent Performance
Five predictors selected from the LASSO regression model were entered into multivariable logistic regression analysis to develop a prediction model. C-statistic was 0.784 (95% CI, 0.773–0.796). The agreement between the observed and predicted proportion of MetS showed apparent calibration (Figure 3). Calibration slope was 1, and calibration intercept was 0. The Brier score was 0.156.
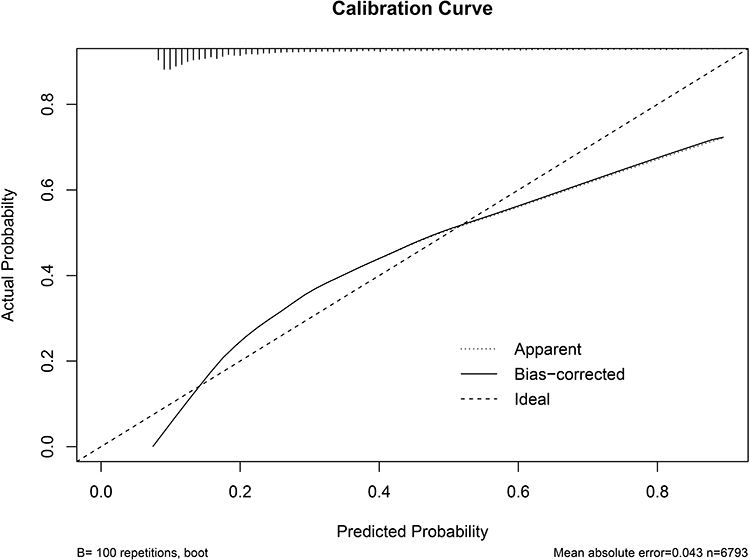 |
Figure 3 Calibration plot. Notes: Apparent refers to apparent performance for calibration; bias-corrected refers to optimism-corrected in internal validation; bootstrap=100. |
Internal Validation
To adjust optimism, bootstrapping approach was used for internal validation. The optimism-corrected C-statistic was 0.783 (95% CI, 0.772–0.795). Figure 3 presents the optimism-corrected calibration plot. After optimism-correction, calibration slope was 0.995 (95% CI,0.934–1.058), and calibration intercept was −0.008 (95% CI, −0.088–0.073). The optimism-corrected brier score was 0.156. Based on the results of calibration plot, calibration slope, calibration intercept, we found that calibration was acceptable. The decision-curve analysis indicated that the prediction model provided greater net benefit than the default strategies of providing treatment or not providing treatment for all patients (Figure 4).
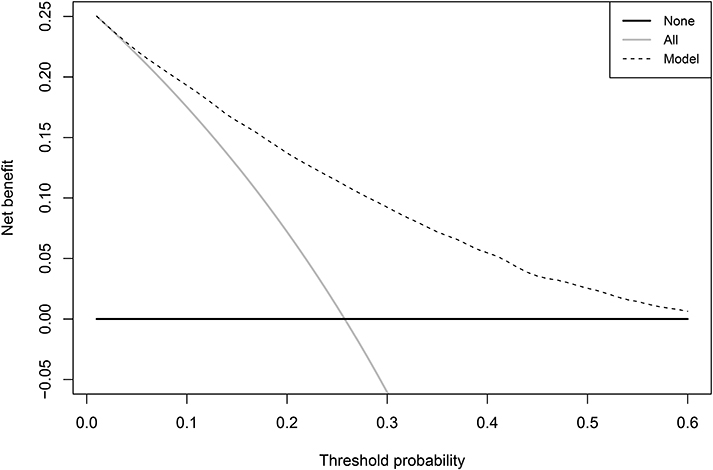 |
Figure 4 Decision-curve analysis. Notes: The horizontal lines (labeled “none”) refer to the expected net benefit without any treatment or intervention which indicates no benefits (net benefit>0) or harms (net benefit<0) from this strategy. The slanted vertical line (labeled “all”) refers to treatment or intervention provided for all patients. False positives are weighted more, and the net benefit becomes negative for providing treatment or intervention for all patients. |
Clinical Examples
Figure 5 shows a clinical example of the application of the risk calculator which can be found in Data Supplement 2. The predicted probability of 4-year risk of metabolic syndrome in adults was determined by
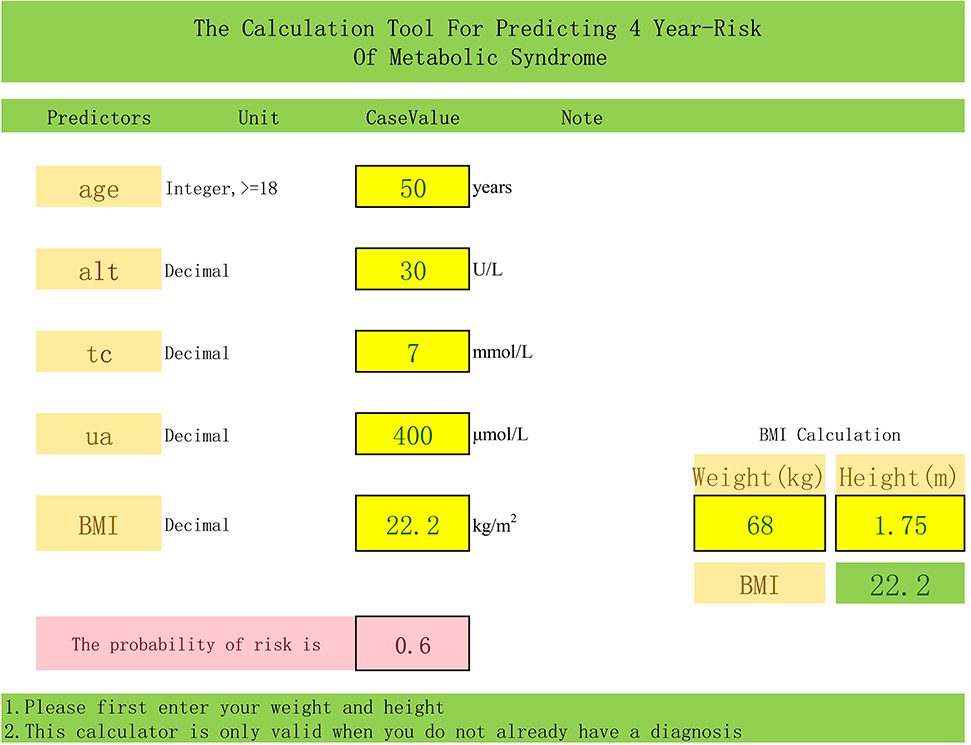 |
Figure 5 A clinical example of the application of the calculator 4-year risk of 60% based on the prognostic prediction model for a man, age 50, total cholesterol of 7 mmol/l, serum uric acid of 400 μmol/l, alanine transaminase of 30 U/L, body mass index (22.2 kg/m2). |
P = 1/[1+ exp – (−12.486 + 0.048 × age + 0.354 ×TC + 0.003× UA + 0.937 × ALT(log) + 0.243×BMI).
Discussion
Screening patients at risk of developing future MetS is important for health providers to make the decision about metabolic syndrome prevention and management. A prognostic prediction model for 4-year risk of metabolic syndrome in adults was developed and internally validated in this study. This risk prediction model only contains 5 predictors (BMI, Age, TC, ALT, UA) which are derived from clinical measurements routinely recorded and readily accessible in clinical care settings.
We find that higher UA, TC, ALT, BMI, and older age predict faster progression to the appearance of MetS. These predictors will allow health professionals to have a better estimate of the future risk of MetS. It is now well established from a variety of studies that these predictors are important for the appearance of MetS. For example, Osadnik et al found that the patients with MetS had older age, higher BMI, ALT, UA, and TC.17 Aging and increased BMI can be significantly associated with increased WC,18 which is one of the diagnostic criteria of MetS. ALT was found to be a risk factor for MetS, and research suggested that a high level of ALT can lead to fat accumulation in the liver. This will cause liver disease (e.g., nonalcoholic fatty liver disease) and individuals with liver disease are more likely to be at risk of developing MetS and other cardiometabolic diseases.19 It is suggested that a high level of UA is related to the prevalence of Mets both in male and female.18 This is because UA can increase insulin resistance causing a high risk of MetS.20 Additionally, a longitudinal study has shown that a high level of TC can increase the risk of MetS, and this is because TC can result in insulin resistance.21 Although age is an unmodifiable risk factor, BMI, ALT, UA, and TC are modifiable risk factors. Medical professionals should help individuals adopt healthy lifestyles to reduce the risk of these predictors.
The current model’s discrimination was useful, and the calibration of this prediction model was acceptable. The clinical usefulness of this model demonstrates that using this model leads to fewer portions of negative net benefit and greater positive net benefit. Additionally, the overall performance of this model was satisfied. This means that the model with only a few major predictors can increase clinical applicability in routine care and the calculator can be used in medical practice.
A few prognostic prediction models have been built for MetS in previous studies identified by our systematic review.22–31 Compared to our prognostic prediction model, many of those models have excellent or good discrimination ranged from 0.80 to 0.90. However, it is important to notify that most previous models have included the components of the diagnostic criteria of MetS as candidate predictors, so the relationships between predictors and outcomes are more likely to be overestimated.11 Consequently, those models have good and excellent discrimination, which means that those prediction models can differentiate individuals with or without diseases, but they may be optimistic when validated in new cohorts. Meanwhile, many of the previous models did not report calibration, which refers to the agreement between the predicted outcomes and the observed outcomes, while models with satisfactory discrimination may have poor calibration leading to limited clinical value.32 Our prediction model with adequate discrimination and excellent calibration will provide more useful information to nurses and physicians.
Strengths and Limitations
Our prediction model has some advantages. Before developing the prognostic prediction model, candidate predictors were selected from a related prediction model systematic review conducted by our team, which is recommended by the TRIPOD statement. Additionally, the components of the diagnostic criteria of MetS were excluded from candidate predictors to avoid overfitting. The key strength should be that the use of statistical analysis methods is appropriate to reduce potential bias. EPV in this study was above 100, so the sample size in our study was appropriate. Continuous predictors are examined for nonlinearity. For missing values, multiple imputations were used to avoid bias. Lasso regression and internal validation (bootstrapping techniques) were adopted to reduce model overfitting and optimism.
The lack of external validation is the major limitation of this study. Based on the TRIPOD guidelines, prediction models should be repeatedly validated to evaluate possible performance among different independent populations before recommending the application of a model in practice. Future studies are encouraged to conduct model external validation in an independent cohort. Moreover, although we identified 25 candidate predictors from the related systematic review, some of them in the current data are not available and the proportion of missing in some predictors is above 50%. These predictors were excluded in the final analysis, leading to residual confounding bias, while it is a potential source of bias in all observational research, especially in routinely collected data.33 Prospective cohort studies are needed in the future.
Conclusions
This is the first study to develop a prognostic prediction model for 4-year risk of MetS in adults by following the TRIPOD statement. This prognostic prediction model aims to quantify absolute risks of MetS in adults, which include 5 risk factors: age, TC, UA, ALT, and BMI. The identification of individuals at high risk of MetS during a certain period of time could help clinicians and nurses to develop management and prevention strategies.
Acknowledgments
The first author wants to thank Mr Liangyuan Li for his vital contribution.
Author Contributions
All authors made substantial contributions to conception and design, acquisition of data, or analysis and interpretation of data; took part in drafting the article or revising it critically for important intellectual content; agreed to submit to the current journal; gave final approval for the version to be published; and agreed to be accountable for all aspects of the work.
Funding
This work was supported by Zhejiang province medical technology project [WKJ-ZJ-1925], National Social Science Fund of China [20BGL275], Postdoctoral Foundation of Zhejiang Province [zj2019022], and National Natural Science Foundation of China [72004193]. The content is solely the responsibility of the authors and does not necessarily represent the official views of the founding.
Disclosure
The authors have no conflicts of interest.
References
1. Alberti G, Zimmet P, Shaw J, et al. The IDF consensus worldwide definition of the metabolic syndrome. Brussels; 2006.
2. Ranasinghe P, Mathangasinghe Y, Jayawardena R, Hills P, Misra A. Prevalence and trends of metabolic syndrome among adults in the Asia-Pacific region: a systematic review. BMC Public Health. 2017;17(1):101. doi:10.1186/s12889-017-4041-1
3. Hu G, Qiao Q, Tuomilehto J, et al. Prevalence of the metabolic syndrome and its relation to all-cause and cardiovascular mortality in nondiabetic European men and women. Arch Intern Med. 2004;164(10):1066–1076. doi:10.1001/archinte.164.10.1066
4. Sniderman AD, Couture P, Martin SS, DeGraaf J. Hypertriglyceridemia and cardiovascular risk: a cautionary note about metabolic confounding. J Lipid Res. 2018;59(7):1266–1275. doi:10.1194/jlr.R082271
5. Tsai SS, Lin YS, Chen ST, Chu PH. Metabolic syndrome positively correlates with the risks of atherosclerosis and diabetes in a Chinese population. Eur J Intern Med. 2018;54:40–45. doi:10.1016/j.ejim.2018.04.009
6. Moons KG, Altman DG, Reitsma JB, et al. Transparent reporting of a multivariable prediction model for individual prognosis or diagnosis (TRIPOD): explanation and elaboration. Ann Intern Med. 2015;162(1):W1–73. doi:10.7326/M14-0698
7. Zhang H, Shao J, Chen D, et al. Reporting and methods in developing prognostic prediction models for metabolic syndrome: a systematic review and critical appraisal. Diabetes Metab Syndr Obes. 2020;13:4981–4992. doi:10.2147/DMSO.S283949
8. Alberti KG, Eckel RH, Grundy SM, et al. Harmonizing the metabolic syndrome: a joint interim statement of the International Diabetes federation task force on epidemiology and prevention; National Heart, Lung, and Blood Institute; American Heart Association; World Heart Federation; International Atherosclerosis Society; and International Association for the Study of Obesity. Circulation. 2009;120(16):1640–1645. doi:10.1161/CIRCULATIONAHA.109.192644
9. Steyerberg EW. Clinical Prediction Models: A Practical Approach to Development, Validation, and Updating. New York: Springer; 2019.
10. Vatcheva KP, Lee M, McCormick JB, Rahbar MH. Multicollinearity in regression analyses conducted in epidemiologic Studies. Epidemiology (Sunnyvale). 2016;6(2). doi:10.4172/2161-1165.1000227
11. Moons KGM, Wolff RF, Riley RD, et al. PROBAST: a tool to assess risk of bias and applicability of prediction model Studies: explanation and elaboration. Ann Intern Med. 2019;170(1):W1–W33. doi:10.7326/M18-1377
12. Hippisley-Cox J, Coupland C, Brindle P. Development and validation of QRISK3 risk prediction algorithms to estimate future risk of cardiovascular disease: prospective cohort study. BMJ. 2017;357:j2099. doi:10.1136/bmj.j2099
13. Frizzell JD, Liang L, Schulte PJ, et al. Prediction of 30-day all-cause readmissions in patients hospitalized for heart failure: comparison of machine learning and other statistical approaches. JAMA Cardiol. 2017;2(2):204–209. doi:10.1001/jamacardio.2016.3956
14. Van Calster B, Nieboer D, Vergouwe Y, De Cock B, Pencina MJ, Steyerberg EW. A calibration hierarchy for risk models was defined: from utopia to empirical data. J Clin Epidemiol. 2016;74:167–176. doi:10.1016/j.jclinepi.2015.12.005
15. Steyerberg EW, Vickers AJ, Cook NR, et al. Assessing the performance of prediction models: a framework for traditional and novel measures. Epidemiology. 2010;21(1):128–138. doi:10.1097/EDE.0b013e3181c30fb2
16. Gravesteijn BY, Nieboer D, Ercole A, Lingsma HF. Machine learning algorithms performed no better than regression models for prognostication in traumatic brain injury. J Clin Epidemiol. 2020;122(122):95–107. doi:10.1016/j.jclinepi.2020.03.005
17. Osadnik K, Osadnik T, Delijewski M, Lejawa M. Calcium and phosphate levels are among other factors associated with metabolic syndrome in patients with normal weight. Diabetes Metab Syndr Obes. 13;2020:1281.
18. Tani S, Matsuo R, Imatake K, Suzuki Y. The serum uric acid level in females may be a better indicator of metabolic syndrome and its components than in males in a Japanese population. J CardioL. 2020;76(1):100–108. doi:10.1016/j.jjcc.2020.01.011
19. Kunutsor SK, Seddoh D. Alanine aminotransferase and risk of the metabolic syndrome: a linear dose-response relationship. PLoS One. 2014;9(4):e96068. doi:10.1371/journal.pone.0096068
20. Wang J, Li C, Li J, et al. Development and internal validation of risk prediction model of metabolic syndrome in oil workers. BMC Public Health. 2020;20(1):1828. doi:10.1186/s12889-020-09921-w
21. Li M, Chen F, Song G, Sun H. Association between total cholesterol, triglycerides and its dynamic changes with metabolic syndrome of physical examination data in Dalian. Chin J Health Stat. 2019;26(2):200–208.
22. Gao YS, Bd L. Bayesian model averaging method for predicting 5 years of metabolic syndrome risk in men and women. Shandong Med J. 2016;56(39):91–94.
23. Hsiao FC, Wu CZ, Hsieh CH, He CT, Hung YJ, Pei D. Chinese metabolic syndrome risk score. South Med J. 2009;102(2):159–164. doi:10.1097/SMJ.0b013e3181836b19
24. Pujos-Guillot E, Brandolini M, Petera M, et al. Systems metabolomics for prediction of metabolic syndrome. J Proteome Res. 2017;16(6):2262–2272. doi:10.1021/acs.jproteome.7b00116
25. Yang X, Tao Q, Sun F, Cao C, Zhan S. Setting up a risk prediction model on metabolic syndrome among 35–74 year-olds based on the Taiwan MJ health-checkup database. Zhonghua Liu Xing Bing Xue Za Zhi. 2013;34(9):874–878.
26. Karimi-Alavijeh F, Jalili S, Sadeghi M. Predicting metabolic syndrome using decision tree and support vector machine methods. ARYA Atheroscler. 2016;12(3):146–152.
27. Wy S, Yc Y, Ml Q, Ym C. Risk prediction model of metabolic syndrome in health management Population. J Shandon Univ. 2017;6(55):87–92.
28. Zhang W, Chen Q, Yuan Z, et al. A routine biomarker-based risk prediction model for metabolic syndrome in urban Han Chinese population. BMC Public Health. 2015;15(1):64. doi:10.1186/s12889-015-1424-z
29. Hirose H, Takayama T, Hozawa S, Hibi T, Saito I. Prediction of metabolic syndrome using artificial neural network system based on clinical data including insulin resistance index and serum adiponectin. Comput Biol Med. 2011;41(11):1051–1056. doi:10.1016/j.compbiomed.2011.09.005
30. Obokata M, Negishi K, Ohyama Y, Okada H, Imai K, Kurabayashi M. A risk score with additional four independent factors to predict the incidence and recovery from metabolic syndrome: development and validation in large Japanese cohorts. PLoS One. 2015;10(7):e0133884. doi:10.1371/journal.pone.0133884
31. Zou TT, Zhou YJ, Zhou XD, et al. MetS risk score: a clear scoring model to predict a 3-year risk for metabolic syndrome. Horm Metab Res. 2018;50(9):683–689. doi:10.1055/a-0677-2720
32. A C Alba, Agoritsas T, M Walsh. Discrimination and calibration of clinical prediction models users’GuidestotheMedicalLiterature. JAMA Cardiol. 2017;318(14):1377–1384.
33. Benchimol EI, Smeeth L, Guttmann A, H K. The reporting of studies conducted using observational routinely-collected health data (RECORD) statement. PLoS Med. 2015;12(10):e1001885. doi:10.1371/journal.pmed.1001885
 © 2021 The Author(s). This work is published and licensed by Dove Medical Press Limited. The
full terms of this license are available at https://www.dovepress.com/terms
and incorporate the Creative Commons Attribution
- Non Commercial (unported, 3.0) License.
By accessing the work you hereby accept the Terms. Non-commercial uses of the work are permitted
without any further permission from Dove Medical Press Limited, provided the work is properly
attributed. For permission for commercial use of this work, please see paragraphs 4.2 and 5 of our Terms.
© 2021 The Author(s). This work is published and licensed by Dove Medical Press Limited. The
full terms of this license are available at https://www.dovepress.com/terms
and incorporate the Creative Commons Attribution
- Non Commercial (unported, 3.0) License.
By accessing the work you hereby accept the Terms. Non-commercial uses of the work are permitted
without any further permission from Dove Medical Press Limited, provided the work is properly
attributed. For permission for commercial use of this work, please see paragraphs 4.2 and 5 of our Terms.