Back to Journals » Drug, Healthcare and Patient Safety » Volume 13
Development and Implementation of an e-Trigger Tool for Adverse Drug Events in a Swiss University Hospital
Authors El Saghir A ![]() , Dimitriou G, Scholer M, Istampoulouoglou I
, Dimitriou G, Scholer M, Istampoulouoglou I ![]() , Heinrich P, Baumgartl K, Schwendimann R
, Heinrich P, Baumgartl K, Schwendimann R ![]() , Bassetti S
, Bassetti S ![]() , Leuppi-Taegtmeyer A
, Leuppi-Taegtmeyer A ![]()
Received 19 August 2021
Accepted for publication 3 November 2021
Published 24 December 2021 Volume 2021:13 Pages 251—263
DOI https://doi.org/10.2147/DHPS.S334987
Checked for plagiarism Yes
Review by Single anonymous peer review
Peer reviewer comments 3
Editor who approved publication: Dr Hemalkumar B Mehta
Amina El Saghir,1,* Georgios Dimitriou,2,* Miriam Scholer,3 Ioanna Istampoulouoglou,1 Patrick Heinrich,3 Klaus Baumgartl,3 René Schwendimann,4 Stefano Bassetti,2 Anne Leuppi-Taegtmeyer1
1Department of Clinical Pharmacology & Toxicology, University Hospital and University of Basel, Basel, Switzerland; 2Division of Internal Medicine, University Hospital and University of Basel, Basel, Switzerland; 3Department of Information Technology, University Hospital Basel, Basel, Switzerland; 4Patient Safety Office, University Hospital Basel, Basel, Switzerland
*These authors contributed equally to this work
Correspondence: Anne Leuppi-Taegtmeyer
Department of Clinical Pharmacology & Toxicology, University Hospital Basel, Schanzenstrasse 55, Basel, CH4031, Switzerland
Tel +41 61 328 68 48
Fax +41 61 265 45 60
Email [email protected]
Purpose: The purpose of the study was to develop and implement an institution-specific trigger tool based on the Institute for Healthcare Improvement medication module trigger tool (IHI MMTT) in order to detect and monitor ADEs.
Methods: We performed an investigator-driven, single-center study using retrospective and prospective patient data to develop (“development phase”) and implement (“implementation phase”) an efficient, institution-specific trigger tool based on the IHI MMTT. Complete medical data from 1008 patients hospitalized in 2018 were used in the development phase. ADEs were identified by chart review. The performance of two versions of the tool was assessed by comparing their sensitivities and specificities. Tool A employed only digitally extracted triggers (“e-trigger-tool”) while Tool B employed an additional manually extracted trigger. The superior tool – taking efficiency into account – was applied prospectively to 19– 22 randomly chosen charts per month for 26 months during the implementation phase.
Results: In the development phase, 189 (19%) patients had ≥ 1 ADE (total 277 ADEs). The time needed to identify these ADEs was 15 minutes/chart. A total of 203 patients had ≥ 1 trigger (total 273 triggers – Tool B). The sensitivities and specificities of Tools A and B were 0.41 and 0.86, and 0.43 and 0.86, respectively. Tool A was more time-efficient than Tool B (4 vs 9 minutes/chart) and was therefore used in the implementation phase. During the 26-month implementation phase, 22 patients experienced trigger-identified ADEs and 529 did not. The median number of ADEs per 1000 patient days was 6 (range 0– 13). Patients with at least one ADE had a mean hospital stay of 22.3 ± 19.7 days, compared to 8.0 ± 7.6 days for those without an ADE (p = 2.7× 10− 14).
Conclusion: We developed and implemented an e-trigger tool that was specific and moderately sensitive, gave consistent results and required minimal resources.
Keywords: electronic health record, medication module, drug safety, patient safety, digital health
Introduction
In order to prevent medication-related patient harm, it is important to systematically identify adverse drug events (ADEs) so that targeted safety interventions can be implemented. ADE is a broad term defined as harm resulting from medical interventions that are potentially related to a drug. Adverse drug reaction (ADR) on the other hand, is a more specific term. ADRs are noxious and unintended responses to normally dosed drugs. They are the subset of ADEs that are causally related to a drug.1 Traditional methods for identifying ADEs such as chart reviews are resource- and time-consuming and are not easily practicable in everyday clinical practice.2 Determining the types and incidence of ADEs in hospitals is therefore challenging, and until recently – due to the paper-based data recording in hospitals – nearly impossible. Common methods of ADE-detection including chart reviews and voluntary reporting (eg, in pharmacovigilance surveillance or critical incidence reporting systems), are greatly affected by under-reporting.3 Only 6% of the adverse drug reactions are reported through spontaneous reporting systems.3 In response to these challenges, the Institute for Healthcare Improvement (IHI) – a patient safety organization – developed a global trigger tool (GTT) to identify and monitor adverse events in healthcare institutions in an efficient and consistent manner.4 Since its development in 2003, the IHI GTT was revised in 2009 and has been applied globally in various studies.5–8 A systematic review has also shown that the GTT was able to detect a higher rate of harm in patients than other methods.9 One of the six modules contained in the IHI GTT is the medication module that is designed to detect ADEs. It consists of 13 triggers with each trigger corresponding to a potential ADE (Table 1).4 These triggers have been found to be 10 times more effective at detecting trigger-associated ADEs in healthcare institutions than voluntary reporting.10
 |
Table 1 The IHI trigger tool medication module and the corresponding detectable ADEs |
The IHI medication module trigger tool (IHI MMTT) provides information about common trigger-associated ADEs per 1000 patient days, trigger-associated ADEs per 100 admissions and percentages of admissions with a trigger-associated ADEs.4 It is not designed to detect each individual ADE occurring in an institution, as it uses triggers for a limited number of specific ADEs in a sampling approach. However, by monitoring the occurrence of ADEs detected by such a tool in real-time, institutions are able to identify safety issues rapidly and can therefore alter their medication process to prevent ADEs accordingly. In addition, by continuous surveillance, the effects of implemented changes to the medication process can be assessed.
The medication module leaves margin for adjustment, depending on the needs of individual institutions or countries. The United Kingdom (UK) and Germany, for example, have published and used modified medication module trigger tools (Table 1).11,12
The IHI trigger tool was developed for manual application to either electronic or paper-based patient records, whereby each single record must be read and assessed for the presence of triggers by experts in the field of drug safety, for example, senior physicians, pharmacists and nurses. This method is time-consuming and resource intensive. Electronic health records (EHRs) contain data recorded in routine clinical practice and an automated process for identifying predefined triggers within them is more efficient and enhances experts’ abilities to detect ADEs.2,13 We therefore set out to develop an institution-specific trigger tool based on the IHI MMTT using data contained in our hospital’s EHRs.
Materials and Methods
Study Aims, Design and Setting
The aims of the study were to
- Modify the medication module of the IHI global trigger tool to produce a final tool for use at our institution (“tool development phase”).
- Test the tool’s ability to monitor ADEs prospectively (“implementation phase”).
This study was an investigator-driven, single-center study using retrospective patient data to develop and in a second step to prospectively test a modified IHI medication module trigger tool. The study obtained approval from the ethics committee “Nordwest- und Zentralschweiz” (EKNZ, project-ID: 2019–00127), which also consented for publication. The study was conducted in accordance with the Declaration of Helsinki.
The study was conducted at the University Hospital Basel (USB) – a 770-bed facility serving both the local population as well as being a tertiary referral center for north-west Switzerland. Approximately 38,000 inpatients are treated per year. The study included patients admitted to USB between January and December 2018 for the tool development phase and from February 2019 to March 2021 for the implementation phase who had given written, informed consent for their anonymized data to be analyzed, whose hospital stay was >24 hours, who were aged 18 years or older and for whom complete medical records were available. Patients treated solely in the intensive care unit and emergency department were excluded because these areas utilize a different prescription chart software (Figure 1).
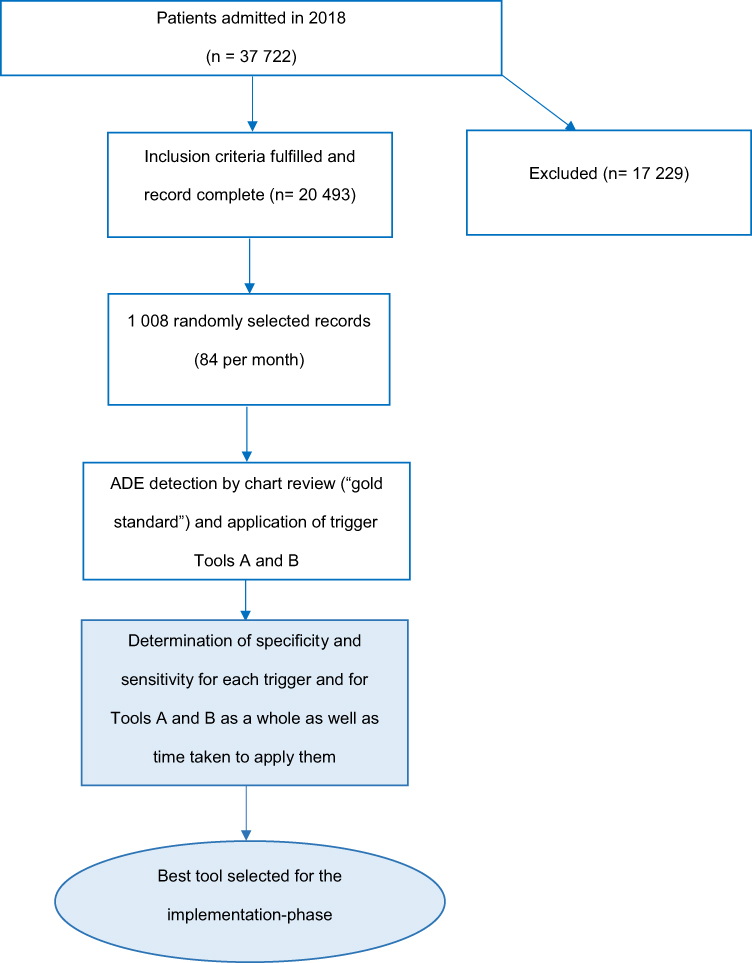 |
Figure 1 Study flow chart depicting the tool development phase. |
In this study, ADE was defined according to the World Health Organization (WHO) as any incident that results from the process of the use of medication resulting in harm or injury to the patient, including medication errors and adverse drug reactions.14
The National Coordinating Council for Medication Error Reporting and Prevention (NCC MERP) index was used to assess categories of harm, as per IHI recommendations. ADEs were categorized as follows: temporary harm to the patient requiring intervention (category E), temporary harm to the patient and requiring initial or prolonged, hospitalization (category F), permanent patient harm (category G), intervention required to sustain life (category H), patient death (category I).15
Tool Development Phase
The original IHI trigger tool could not be applied directly, because it requires laboratory tests and medications, which are not used in our hospital. Therefore, it was necessary to modify the IHI medication trigger tool accordingly, while also taking the digital accessibility of the clinical data at the USB into consideration. In a first step, two triggers (M10 antiemetic administration and M12 abrupt medication stop) were removed due to anticipated high false-positive rates and M13 (“other”) was assigned to rivaroxaban drug-level or anti-factor Xa activity to reflect current oral anticoagulation practices. In a second step, Tools A and B were defined. Tool A consists of a set of 10 triggers and uses digitally extractable data only, while Tool B contained the same 10-triggers plus an additional manually extracted trigger (M1 - C. difficile-positive stool). C. difficile antigen results are not available in a digitally searchable format in the electronic patient records at our institution. To access these results, the reviewer must find and open the appropriate scanned document in the patient record – the trigger must therefore be manually extracted. In order to determine the specificity and sensitivity of the tools, we evaluated the performance of Tools A and B compared to the gold standard method of chart review, which identified all ADEs experienced by the patients (Table 2).
 |
Table 2 The IHI trigger tool medication module triggers and modifications for tools A and B |
Data Collection
For both study phases, cases fulfilling the inclusion criteria and admitted during 2018 were randomly selected from the hospital’s administration software (Figure 1). For the development phase, 84 of these randomly selected cases per month were then analyzed retrospectively. For the implementation phase, 20 cases were randomly selected at the end of each month for a 26-month period (February 2019–March 2021) as recommended by IHI for prospective screening.4 In order to account for late drop-outs (cases that were retrospectively found to have missing data), 22 patients per month were included from July 2019 onwards.
Patient demographic data (age, sex, length of hospital stay and department) was extracted from the medical records using SQL. During the tool development phase, data were extracted from the patients` electronic prescription and monitoring charts using SQL (Tools A and B) and manually from their electronic medical records (for trigger M1 of Tool B and complete chart review) (Table 2). The main electronic prescription and monitoring chart used at our institution is provided by Meona (MEONA GmbH, Freiburg in Breisgau, Germany) and the electronic medical record by ISMed (ProtecData AG, Boswil, Switzerland). Other software solutions used at our institution are given in the Supplement Table S2.
The complete examination of the medical records was performed by a pharmacy graduate and a medical doctor in speciality training clinical pharmacology and toxicology, followed by authentication and causality assessment of the detected ADEs by a board-certified clinical pharmacologist and toxicologist. The data sources used for causality analysis of ADEs are given in the Supplement Table S2. Cases identified by the trigger tool were evaluated for causality according to the WHO causality assessment criteria by qualified staff (Supplement Table S3).16 The triggers were judged as having correctly identified an ADE when the causality criteria “certain”, “probable” and “possible” were met. These cases were judged to be true-positive cases. Cases where causality was found to be “unlikely” or where no medication was involved were counted as false-positive cases. Documentation of the type and category of harm according to NCC MERP15 was performed by the graduate pharmacist and medical doctor in speciality training and was verified by the board-certified clinical pharmacologist and toxicologist based on the information in the patient records. The ADEs and causative medication found were categorized into groups according to their Anatomical Therapeutic Chemical Classification System (ATC-Codes).
During the implementation phase, the patients’ electronic prescriptions and monitoring charts were screened for triggers with the final tool using the SQL, which was written in the development phase. EHRs containing triggers were assessed according to the IHI Global Trigger Tool White Paper for the presence of ADEs by the same two independent reviewers mentioned above (Figure 2).4
 |
Figure 2 Study flow chart depicting the tool implementation phase. |
Statistical Analyses
Sample Size Calculation
The number of patients needed for the development phase was calculated based on the estimated ADE prevalence of 10% (according to internal data, USB 2015–2017 and published literature),9,17,18 and a predicted test sensitivity of 10% and specificity of 99%.19,20 The number of patients needed for the development phase was calculated to be 1000 (Diagnostic Test Calculator© version 2010042101).21 In order to ensure that case records spanning the entire year were sampled (and thereby to minimize a potential effect of sampling bias), we randomly selected 84 cases per calendar month. Continuous data were reported as median and interquartile range (IQR).
Triggers found with Tools A and B were assessed as true-positive, true-negative, false-positive and false-negative for ADEs. Positive predictive value (PPV), negative predictive value (NPV), sensitivity and specificity were determined for each trigger. In addition, the sensitivity and specificity of Tools A and B with their respective 95% confidence intervals (CI) were calculated (Figure 1). We also calculated the variance in sensitivity and specificity for the final tool over the 12-month sampling period in order to determine the tool’s consistency.
During the implementation phase total length of patient stay, number of triggers and number of ADEs were recorded (Figure 2). This enabled us to extrapolate the number of ADEs identified by the trigger tool per 1000 patient days and per 100 admissions, as well as the percentage of admissions with ADEs identified by the trigger tool. We used the Student’s t-test to determine the statistical significance of the difference between mean lengths of hospital stay among patients with and without trigger-identified ADEs. The type and category of actual harm – if any - caused by the ADEs were evaluated with the NCC MERP Index as specified by the IHI Global Trigger Tool White Paper.3
Results
Tool Development Phase
Demographic characteristics of the 1008 included patients are given in Table 3. The total time for chart review was 252 hours (15 min/record). Table 4 shows the distribution of patients according to the number of ADEs and triggers. One hundred eighty-nine patients (19%) experienced one or more ADEs, amounting to a total of 277 ADEs. Tool B identified 4 more patients than Tool A, all of whom triggered positive for the Tool B-specific trigger M1 (stool positive for C. difficile antigen). Overall, 203 (20%) out of 1008 patients showed one or more triggers.
 |
Table 3 Characteristics of included patients |
 |
Table 4 Distribution of patients according to number of ADEs they experienced and the number of triggers which were found by Tool B |
The 277 ADEs identified in 189 patients were classified as shown in Table 5. The most frequent ADEs were gastrointestinal symptoms (18%) followed by electrolyte disorders (14%) and hypersensitivity reactions (13%). The classes of medication most often involved in the occurrence of ADEs were antithrombotic agents (15%), opioids (13%), and antineoplastic agents (12%) (Supplement Table S1).
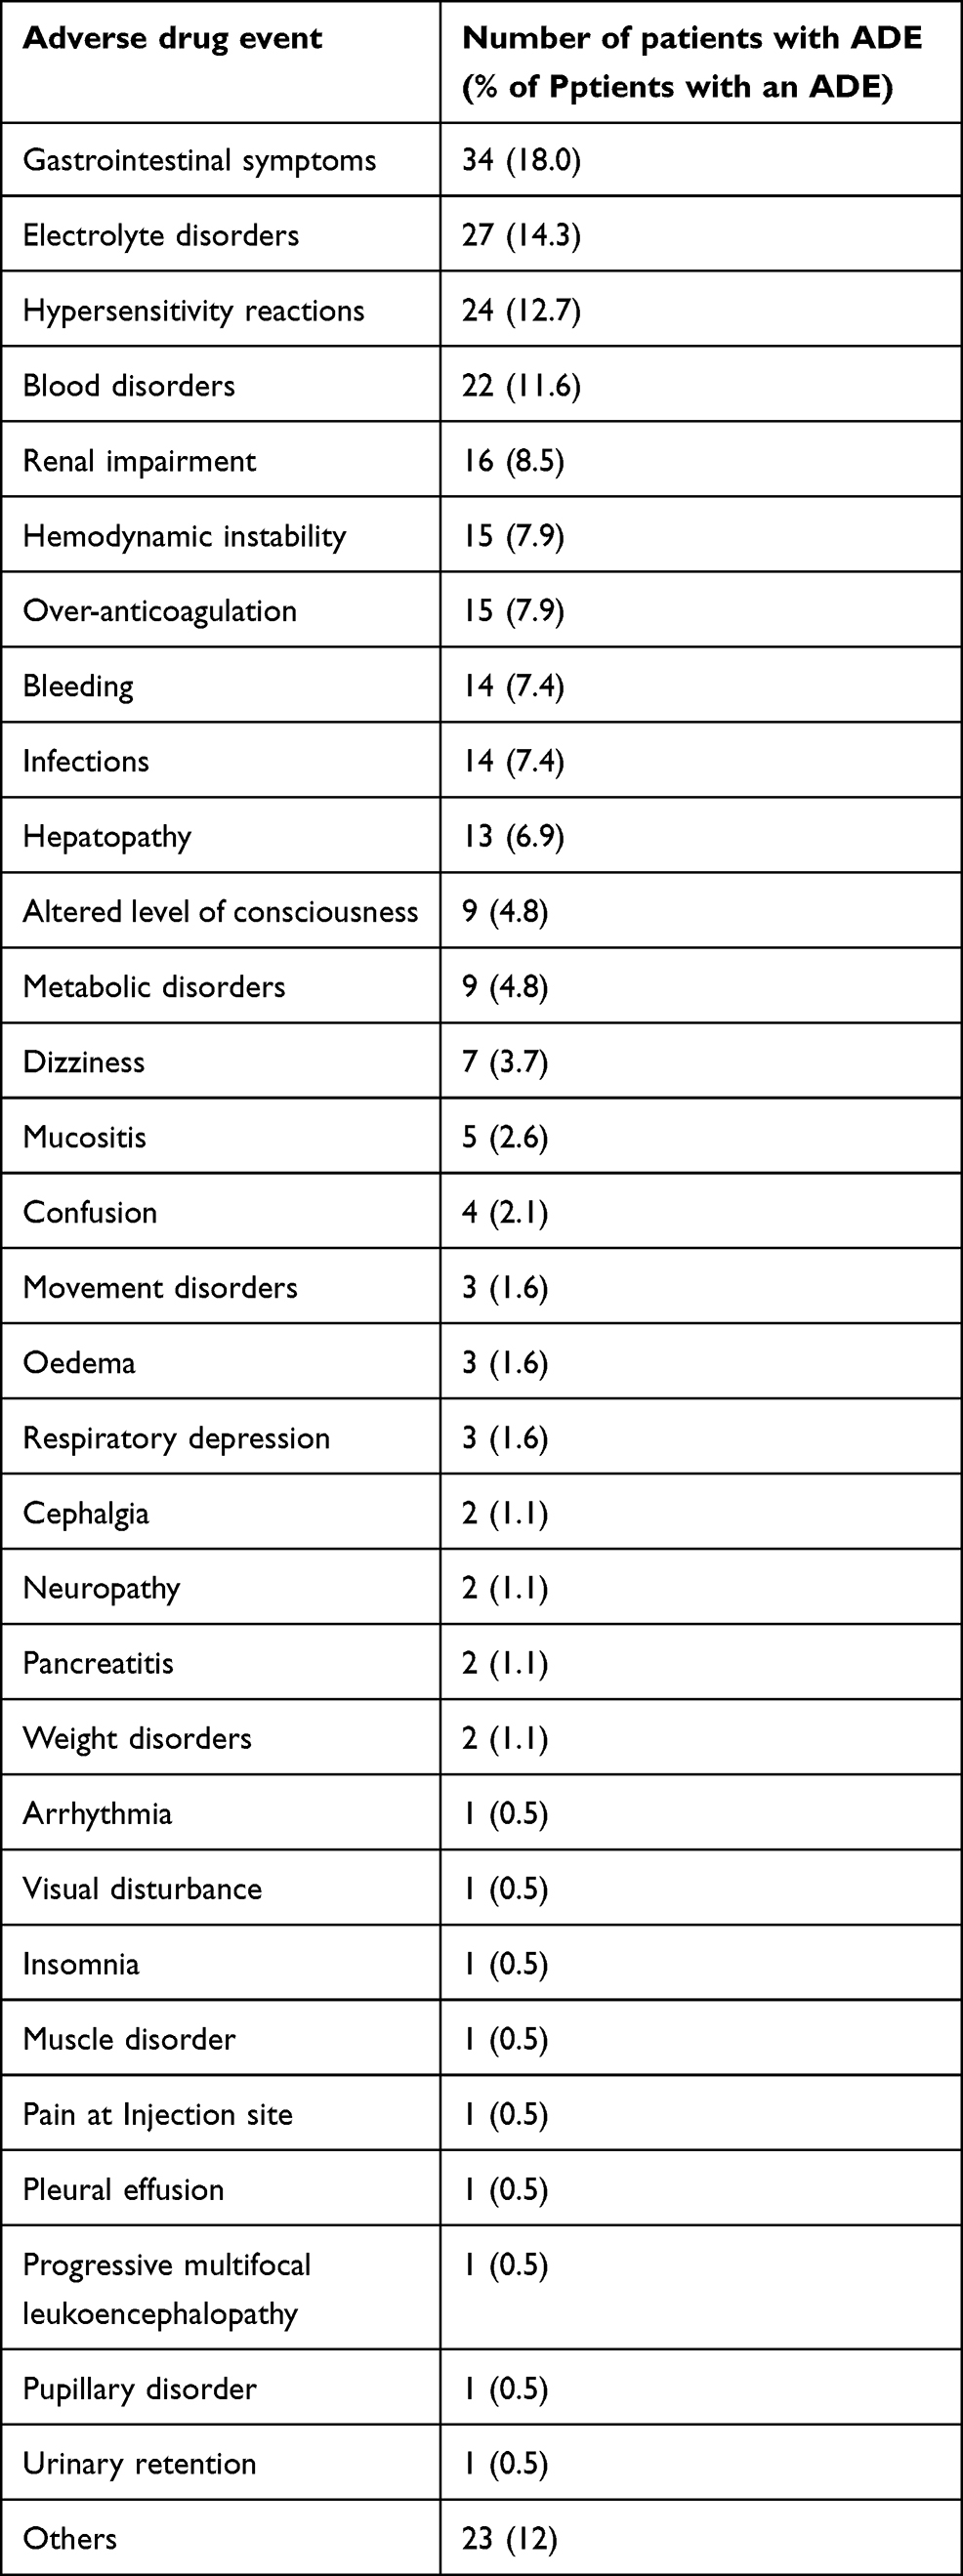 |
Table 5 Distribution of 277 ADEs identified in 189 patients, listed according to frequency |
Performance and Comparison of Tools A and B
The trigger frequencies, positive predictive values (PPVs), negative predictive values (NPVs), sensitivity and specificity of the individual triggers are shown in Table 6. Positive predictive values (PPV) ranged from 0 to 1, with 5 of the 11 triggers having a PPV > 0.5. Sensitivity of the individual triggers ranged from 0 to 1, while specificity of the triggers ranged from 0.92 to 1. Trigger M2 showed the lowest specificity of 0.92 and occurred the most frequently. Trigger M1 (the manually extracted trigger) showed the highest sensitivity and specificity. Two triggers (M4 and M8) never occurred. Therefore, their PPV could not be calculated. Trigger M3 was not sensitive for the intended ADE “Bleeding under VKA”. However, the trigger can detect supratherapeutic INR values occurring during anticoagulation with a VKA (M3.1 in Table 6) with a high sensitivity. Trigger M3 showed moderate sensitivity for bleeding associated with a supratherapeutic INR in the absence of VKA therapy, which can occur in patients with liver disease for example (M3.2 in Table 6). While trigger M9 was able to accurately identify life-threatening opioid ADEs, it was much less sensitive for common ADEs related to opioids (1 vs 0.19).
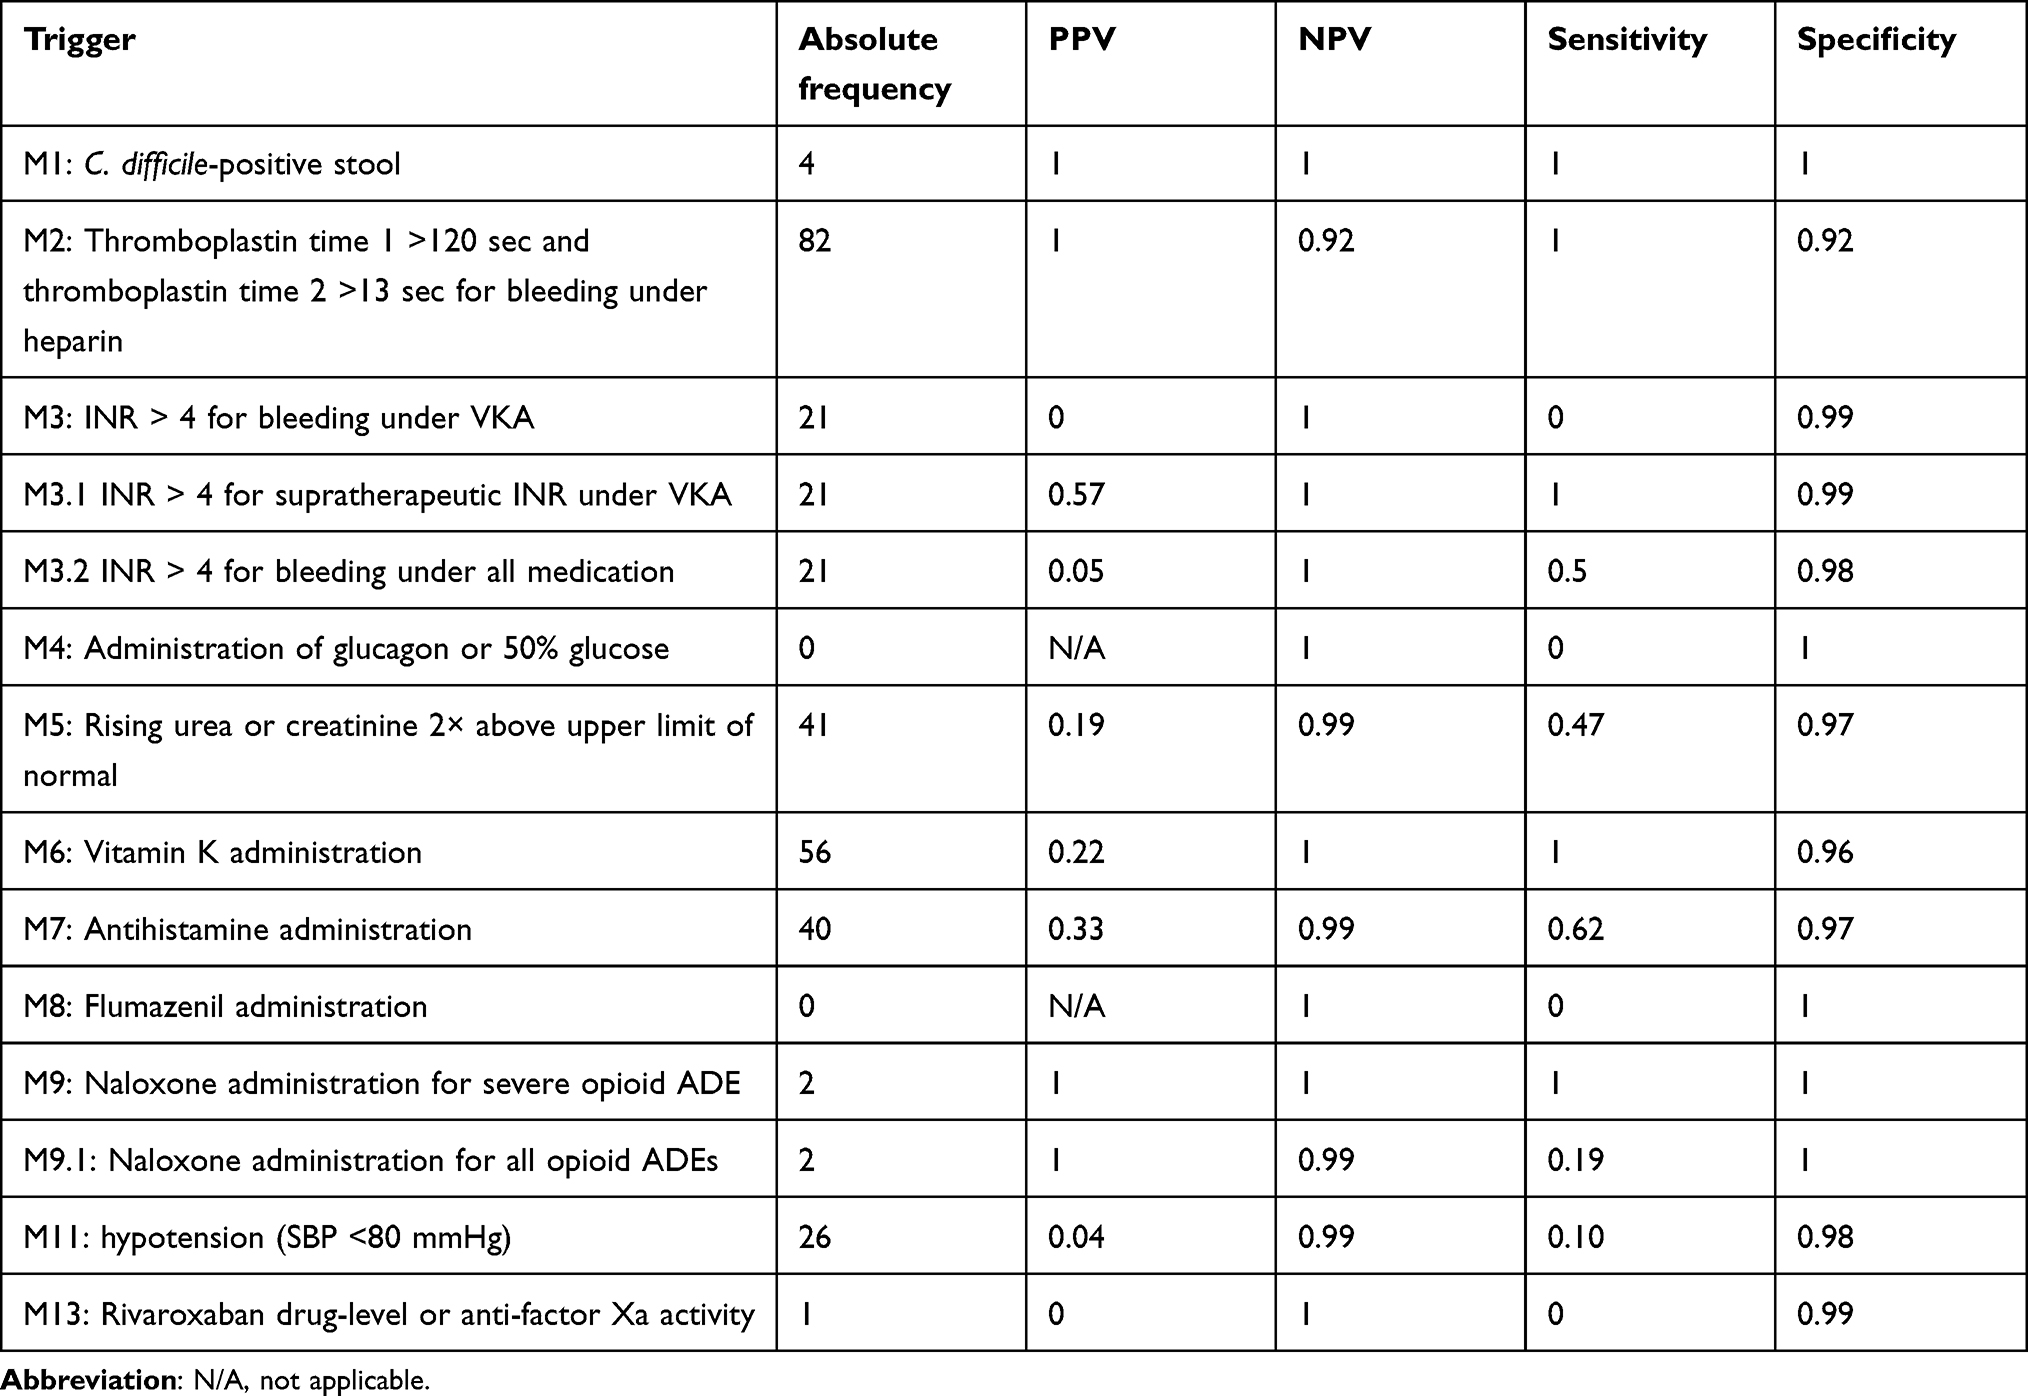 |
Table 6 Frequency, positive predictive value (PPV), negative predictive value (NPV), sensitivity and specificity of the individual triggers |
Tool A identified a total of 77 ADEs while Tool B identified a total of 81 ADEs. Their sensitivities and specificities are shown in Table 7. For the determination of the tools’ overall sensitivities and specificities, M1 – M13 (ie, not including M3.1, M3.2 and M9.1) were used.
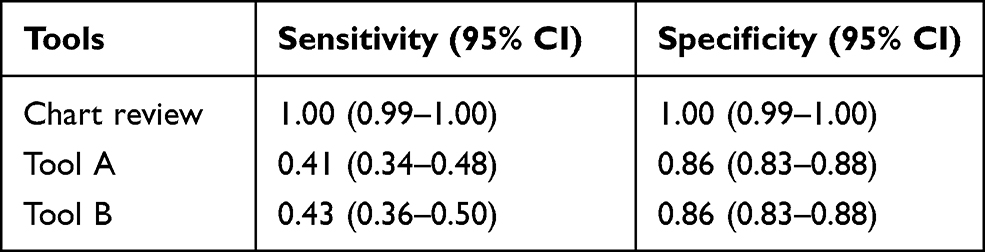 |
Table 7 Sensitivity, specificity and 95% confidence intervals (CI) of Tools A and B |
Due to the additional 5 minutes/case required to manually extract the necessary data for trigger M1 and the only modest increase in sensitivity (0.43 compared to 0.41), the e-trigger tool (Tool A) was identified as the tool of choice for the implementation phase.
The e-trigger tool’s sensitivity and specificity values during each month are shown in Table 8. The variances for sensitivity and specificity were 0.018 and 0.002, respectively.
 |
Table 8 Sensitivity and specificity of the final tool according to month |
Tool Implementation Phase
The results of the 26-month implementation phase (Figure 2) are shown in Table 9. A total of 107 triggers were identified in 551 patient records. The time needed to review a triggered patient record was 4 minutes (on average 20 minutes per month, or 4 hours per year). Twenty three of the 107 triggers identified an ADE, giving a PPV of 0.21. Fifteen of the ADEs identified by the final tool were rated as harm category E, three as category F, one as category G and four as category H. Monthly fluctuations in ADEs were calculated as number of ADEs per 1000 patient days, ADEs per 100 admissions and percentage of admissions with an ADE using the number of patients with an ADE (Table 9, Figures 3 and 4). Patients with at least one ADE (n = 22) had a mean hospital stay of 22.3 ± 19.7 days, compared to 8.0 ± 7.6 days for those without an ADE (n = 529, p = 2.7×10⁻¹⁴).
 |
Table 9 Monthly fluctuations in triggers and ADEs during the prospective 26-Month implementation phase |
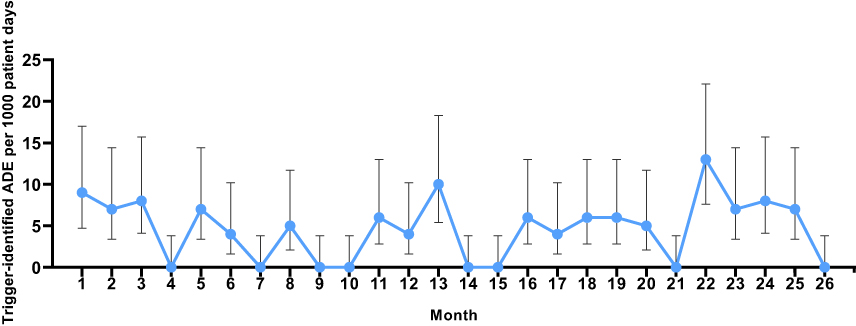 |
Figure 3 Trigger-identified adverse drug events per 1000 patient days during the 26-month prospective study period (“tool implementation phase”). |
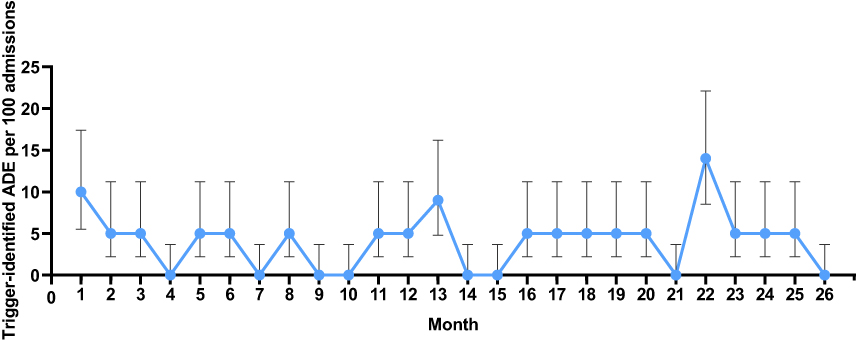 |
Figure 4 Trigger-identified adverse drug events per 100 admissions during the 26-month prospective study period (“tool implementation phase”). |
Discussion
In this study, we developed and implemented an institution-specific trigger tool for surveillance of ADEs in a university hospital setting, by modifying the IHI TT for our hospital’s needs. We were able to successfully implement the final, digital tool (“e-trigger” tool) prospectively. The modified tool contained 10 instead of the original 13 triggers and showed a sensitivity of 0.41 and specificity of 0.86. The monthly variance in these values was low. This final e-trigger tool could be applied in a prospective manner and found a median estimated ADE prevalence per 1000 patient days of 6 (interquartile range 7). The method required on average 20 minutes of a specialist’s time per month compared to 5 hours for the chart review method, which further enhances its attractiveness for implementation in modern healthcare systems.
Our tool had a higher sensitivity 41% (95% CI 34–48%) but a lower specificity 86% (95% CI 83–88%) compared to eight similar trigger tools previously tested in a Canadian emergency department using manually extracted data with tool sensitivities and specificities ranging from 2.6% to 15% and 99.3'% to 100%, respectively.20 However, our tool had a similar specificity to that of an electronically applied modified GTT from Norway, which was 81% (95% CI 77–85%).13 Differences in the findings of sensitivity and specificity result from methodical differences for example in the way triggers were extracted from the patient charts. The calculation of specificity and sensitivity in our study was based on a comparison to the gold standard, which was the chart review. Therefore, it is difficult to compare our results with those of other studies that used different modified modules of the GTT and different gold standards. Overall, the comparison of different institutions using the GTT are of limited value due to these methodological differences.4,22 Other trigger-based tools to detect ADEs in different settings have similarly found that the inability to generalize tool application or findings are limitations that currently restrict their use.23–26
Results from the chart review performed during the tool development phase showed that 19% of the patients at the USB had one or more ADE, which is in the range of that found in other studies of hospitalized patients (6–20%).27–30 The occurrence of the most common ADEs seen (gastrointestinal symptoms 18%, electrolyte disorders 14%, hypersensitivity reactions 13% and blood disorders 12%) aligns with the findings of studies that used the IHI trigger tool.19,31 Also, a study from Switzerland using a different method for ADE detection than ours showed a similar distribution of ADE types occurring in hospitalized patients.32
There is much room for further improvement of methods to enhance drug safety and its surveillance. Better methods for using EHRs to extract information about ADE prevalence and drug safety in general are needed.17,33,34 Therefore, better learning algorithms that can be applied to unstructured data as they exist in EHRs are required.2 An approach to improve the performance of trigger tools could be to combine them with methods using a natural language processing (NLP) technique,35,36 which would also enable examination of data from diverse clinical data management platforms.
To our knowledge, this is the first study in Switzerland to develop and implement an institution-specific, digital version of the IHI medication trigger tool and to compare its performance to the gold standard of a whole chart review. The tool seems to be an efficient method to measure fluctuations in ADE prevalence over time as the monthly variance in sensitivity and specificity was low. The high ADE prevalence in month 22, for example, when 14% of admissions had at least one trigger-related ADE, compared to the mean value of 4.4% for the entire 26-month study period, coincided with the peak of the second COVID-19 wave in Switzerland. This finding suggests that the tool can pick up signals for unusual conditions or situations. Furthermore, we found that patients experiencing at least one ADE had a significantly longer hospitalization compared to those who did not (nearly three times as long). Whether the prolonged hospital stay is due to ADEs cannot be determined from our analysis because the risk of experiencing ADEs rises with increasing duration of hospitalization, increasing number of medication orders and multi-morbidity.37 However, our observation is in keeping with what is already known about ADEs and length of hospital stay. According to literature, the length of hospitalization seems to be two to even three times longer in patients with ADE compared to those who had not experienced ADE.31,38 The advantage of continual ADE monitoring is that the cause of unexpectedly high ADE prevalence can be investigated immediately after detection and interventions to ameliorate them rapidly can be applied. The effect of the interventions can then be monitored with the tool.39 Moreover, it will be possible to analyze more than the recommended 20 patient charts per month without great investment of resources.
Our study has some limitations. First, the tool’s ability to comprehensively detect ADEs is limited because it is only able to identify trigger-associated ADEs which led to only one-third of all ADEs being found by the final tool. For example, no specific trigger is present in the IHI medication trigger tool for two frequent medication groups involved in ADEs, namely antipyretics (8%) and immunosuppressants (6%). The corresponding ADEs can therefore not be detected by the tool. As a consequence, the tool only provides a sampling approach of ADEs occurring in a healthcare setting. Second, the possibility of missing data in the patient EHRs and prescription charts, which may have led to an underestimation of the tool’s sensitivity. Third, variation in the skill of reviewers can lead to performance bias of the tool. Nevertheless, we found that the tool can be used in a single institution repetitively over time due to its consistent performance and electronic implementation and thus enables continual ADE monitoring. This confirms the position taken by the authors of the IHI Global Trigger Tool White Paper.4 While this institution-specific tool itself is not generalizable to other institutions, and external validation is not meaningful, the tool-development method could be applied in any number of diverse settings.
Conclusion
This was the first study to develop and implement a trigger tool based on the IHI MTT to efficiently detect ADEs occurring in patients treated in a Swiss university hospital. The performance of individual triggers varied greatly in terms of their positive predictive value (range 0.04–1), but not in terms of their negative predictive value (range 0.92–1). While the tool showed a moderate sensitivity in detecting ADEs, it had a good specificity enabling it to exclude ADEs more accurately. The e-trigger tool could be used as an instrument to assess the state of drug safety in a hospital because it gives the approximate ADE prevalence over time in a consistent way. However, to improve its performance, inclusion of additional triggers and surveillance of more than the recommended 20 charts per month should be considered.
Author Contributions
Study idea (ALT), data acquisition and analysis (AES, MS, GD, II, PH, KB, ALT), data interpretation (AES, GD, ALT, RS, SB) and writing (AES, GD, II, RS, ALT). All authors made a significant contribution to the work reported, whether that is in the conception, study design, execution, acquisition of data, analysis and interpretation, or in all these areas; took part in drafting, revising or critically reviewing the article; gave final approval of the version to be published; have agreed on the journal to which the article has been submitted; and agree to be accountable for all aspects of the work.
Funding
There was no specific funding for the study.
Disclosure
Amina El Saghir and Georgios Dimitriou are co-first authors for this study. The authors have no competing interests to declare.
References
1. van den Bemt PM, Egberts TC, de Jong-van den Berg LT, Brouwers JR. Drug-related problems in hospitalised patients. Drug Saf. 2000;22(4):321–333. doi:10.2165/00002018-200022040-00005
2. Liu F, Jagannatha A, Yu H. Towards drug safety surveillance and pharmacovigilance: current progress in detecting medication and adverse drug events from electronic health records. Drug Saf. 2019;42(1):95–97. doi:10.1007/s40264-018-0766-8
3. Hazell L, Shakir SA. Under-reporting of adverse drug reactions: a systematic review. Drug Saf. 2006;29(5):385–396. doi:10.2165/00002018-200629050-00003
4. Griffin FA, Resar RK. IHI global trigger tool for measuring adverse events (second edition). IHI Innovation Series white paper. Cambridge, MA: Institute for Healthcare Improvement; 2009. Available from: www.IHI.org.
5. Varallo FR, Dagli-Hernandez C, Pagotto C, de Nadai TR, Herdeiro MT, de Carvalho Mastroianni P. Confounding variables and the performance of triggers in detecting unreported adverse drug reactions. Clin Ther. 2017;39(4):686–696. doi:10.1016/j.clinthera.2016.11.005
6. Carnevali L, Krug B, Amant F, et al. Performance of the adverse drug event trigger tool and the global trigger tool for identifying adverse drug events: experience in a Belgian hospital. Ann Pharmacother. 2013;47(11):1414–1419. doi:10.1177/1060028013500939
7. Sam AT, Lian Jessica LL, Parasuraman S. A retrospective study on the incidences of adverse drug events and analysis of the contributing trigger factors. J Basic Clin Pharmacol. 2015;6(2):64–68. doi:10.4103/0976-0105.152095
8. Musy SN, Ausserhofer D, Schwendimann R, et al. Trigger tool-based automated adverse event detection in electronic health records: systematic review. J Med Internet Res. 2018;20(5):e198. doi:10.2196/jmir.9901
9. Hibbert PD, Molloy CJ, Hooper TD, et al. The application of the global trigger tool: a systematic review. Int J Qual Health Care. 2016;28(6):640–649.
10. Classen DC, Resar R, Griffin F, et al. ‘Global trigger tool’ shows that adverse events in hospitals may be ten times greater than previously measured [published correction appears in Health Aff (Millwood). 2011 Jun;30(6):1217]. Health Aff. 2011;30(4):581–589. doi:10.1377/hlthaff.2011.0190
11. German version IHI global trigger tool. Available from: http://www.ihi.org/resources/Pages/Tools/IHIGlobalTriggerToolforMeasuringAEs.aspx.
12. UK version IHI global trigger tool. Available from: http://www.ihi.org/resources/Pages/Tools/IHIGlobalTriggerToolforMeasuringAEs.aspx.
13. Mevik K, Hansen TE, Deilkås EC, Ringdal AM, Vonen B. Is a modified global trigger tool method using automatic trigger identification valid when measuring adverse events? Int J Qual Health Care. 2019;31(7):535–540. doi:10.1093/intqhc/mzy210
14. World Health Organization. The conceptual framework for the international classification for patient safety. Geneva: WHO; 2009. Available from: https://www.who.int/patientsafety/taxonomy/icps_full_report.pdf.
15. National Coordinating Council for Medication Error Reporting and Prevention. NCC MERP index for categorizing medication errors 2001. Available from: https://www.nccmerp.org/sites/default/files/indexBW2001-06-12.pdf.
16. The use of the WHO-UMC system for standardised case causality assessment. Available from: http://www.WHO-UMC.org/graphics/4409.pdf.
17. Schwendimann R, Blatter C, Dhaini S, Simon M, Ausserhofer D. The occurrence, types, consequences and preventability of in-hospital adverse events - a scoping review. BMC Health Serv Res. 2018;18(1):521. doi:10.1186/s12913-018-3335-z
18. Sousa P, Uva AS, Serranheira F, Nunes C, Leite ES. Estimating the incidence of adverse events in Portuguese hospitals: a contribution to improving quality and patient safety. BMC Health Serv Res. 2014;14(311). doi:10.1186/1472-6963-14-311
19. Silva MDDG, Martins MAP, Viana LG, et al. Evaluation of accuracy of IHI trigger tool in identifying adverse drug events: a prospective observational study. Br J Clin Pharmacol. 2018;84(10):2252–2259. doi:10.1111/bcp.13665
20. Karpov A, Parcero C, Mok CP, et al. Performance of trigger tools in identifying adverse drug events in emergency department patients: a validation study. Br J Clin Pharmacol. 2016;82(4):1048–1057. doi:10.1111/bcp.13032
21. Diagnostic test calculator (version 2010042101). Available from: http://araw.mede.uic.edu/cgi-bin/testcalc.pl?DT=&Dt=&dT=&dt=&2x2=Compute.
22. Schildmeijer K, Nilsson L, Arestedt K, Perk J. Assessment of adverse events in medical care: lack of consistency between experienced teams using the global trigger tool. BMJ Qual Saf. 2012;21(4):307–314. doi:10.1136/bmjqs-2011-000279
23. Mastroianni PC, Vieira MB, Forgerini M, Nadai TR, Varallo FR. Serum potassium level used as trigger doubled the detection of adverse drug events when compared with calcium polystyrene sulfonate trigger: a cross-sectional study. Rev Ciênc Farm Básica. 2021;42:e724. doi:10.4322/2179-443X.0724
24. Rozich JD, Haraden CR, Resar RK. Adverse drug event trigger tool: a practical methodology for measuring medication related harm. Qual Saf Health Care. 2003;12(3):194–200. doi:10.1136/qhc.12.3.194
25. Davis J, Harrington N, Bittner Fagan H, Henry B, Savoy M. The accuracy of trigger tools to detect preventable adverse events in primary care: a systematic review. J Am Board Fam Med. 2018;31(1):113–125. doi:10.3122/jabfm.2018.01.170247
26. Credland N, Dyson J, Johnson MJ. Do early warning track and trigger tools improve patient outcomes? A systematic synthesis without meta-analysis. J Adv Nurs. 2021;77(2):622–634. doi:10.1111/jan.14619
27. Fishman L, Brühwiler L, Schwappach D. Medikationssicherheit: wo steht die Schweiz? [Medication safety in Switzerland: where are we today?]. Bundesgesundheitsblatt Gesundheitsforschung Gesundheitsschutz. 2018;61(9):1152–1158. doi:10.1007/s00103-018-2794-z
28. Bates DW, Cullen DJ, Laird N, et al. Incidence of adverse drug events and potential adverse drug events. Implications for prevention. ADE Prevention Study Group. JAMA. 1995;274(1):29–34. doi:10.1001/jama.1995.03530010043033
29. Hug BL, Witkowski DJ, Sox CM, et al. Adverse drug event rates in six community hospitals and the potential impact of computerized physician order entry for prevention. J Gen Intern Med. 2010;25(1):31–38. doi:10.1007/s11606-009-1141-3
30. Pirmohamed M, Breckenridge AM, Kitteringham NR, Park BK. Adverse drug reactions. BMJ. 1998;316(7140):1295–1298. doi:10.1136/bmj.316.7140.1295
31. Hwang JI, Chin HJ, Chang YS. Characteristics associated with the occurrence of adverse events: a retrospective medical record review using the global trigger tool in a fully digitalized tertiary teaching hospital in Korea. J Eval Clin Pract. 2014;20(1):27–35. doi:10.1111/jep.12075
32. Hardmeier B, Braunschweig S, Cavallaro M, et al. Adverse drug events caused by medication errors in medical inpatients. Swiss Med Wkly. 2004;134(45–46):664–670.
33. McMaster C, Liew D, Keith C, Aminian P, Frauman A. A machine-learning algorithm to optimise automated adverse drug reaction detection from clinical coding [published correction appears in Drug Saf. 2019 Apr 15;:]. Drug Saf. 2019;42(6):721–725. doi:10.1007/s40264-018-00794-y
34. Pham M, Cheng F, Ramachandran K, Comparison A. Study of algorithms to detect drug-adverse event associations: frequentist, Bayesian, and machine-learning approaches. Drug Saf. 2019;42(6):743–750. doi:10.1007/s40264-018-00792-0
35. Jagannatha A, Liu F, Liu W, Yu H. Overview of the first natural language processing challenge for extracting medication, indication, and adverse drug events from electronic health record notes (MADE 1.0). Drug Saf. 2019;42(1):99–111. doi:10.1007/s40264-018-0762-z
36. Govindan M, Van Citters AD, Nelson EC, Kelly-Cummings J, Suresh G. Automated detection of harm in healthcare with information technology: a systematic review. Qual Saf Health Care. 2010;19(5):e11.
37. Härkänen M, Kervinen M, Ahonen J, Voutilainen A, Turunen H, Vehviläinen-Julkunen K. Patient-specific risk factors of adverse drug events in adult inpatients - evidence detected using the global trigger tool method. J Clin Nurs. 2015;24(3–4):582–591. doi:10.1111/jocn.12714
38. Dequito AB, Mol PG, van Doormaal JE, et al. Preventable and non-preventable adverse drug events in hospitalized patients: a prospective chart review in the Netherlands. Drug Saf. 2011;34(11):1089–1100. doi:10.2165/11592030-000000000-00000
39. Sharek PJ, Parry G, Goldmann D, et al. Performance characteristics of a methodology to quantify adverse events over time in hospitalized patients. Health Serv Res. 2011;46(2):654–678. doi:10.1111/j.1475-6773.2010.01156.x
 © 2021 The Author(s). This work is published and licensed by Dove Medical Press Limited. The
full terms of this license are available at https://www.dovepress.com/terms
and incorporate the Creative Commons Attribution
- Non Commercial (unported, 3.0) License.
By accessing the work you hereby accept the Terms. Non-commercial uses of the work are permitted
without any further permission from Dove Medical Press Limited, provided the work is properly
attributed. For permission for commercial use of this work, please see paragraphs 4.2 and 5 of our Terms.
© 2021 The Author(s). This work is published and licensed by Dove Medical Press Limited. The
full terms of this license are available at https://www.dovepress.com/terms
and incorporate the Creative Commons Attribution
- Non Commercial (unported, 3.0) License.
By accessing the work you hereby accept the Terms. Non-commercial uses of the work are permitted
without any further permission from Dove Medical Press Limited, provided the work is properly
attributed. For permission for commercial use of this work, please see paragraphs 4.2 and 5 of our Terms.