Back to Journals » International Journal of Nanomedicine » Volume 10 » Issue 1
Development and evaluation of sunscreen creams containing morin-encapsulated nanoparticles for enhanced UV radiation protection and antioxidant activity
Authors Shetty PK, Venuvanka V, Jagani HV, Chethan G, Ligade V, Musmade PB, Nayak UY ![]() , Reddy MS, Kalthur G, Udupa N, Rao CM, Mutalik S
, Reddy MS, Kalthur G, Udupa N, Rao CM, Mutalik S
Received 23 June 2015
Accepted for publication 12 September 2015
Published 13 October 2015 Volume 2015:10(1) Pages 6477—6491
DOI https://doi.org/10.2147/IJN.S90964
Checked for plagiarism Yes
Review by Single anonymous peer review
Peer reviewer comments 3
Editor who approved publication: Dr Thomas Webster
Pallavi Krishna Shetty,1 Venkatesh Venuvanka,1 Hitesh Vitthal Jagani,1 Gejjalagere Honnappa Chethan,1 Virendra S Ligade,1 Prashant B Musmade,1 Usha Y Nayak,1 Meka Sreenivasa Reddy,1 Guruprasad Kalthur,2 Nayanabhirama Udupa,1 Chamallamudi Mallikarjuna Rao,1 Srinivas Mutalik1
1Department of Pharmaceutics, Manipal College of Pharmaceutical Sciences, 2Division of Clinical Embryology, Kasturba Medical College, Manipal University, Manipal, Karnataka, India
Abstract: The objective of present work was to develop novel sunscreen creams containing polymeric nanoparticles (NPs) of morin. Polymeric NPs containing morin were prepared and optimized. The creams containing morin NPs were also prepared and evaluated. Optimized NPs exhibited particle size of 90.6 nm and zeta potential of -31 mV. The entrapment efficiency of morin, within the polymeric NPs, was found to be low (12.27%). Fourier transformed infrared spectroscopy and differential scanning calorimetry studies revealed no interaction between morin and excipients. Transmission electron microscopy and atomic force microscopy revealed that the NPs were spherical in shape with approximately 100 nm diameter. Optimized NPs showed excellent in vitro free radical scavenging activity. Skin permeation and deposition of morin from its NPs was higher than its plain form. Different sunscreen creams (SC1–SC8) were formulated by incorporating morin NPs along with nano zinc oxide and nano titanium dioxide. SC5 and SC8 creams showed excellent sun protection factor values (≈40). In vitro and in vivo skin permeation studies of sunscreen creams containing morin NPs indicated excellent deposition of morin within the skin. Morin NPs and optimized cream formulations (SC5 and SC8) did not exhibit cytotoxicity in Vero and HaCaT cells. Optimized sunscreen creams showed excellent dermal safety. SC5 and SC8 creams demonstrated exceptional in vivo antioxidant effect (estimation of catalase, superoxide dismutase, and glutathione) in UV radiation-exposed rats. The optimized sunscreen creams confirmed outstanding UV radiation protection as well as antioxidant properties.
Keywords: nanoparticles, skin permeation, sunscreen, morin, sun protection factor
Introduction
Out of the solar ultraviolet radiation (UVR) that reaches the earth’s surface, UVA radiations (320–400) pass through the ozone layer and cause sunburn, premature aging of the skin by suppressing immune function. UVB radiations (290–320 nm) are blocked by ozone layer to some extent but still may be responsible for sunburn. UVC (100–290 nm) is totally filtered out by the earth’s ozone layer.1–3
The adverse effects of UVR to normal skin are of two types: acute reactions including sunburn and tanning and delayed reactions including photocarcinogenesis and photoaging.4 Sunburn is a commonly recognized aftereffect of UVR exposure, especially in fair-skinned individuals. The hyperalgesia caused due to repeated sunburn has known to be associated with accelerated aging and skin cancer.5–7 Regular exposure to UVR causes accelerated aging of the skin. Photoaged skin is dry; more wrinkled than regular skin and has seborrheic keratosis. It also has reduced elasticity and impaired wound healing abilities. To reduce exposure to the UVR, one of the major practices prescribed by The Skin Cancer Foundation, The American Academy of Dermatology, and The American Cancer Society is the use of sunscreen products.4 Topical application of protectants is most commonly used to avoid skin damage caused by solar UVR. The most commonly used are sunscreens, sometimes in combination with antioxidants and other drugs. Broad-spectrum sunscreens protect skin from UVA as well as UVB.8,9
Two types of sunscreen agents present in sunscreen formulations are physical sunscreens and chemical sunscreens. The chemical and physical sunscreen agents act by either absorbing and scattering or attenuating the solar UVR, respectively.4,9 To protect skin well against UVR, both types should be included into a sunscreen product.
Although innumerable numbers of sunscreen products are available in the market, they have several drawbacks. Some physical sunscreen agents make the preparation opaque and may result in whitish appearance of the skin treated topically with them. The physical sunscreen agents impart high opacity to the topical preparation, which makes the formulated creams cosmetically unacceptable and leave a whitish layer on the skin. Chemical sunscreens may cause side effects, such as erythema, edema, and irritation.10 The progression in the field of nanotechnology and preparation of nanosized zinc oxide and titanium dioxide has allowed formulator to create more effective and cosmetically acceptable sunscreen cream, without causing local side effects except, perhaps, generation of free radicals, which may be carcinogenic.11–13
Hence, addition of other sunscreen agent along with physical sunscreen is better option to enhance the level of protection. Physical (titanium dioxide, zinc oxide) and chemical (octyl methoxycinnamate, oxybenzone, octocrylene, and luteolinon) ingredients can be incorporated into sunscreens in the form of nanoparticles (NPs), which reportedly can optimize material delivery into the outer skin layers.14–16
There are few reports available on the application of NPs of physical and chemical sunscreen ingredients (titanium dioxide, zinc oxide, octyl methoxycinnamate, oxybenzone, octocrylene, and luteolinon) to improve sun protection efficacy. UV-absorbing agents must accumulate within the upper skin layers in order to provide a dense light-absorbing layer and guarantee water resistance. Skin penetration of four different types of rutile titanium dioxide was assessed using the skin of micropigs. TiO2 was able to penetrate into the vacant hair follicles.11,17–20 Physical UV absorbers like titanium dioxide and zinc oxide have been considered as highly protective agents against UVR. ZnO and TiO2 combinations are particularly valuable because of their ability to filter both UVA and UVB radiations, providing broader UVR protection than that observed with individual component.9,13
Incorporation of antioxidants could provide additional benefit by scavenging free radicals. Natural polyphenols are attractive in this respect, due to their potential activity as photoprotectans and antioxidants.21–24 In this study, we used morin (molecular weight [MW] =302.24 g/mol; log P=1.92), which is an important plant flavonoid possessing both antioxidant and UVR protection properties. It is desirable to deliver morin only into epidermis, thus minimizing its access to the systemic blood circulation.
Self-emulsifying drug delivery systems and niosomes containing morin have been reported for oral and intravenous administration;25,26 but not via topical application. We therefore developed polymeric NP loaded with morin along with commercially available nano ZnO and nano TiO2, aiming to improve the penetration of morin into the skin, with minimum spillover into systemic circulation.
Materials and methods
Materials
The materials used in the present study include morin (Sigma-Aldrich Co., St Louis, MO, USA), acetone (Finar Chemicals Ltd, Gujarat, India), dichloromethane (S.D. Fine Chemicals Pvt Ltd, Maharashtra, India), polyvinyl alcohol (PVA) (MW: 30,000 g/mol; Sigma-Aldrich Inc), poly(D,L-lactide-co-glycolide) (PLGA; ratio: 50:50; MW: 15,000 g/mol; inherent viscosity:0.154–0.186; Wako Pure Chemicals Industries Ltd, Washington, DC, USA), 2,2-diphenyl-1-picrylhydrazyl (DPPH; Sigma-Aldrich Inc), acetonitrile (HPLC grade; Merck Specialties Pvt Ltd, Mumbai, India), methanol (HPLC grade; Sisco Research Laboratories Pvt Ltd, Mumbai, India), ketamine hydrochloride Indian Pharmacopoeia (IP) (Neon Laboratories Ltd, Thane, India). All other chemicals used were of analytical grade.
Cell lines and culture media
HaCaT (human keratinocytes) and Vero (normal green monkey kidney epithelial cells) cell lines were procured from National Centre for Cell Sciences (Pune, India). The experimental protocol involving the use of cell lines was approved by Institutional Research Committee of Manipal College of Pharmaceutical Sciences. The cells were cultured with Dulbecco’s Modified Eagle’s Medium supplemented with 10% fetal bovine serum and penicillin (100 μg/mL), streptomycin (100 μg/mL), and amphotericin-B (5 μg/mL) and incubated in 5% CO2 at 37°C (Healforce Incubator, Shanghai, People’s Republic of China).
Animals
Male Wistar rats weighing between 180 and 220 g (6–8 weeks old) were used for the preclinical experiments. The rats were housed in polypropylene cages at 24°C–26°C with free access to standard rat food pellets (VRK Scientists Choice, Sangli, India) and potable water. They were exposed to a daily 12:12 hour light:dark cycle (lights on at 6 am). The preclinical experimental protocol was ratified by Institutional Animal Ethical Committee, Kasturba Medical College, Manipal University, Manipal (Approval No: IAEC/KMC/13/2013).
Preformulation studies
Saturation solubility of morin
Saturation solubility was determined by adding excess quantity of morin in 3 mL of different media in glass vials and shaking them in an orbital shaker for 24 hours. After passing solution through a 0.2 μm syringe filter, the amount of morin dissolved was estimated spectrophotometrically (UV-1601PC, Shimadzu Corporation, Kyoto, Japan) at 360 nm.
Estimation of morin by HPLC
Morin was estimated by reverse phase HPLC method. The HPLC system (Shimadzu Corporation) was equipped with a pump, a system controller, a variable-wavelength UV/Vis detector, an auto-injector, and LC Solution software (version: 3.1). The HPLC column was a reverse phase C18 column (Genesis, Fremont, CA, USA; particle size 5 μm; 250×4.6 mm), maintained at 25°C. The elution medium was an acetonitrile:phosphate buffer mixture (40:60 V/V), supplemented with 0.1% triethylamine (pH =3.5), used at flow rate of 0.8 mL/min. The injection volume was 25 μL. This resulted in 6.95 minutes retention time, and linear calibration curve (R=0.9991) for morin in concentration range of 25–2,000 ng/mL. The method was validated with respect to intraday precision (relative standard deviation [RSD]: <1%), inter day precision (RSD: <2%), accuracy (RSD: <1%), and robustness (RSD: <2%).
Drug-excipient compatibility studies
The interaction between morin and excipients was studied by Fourier transformed infrared spectroscopy (FTIR), differential scanning calorimetry (DSC), and X-ray diffraction (XRD). Infrared spectroscopy was performed using Shimadzu FTIR 8300 Spectrophotometer (Shimadzu Corporation) with KBr pellet technique by recording the resulting IR spectrum from 4,000/cm to 400/cm. DSC was performed using DSC-60 calorimeter (Shimadzu Corporation), comprised a flow controller (FCL 60), thermal analyzer (TA 60), and operating software (TA 60). Each DSC sample was placed into a sealed aluminium pan, flushed with nitrogen (50 mL/min), and scanned at rate of 5°C/min from 30°C to 360°C. Empty aluminium pan was used as a reference. To characterize solid morin in NP, XRD was measured with Miniflex 600 X-ray diffractometer (Rigaku Corporation, Tokyo, Japan), scanning in the diffraction angle (2θ) from 0° to 100°.
Preparation and characterization of morin NPs
Preparation of morin NPs
PLGA polymeric NPs encapsulated with morin were prepared by the modification of reported double emulsion and solvent evaporation method.27,28 PLGA was dissolved in dichloromethane and morin was dissolved in acetone. The drug and polymer blend was added, drop-wise, to a constantly homogenized (Polytron PT 310, Kinematica, Luzern, Switzerland) PVA solution (20 mL), and then sonicated using probe sonicator (VC 130, Sonics and Materials Inc, Newton, CT, USA). The dispersion was stirred on a magnetic stirrer for 12 hours. The dispersion was centrifuged for 10 minutes at 5,000 rpm (2,124× g) and the supernatant was collected. The supernatant was again centrifuged (Sigma Laborzentrifugen GmbH, 3K30, Osterode, Germany) at 22,000 rpm (41,125× g) for 60 minutes and the pellet formed was resuspended in 1 mL of Millipore water.
Optimization of NPs was achieved by varying several parameters in above method, such as: amount of morin (2.5–5 mg), amount of PLGA (20–25 mg), concentration of PVA (0.1%–1% w/v in water), homogenization parameters (12,000–17,500 rpm), homogenization time (5–15 minutes), and varying sonication parameters. For different batches, ultrasound was applied for 15–40 minutes at the amplitude of 60–80 to achieve the output wattage of 25/cm2. On-off cycle of 5–6 seconds was followed, ie, for 5 seconds cycle, ultrasound was “on” for 5 seconds and then “off” for 5 seconds. The suspension of NPs was lyophilized for 48 hours in freeze dryer (LFD-5508, Daihan Labtech Co. Ltd, Gyeonggi-do, Korea). Mannitol (5% w/v in water) was used as a cryoprotectant.
Particle size, zeta potential, and surface morphology
The average size and the size distribution of the prepared morin NPs were measured at 25°C±1°C by dynamic light scattering, with NanoZS (Malvern Instruments, Malvern, UK). All the NP samples were appropriately diluted with MilliQ water to get optimum (60–200) kilo counts per second (Kcps) for measurement at a temperature of 25°C±1°C. Zeta potential of the NPs was determined by combination of laser Doppler velocimetry and phase analysis light scattering method using a NanoZS (Malvern Instruments). The size, surface morphology, and shape of the freeze-dried NPs were assessed using transmission electron microscopy (TEM) (Morgagni TEM, FEI, Eindhoven, Netherlands) and atomic force microscopy (AFM) (Bruker, Innova AFM, Karlsruhe, Germany).
Entrapment efficiency
The entrapment efficiency of morin was determined by dissolving the pellet of morin NPs in 15 mL of methanol using probe sonication for 5 minutes. The sample was filtered through 0.2 μm syringe filter and the amount of morin was determined using HPLC (Shimadzu Corporation). Entrapment efficiency was calculated using the following formula:
|
|
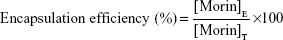
where [Morin]E represents the amount of encapsulated morin and [Morin]T represents the total amount of morin.
In vitro antioxidant activity
The in vitro antioxidant activity of plain morin and its NPs was assessed by DPPH assay following the previously reported method.3,29 Briefly, in a 96-well plate, 100 μL of DPPH (200 μM) in methanol was added to 100 μL of different concentrations of quercetin (standard), morin, and morin NPs in methanol and was incubated in dark at room temperature for 20 minutes. The concentration range of the samples tested was 2.4–30 μg/mL. To determine the scavenging activity, an enzyme linked immunosorbent assay (ELISA), read-off at 540 nm, was used. The experiment was performed in quadruplicate and IC50 (μg/mL) was calculated by interpolation.
Preparation and evaluation of sunscreen creams
Preparation of sunscreen cream
The composition of different sunscreen creams is given in Table 1. Cream base was formulated by o/w emulsification technique. Oil phase ingredients (white soft paraffin, mineral oil, glyceryl monostearate, jojoba oil, stearic acid, and methyl paraben) and aqueous phase ingredients (part of water, triethanolamine, disodium ethylenediaminetetraacetic acid, and allantoin) were heated separately at 70°C. Carbopol was separately soaked in water for 6 hours. Oil phase was added to aqueous phase with continuous stirring followed by the addition of carbopol solution at 35°C. The cream was cooled with continuous stirring (1,000 rpm using mechanical stirrer) at room temperature. To this formulated cream base, measured quantity of sunscreen ingredients (nano ZnO, nano TiO2, morin NPs, or plain NPs) was added as mentioned in Table 1 in different combinations and stirred at 1,500 rpm using high speed mechanical stirrer to form a homogenous cream. Cream was stored at room temperature in tightly closed containers.
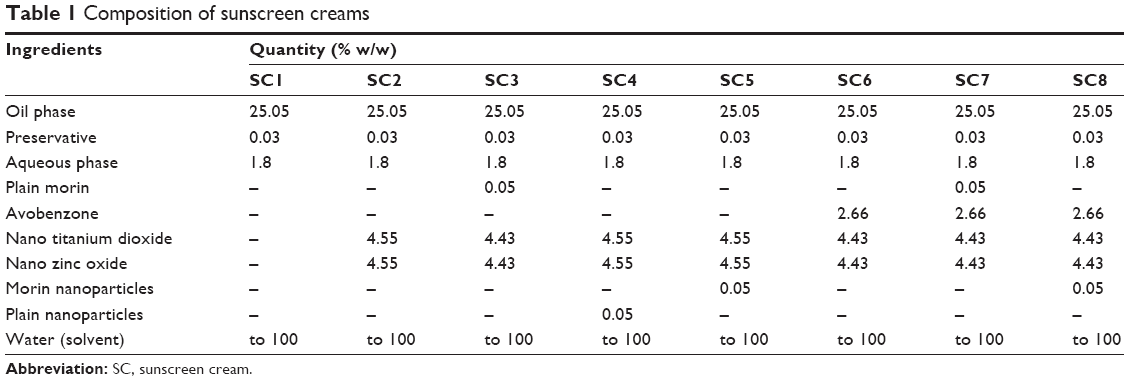 | Table 1 Composition of sunscreen creams |
Physicochemical evaluation of the cream
Appearance and color were evaluated visually and odor was assessed by subjective evaluation. The cream pH was measured with a digital pH meter, using a 1/10 dilution of the cream in distilled water.30 Viscosity of the cream was measured using Brookefield Viscometer (LVDV-II+P; spindle No 96). Cream spreadability was measured with prepublished methods.31
In vitro occlusion studies
The occlusivity of cream was assessed by occlusion factor. For the purpose, a water-filled beaker was covered with a filter paper. The maximum occlusion factor is 100. Zero occlusion factor indicates no occlusion effect as compared with the reference.32
Sun protection factor
Sun protection factor (SPF) was measured with a UV-2000S transmittance analyzer (Labsphere, North Sutton, NH, USA). The creams (1.3 mg/cm2), placed on polymethylmethacrylate plates (25 cm2), were tested following the COLIPA guidelines. Cream base without UV-absorbing agents was used for blank scan. Three sample plates were prepared and kept in dark for 15 minutes for curing. Then, the plates were scanned at three different locations and the SPF value was recorded.33
Cytotoxicity assay using [3-(4,5-dimethylthiazol-2-yl)-2,5-diphenyltetrazolium bromide]
HaCaT and Vero cells were plated in 96-well flat-bottom microtiter plate (density: 1×10⁴ cells per well). To ensure cells adhesion, the cells were cultured for 24 hours at 37°C in 5% CO2. After 24 hours (when partial monolayer was formed), the medium was removed and the cells were exposed to different concentrations of morin or its NPs for 48 hours. Microscopic observations were recorded every 24 hours. After such treatment, the solutions in the wells were discarded and 50 μL of freshly prepared [3-(4,5-dimethylthiazol-2-yl)-2,5-diphenyltetrazolium bromide] (MTT) (2 mg/mL, in phosphate-buffered saline) was added to each well. The plates were shaken gently and incubated for 3 hours at 37°C under 5% CO2 atmosphere. Thereafter, the supernatant was removed and the formazan crystals formed in the cells were solubilized by addition of 50 μL of iso-propanol. Finally, the solution absorbance at 540 nm was read-off in a Micro-plate reader (Bio-Tek, EL X-800 MS).34,35
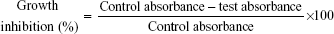
The percentage growth inhibition was calculated using the formula below:
|
|
In vitro skin permeation studies
In vitro skin permeation measurements involved a piece of the dorsal full thickness skin, trimmed free of subcutaneous fat, after its excision from male Wistar rats, shaved carefully on the day before. Such skin samples were placed into a diffusion cell (vertical type; surface area: 1.33 cm2; receptor compartment: 3.5 mL), kept at 32°C, so that skin surface faced the donor chamber, filled with 1 mL of saturated solution of morin in MilliQ water/morin nanoparticulate suspension (NPs equivalent to 0.5 mg of morin were dispersed in 1 mL of water) and cream (≈1 g of SC3, SC5, SC7, or SC8 cream containing 0.5 mg of morin). Receptor compartment was filled with 3.5 mL of pH 7.4 buffer solution. The whole cell setup was stirred at 600 rpm on a magnetic stirrer. One milliliter of sample was collected from the receptor compartment at different time intervals between 0 and 12 hours, and an equal volume of fresh buffer was added after each sampling. The amount of morin permeated into receptor solution was assayed by HPLC.
After completion of the permeation studies, the skin was removed from the diffusion cell and the surface was cleaned with distilled water to eliminate drug residue. The skin was dabbed with dry cotton and fixed on a flat surface. The diffusion area of skin was cut into small pieces and homogenized with 10 mL of methanol to extract the morin. The solution was then filtered through a 0.45 μm membrane filter and the filtrate was analyzed for morin content using HPLC.36
Primary skin irritation studies
Primary skin irritation studies of the optimized creams were performed in Wistar rats. Rats were divided into three groups (n=6) and back portion (≈2 cm2 area) of the rats was shaved on the day before the experiment. Cream base with zinc oxide and titanium dioxide (SC2) and optimized sunscreen creams (SC5) at a dose of 2 mg/cm2 were applied for 7 days daily once. Untreated group was served as a control. At the end of 7 days, the applied skin was examined visually for erythema and edema. Erythema scores were defined as: 0= none; 1= slight; 2= well defined; 3= moderate; and 4= scar formation. The edema score was assigned as: 0= none; 1= slight; 2= well defined; 3= moderate; and 4= severe.32
After the treated skin visual examination, all animals were sacrificed and the skin was excised and studied histopathologically using hemotoxylin and eosin staining. The criteria included degeneration, necrosis, congestion, inflammation, and edema. The histopathological scores for each parameter were none = -, slight = +, moderate = ++, and severe = +++.
In vivo antioxidant activity
The back portion (≈2 cm2 area) of the Wistar rats was shaved on the previous day of the experiment. The tested groups (n=6) were
Group 1: Normal (No sunscreen cream and no UVR).
Group 2: UVR control (No sunscreen cream but subjected to UVR for 30 minutes).
Group 3: Applied with SC5 cream (2 mg/cm2) and exposed to UVR for 30 minutes.
Group 4: Applied with SC8 cream (2 mg/cm2) and exposed to UVR for 30 minutes.
Then, the rats were sacrificed by administering excess of ketamine intraperitoneally and the treated skin was dissected out. In the homogenized skin samples, levels of reduced glutathione (GSH), catalase (CAT), and superoxide dismutase (SOD) reactive substances were estimated as reported previously.37–40 UV source for irradiation consisted of a chamber fitted with UV light source with an emission of 360 nm, yielding an energy output of 52.5 mJ/cm2. The lamp was fixed 5 cm above the platform where rats were placed.
In vivo skin permeation study
In vivo skin permeation studies of the selected sunscreen creams (SC5 and SC8) were performed in Wistar rats. Each tested rat’s back was shaved on the day prior to an experiment. Following cream application on such a site (≈1 g/1.33 cm2), 500 μL blood samples were collected retroorbitally at different times up to 12 hours. Plasma was separated by centrifugation at 10,000 rpm for 15 minutes at 4°C. Morin was extracted from plasma (as given below) and analyzed for its content using HPLC. Thereafter, rats were sacrificed with an intraperitoneal injection of ketamine to excise the treated skin, which was washed with distilled water. Morin content in the homogenized skin sample was determined by HPLC, as follows.
Estimation of morin in plasma by HPLC
The extracted morin concentration was measured with the described HPLC method, using gliclazide as the internal standard. Briefly, an aliquot of 90 μL of plasma was mixed with 10 μL of glicazide (internal standard) standard solution (500 μg/mL). To this mixture, 1 mL of tert-butyl methyl ether was added and vortexed for 2 minutes. It was then centrifuged at 10,000 rpm for 10 minutes in a cooling centrifuge (Sigma Laborzentrifugen GmbH) at 4°C. The supernatant was collected, separated and kept in N2 evaporator for 5 minutes, for subsequent injection (50 μL) onto the HPLC column. Retention time of morin and internal standard (gliclazide) was 6.15 and 11.90 minutes, respectively. The peaks of morin and internal standard were of good shape, resolved well from one another, and no interference from plasma matrix was observed at the retention times. The calibration curve was linear (R2=0.9990) over the concentration range of 300–4,000 ng/mL. The method was validated with respect to precision (RSD: <15%) and accuracy (RSD: <15%). Recovery (81%) was found to be consistent and reproducible. The concentration of morin was calculated using this calibration curve.
Statistical analysis
The data was analyzed by one-way ANOVA (GraphPad Prism 5.00, Instat Software, San Diego, CA, USA) followed by Dunnett’s post hoc test (in case of comparison of results with control) or Tukey’s post hoc test (in case of comparisons of multiple groups) and P-value <0.05 was considered as statistically significant.
Results and discussion
Saturation solubility of morin
The saturation solubility of the morin was analyzed in different media. The values of saturation solubility are as follows: distilled water: 6.37 μg/mL; pH 1.2: 6.89 μg/mL; pH 4.5: 28.04 μg/mL; pH 6.8: 119.73 μg/mL; pH 7.4: 191.52 μg/mL; pH 9.2: 173.62 μg/mL. However, there was no linearity observed in the experimentally determined saturation solubility values. Morin showed very low solubility in distilled water; but, when pH was increased, an increased solubility was observed up to pH 7.4. Hence, phosphate buffer pH 7.4 was used for skin permeation studies.
Morin–excipient compatibility studies
The bioactive agent and excipients must be compatible with each other to produce a stable, safe, and efficacious product. The possible interaction between the drug and the carrier was studied by FTIR and DSC.
The IR spectrum of morin showed characteristic peaks at 3,376.50/cm for O-H stretching, 3,097.78/cm for C-H aromatic stretching, 1,660.77/cm for C=H alkene stretching, 1,459.20/cm for C=C alkene stretching, 1,173.72/cm for C=O group, and 1,425 cm−1 for C=C aromatic stretching. These peaks are indicative values to elucidate functional groups of morin. The IR results of physical mixture of morin and PLGA, and morin NPs indicated no considerable changes in the IR peaks of morin when mixed with excipients, demonstrating the absence of any chemical interaction between morin and excipients used.
DSC is a useful tool that gives an insight into melting and recrystallization behavior of crystalline materials. The DSC thermograms of pure morin, PLGA alone, and morin NPs are shown in Figure 1.
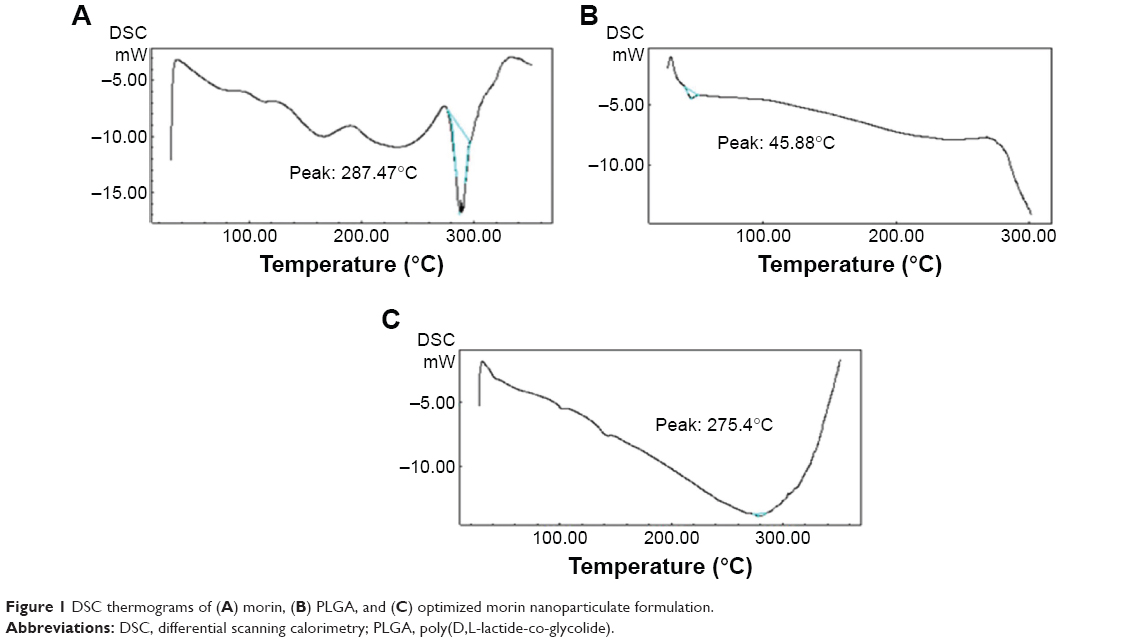 | Figure 1 DSC thermograms of (A) morin, (B) PLGA, and (C) optimized morin nanoparticulate formulation. |
Morin showed a sharp endothermic melting peak at 287.47°C (Figure 1A). PLGA polymer alone showed an endothermic peak at 45.88°C conforming to its melting point (Figure 1B). Morin endothermic peak in nanoparticulate form was 275.4°C (Figure 1C), indicating the absence of interaction between polymer and morin. However, little decrease in melting point of morin along with reduction in peak intensity may suggest partial amorphization of morin.41–43
Optimization and characterization of morin NPs
Morin NPs were prepared by modified double emulsion and solvent evaporation method. Optimization of morin of NPs was achieved by varying different formulation parameters. The following NPs composition was found to be the best among the tested ones: amount of morin: 2.5 mg; amount of PLGA: 25 mg; concentration of PVA solution: 1% w/v; homogenization speed: 16,000 rpm; homogenization time: 10 minutes; sonication parameters: 80 amplitude to achieve an output wattage of 25/cm2 with an on-off cycle of 6 seconds for 40 minutes.
Various parameters were optimized to come up with a final optimized formulation that has lower mean particle size and polydispersity index and higher zeta potential and drug entrapment efficiency. Optimized morin NP showed mean particle size of 90.6 nm and polydispersity index of 0.236. NPs of this size range have been reported to exhibit penetration into epidermis layer.15,44 Zeta potential of optimized batch was found to be excellent (-31 mV), indicating good electrostatic stabilization.45 Optimized batch showed entrapment efficiency of 12.27%, which was highest among the batches prepared.
XRD studies
The XRD patterns of pure morin, PLGA, and optimized NPs are shown in Figure 2. Figure 2A (pure morin) showed sharp peaks (14°, 25°, and 28°) with high intensity corresponding to crystalline nature of morin. Figure 2B shows the XRD pattern of PLGA alone which showed only one peak at 11.72° without any other specific sharp peaks. Figure 2C shows the XRD pattern of morin NPs, which depicts the presence of lower intensity peaks with halo region. These results indicate partial amorphization of morin in its nanoparticulate form.26,41–43
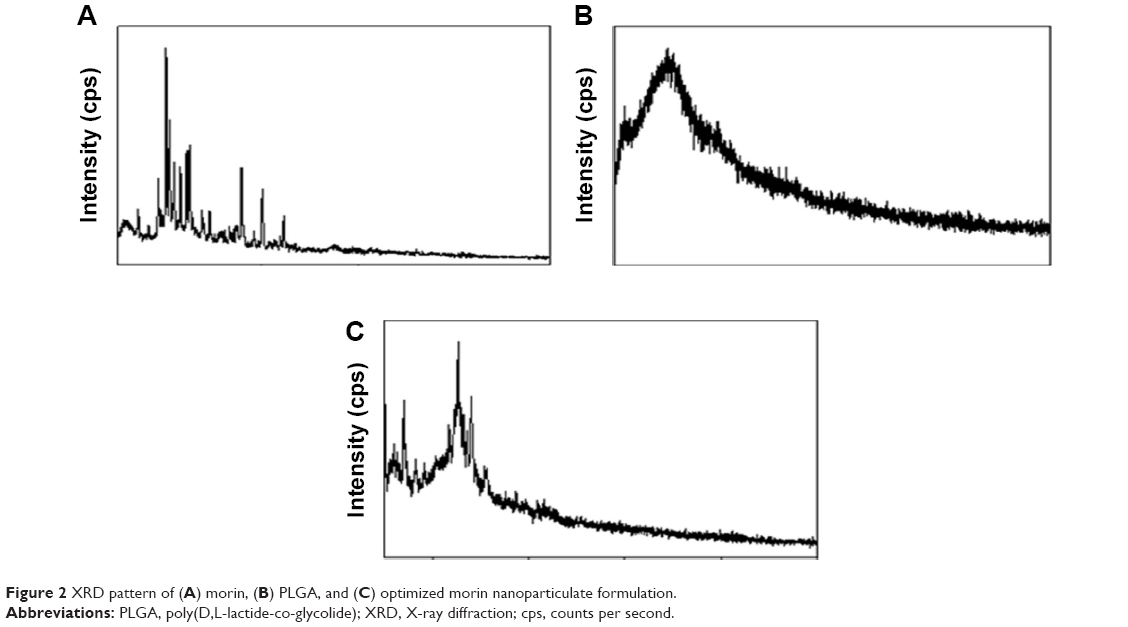 | Figure 2 XRD pattern of (A) morin, (B) PLGA, and (C) optimized morin nanoparticulate formulation. |
Surface morphology of NPs
The surface morphology of the optimized NPs was assessed by AFM and TEM. TEM image (Figure 3A) confirmed the spherical shape of the particles with the size range of majority of the particles at ≈100 nm. AFM images (Figure 3B) also clearly indicated the spherical shape of the particles with the size of ≈100 nm.
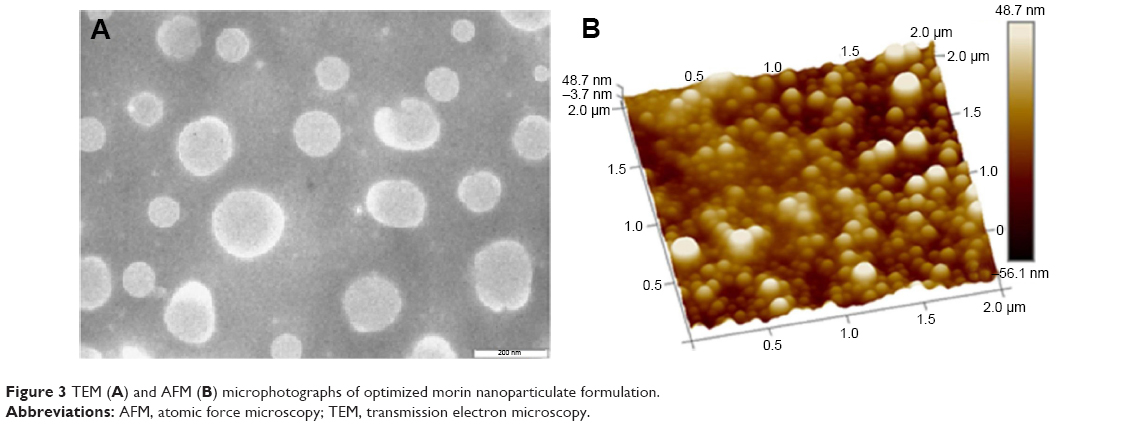 | Figure 3 TEM (A) and AFM (B) microphotographs of optimized morin nanoparticulate formulation. |
In vitro free radical scavenging activity by DPPH assay
The in vitro free radical scavenging activity of plain morin, optimized morin NPs, and quercetin (standard) was determined by DPPH assay. In this assay, free radical scavenging activity was in the order: plain morin > quercetin > morin NPs. The IC50 values were found to be 8.45±0.22, 10.29±0.49, and 12.49±0.26 μg/mL for plain morin, quercetin, and morin NPs, respectively. The IC50 value of morin in its nanoparticulate form was ≈1.5 times higher in comparison with plain morin. Morin exhibited better DPPH scavenging activity than that observed with quercetin. Higher IC50 value observed with morin NPs may be due to slow diffusion of morin from the NPs. However, the results revealed that morin retains its potential antioxidant effect in its polymeric nanoparticulate form.
Physicochemical evaluation of the sunscreen creams
Different sunscreen creams (as shown in Table 1) were prepared by incorporating morin NPs equivalent to 0.05% w/w of morin. The results of physicochemical evaluation of sunscreen creams (SC1–SC8) are depicted in Table 2. All the formulated sunscreen creams were smooth and creamy in appearance with pleasant odor. Creams SC1, SC2, SC4, and SC6 were white in color and all other creams (SC3, SC5, SC7, and SC8) were pale yellow in color.
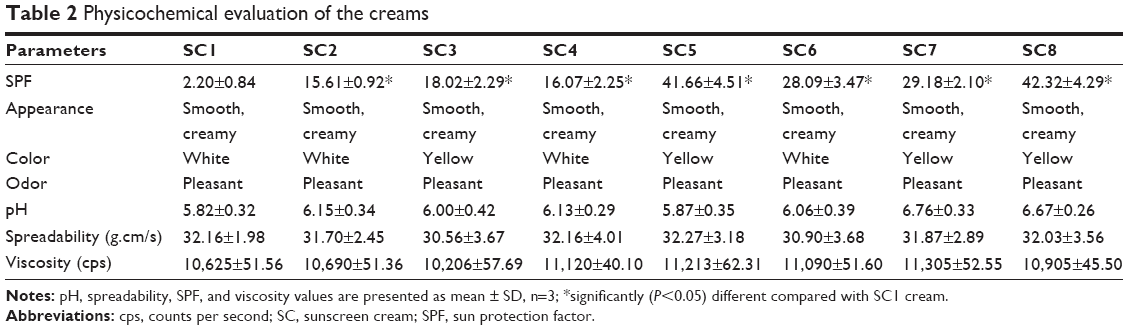 | Table 2 Physicochemical evaluation of the creams |
The creams showed the pH values range between 5.82±0.32 and 6.76±0.33. Spreadability values showed that the creams possessed good and uniform spreadability property. The viscosity of different sunscreen creams ranged from 10,206±57.69 to 11,305±52.55 cps.
In vitro occlusion studies of the sunscreen creams (SC1–SC8) and reference control (without cream) were performed. The occlusivity of the formulations was determined by occlusion factor. If the occlusion factor is “0”, then it indicates that there is no occlusion effect when compared with the reference. The maximum occlusion factor is “100”. The occlusive factor of all the creams was found to be >84, indicating higher occlusion effect for the creams as compared with the reference. More moist skin is more pliable, and retains its moisturizing effect.32
The efficacy of the sunscreen creams with respect to UVR protection property is expressed by the SPF values. The SPF values of the creams were found to be 2.20±0.84, 15.61±0.92, 18.02±2.29, 16.07±2.25, 41.66±4.51, 28.09±3.47, 29.18±2.10, and 42.32±4.29 from SC1 to SC8, respectively. SPF values of SC1 and SC2 creams revealed the importance of physical sunscreen agents (nano-TiO2 and nano-ZnO) in order to achieve high UVR protection. When plain morin was incorporated (SC3 cream), the SPF value was further increased (SPF =18.02±2.29), although not considerably, which indicates that plain morin possesses UVR protection property. The cream containing plain polymeric NPs (SC4) also showed higher SPF value (16.07±2.25) compared with SC1 and SC2 creams. This observation indicates plain polymeric NPs also exhibit good SPF value and hence UVR protection, which could be due to formation of more even film by the cream in presence of NPs. SC5 cream containing morin NPs showed substantially higher SPF value (41.66±7.51) than SC1–SC4. This high SPF value might be due to combined effect of polymeric NPs as well as morin. This result shows morin when presented in the form of polymeric NPs exhibits greater UVR protection. SC6 cream showed good SPF value (28.09±3.47), which could be due to the presence of widely used chemical sunscreen agent, avobenzone. It exhibited higher SPF value than SC1, SC2, SC3, and SC4 creams (but lower than SC5 cream). However, avobenzone, when combined with plain morin (SC7 cream), did not exhibit appreciable SPF value (29.18±2.10). On the contrary, when avobenzone was combined with morin NPs (SC8 cream), the SPF value was greatly increased (42.32±8.29). Nevertheless, there was not much difference in the SPF values of SC5 and SC8 creams. The results clearly indicate that plain morin did not enhance the SPF value considerably either in combination with physical sunscreen agents or in combination with avobenzone. In contrast, the results revealed that morin in nanoparticulate form exhibits greater SPF value.
According to US Food And Drug Administration (FDA) monograph, sunscreen products with SPF 2–12 provide minimum sunburn protection, SPF of 12–30 provides moderate sunburn protection and products with SPF 30 and above provide high sunburn protection.21 In addition, usually SPF value 30 indicates that it belongs to high photoprotection category according to European recommendations and FDA monograph (http://www.thaicosmetic.org/documents/final-PresentationUVA.pdf). It has been reported that the sunscreen products with SPF value of 30 or more block 97% of UVB rays and allow only 1/30th of rays to pass through skin (http://www.sun-protection-and-products-guide.com/SPF.html). Two of the formulated creams (SC5 and SC8) were found to possess excellent UVR protection effect as indicated by the SPF values of >30.
In vitro skin permeation studies
The results of skin permeation studies are shown in Figure 4. The cumulative amount of morin from plain morin suspension and nanoparticulate morin suspension at the end of 12 hours (Q12) was found to be 94.22±4.16 μg/cm2 and 162.31±5.26 μg/cm2, respectively (both values are significantly different from each other; P<0.05). The amount of morin permeated from nanoparticulate suspension at the end of 12 hours was much higher than that observed with morin plain suspension. This may be due to the ability of NPs to penetrate the skin to greater extent.
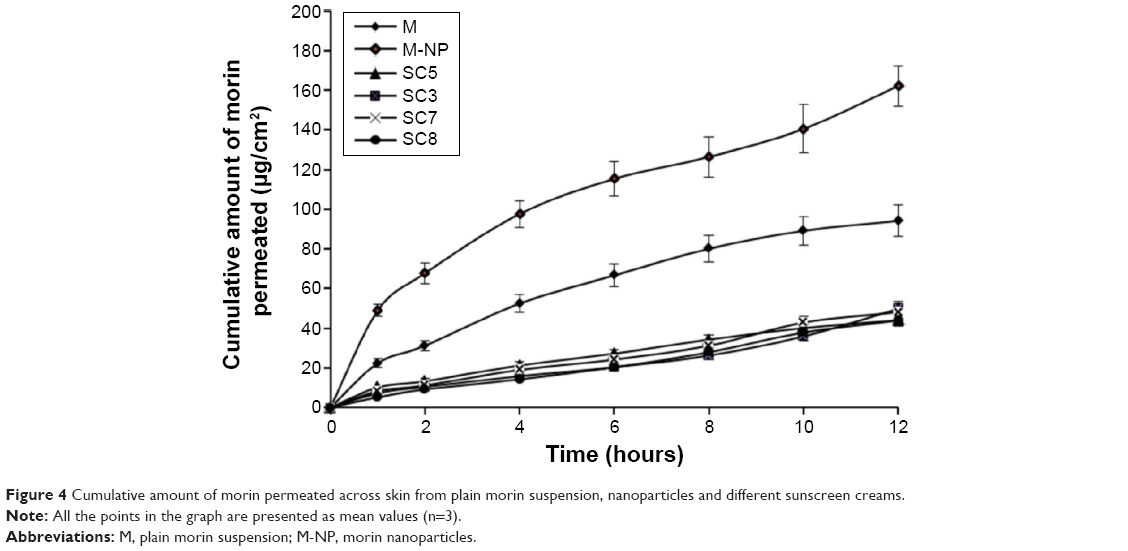 | Figure 4 Cumulative amount of morin permeated across skin from plain morin suspension, nanoparticles and different sunscreen creams. |
The results of skin permeation studies of different sunscreen creams indicated that Q12 values (cumulative amount of morin permeated at 12th hour) from the tested creams (SC3, SC5, SC7, and SC8) were decreased to greater extent in comparison with plain morin and nanoparticulate morin. Q12 values of 49.85±2.55, 44.1±3.15, 48.09±3.69, and 43.91±4.01 μg/cm2 were observed for SC3, SC5, SC7, and SC8 sunscreen creams, respectively; all these values were not significantly different from each other, P>0.05.
Besides improving drug permeation, the NPs resulted greater skin deposition of morin indicating that the particles are also getting retained to higher extent within the skin in addition to resulting higher skin permeation of morin (skin retention of morin was 10.71±0.98 μg/cm2 and 35.79±1.27 μg/cm2 from plain morin suspension and morin NPs, respectively; both values are significantly different from each other, P<0.05). The NPs yielded good skin permeation as well as retention for morin. These results are in accordance with previous reports where NPs (containing quercetin, soy isoflavones, and benzophenone),46–48 liposomes (containing diclofenac sodium),49 and transfersomes (containing quercetin and indinavir sulfate)50,51 have shown enhanced skin permeation for the respective drugs. The skin pore sizes for different structures are hair follicle diameter: 0.3–0.75 μm; pilosebacious diameter: 10–75 μm; hydrophilic pore (sweat ducts) diameter: up to 50 μm; inter-corneocyte pathway diameter: up to ≈30 nm.52,53 In previous reports, enhanced permeation and deposition of bioactive molecules via nanoparticulate systems has been attributed to increased skin penetration of NPs through transcellular and transappendageal pathways, and same mechanism(s) may have been involved in the present study as well.54
At the same time, the amount of morin retained within the skin was increased for the creams (104.21±4.16, 175.66±6.09, 115.46±6.00, and 178.15±7.44 μg/cm2 from SC3, SC5, SC7, and SC8 creams, respectively) in comparison with plain morin and morin NPs. It is interesting to observe that sunscreen creams containing nanoparticulate morin (SC5 and SC8) exhibited significantly higher (P<0.05) skin retention of morin compared with the creams containing plain morin. This could be attributed to 1) greater skin penetration of nanoparticulate morin and 2) then accumulation of this penetrated morin within the skin by the components of the cream. Different components present in cream base could be responsible for improved deposition of morin within the skin instead of making it more permeable across the skin. For example, jojoba oil present in the cream base has already been reported to increase the skin deposition of different drug molecules.55 On the other hand, morin in its plain form did not penetrate the skin to greater extent which resulted in less skin retention. Based on the skin deposition of morin and its permeation across the skin, SC5 (containing morin NPs and physical sunscreens; but without avobenzone) and SC8 (containing morin NPs, physical sunscreens, and avobenzone) creams were selected for further studies.
For in vitro skin permeation study, we used approximately 1 g of the cream to observe the skin permeation and deposition profile of morin by its quantification using HPLC. However, we also conducted the in vitro skin permeation studies of SC5 and SC8 at the actual recommended dose of sunscreen cream for topical application (2 mg/cm2). At this application dose, permeation of morin across the skin into the receptor solution was not observed till 12 hours. Conversely, quantifiable amount of morin was retained within the skin at the end of 12 hours (401.11±19.89 ng/cm2 and 390.67±25.12 ng/cm2 from SC5 and SC8 sunscreen creams, respectively; these values are not significantly different from each other, P>0.05). These results indicate that optimized sunscreen creams possess the ideal property with respect to deposition of bioactive molecules within the skin rather than permeation across the skin.
In vitro cytotoxicity assay
The results of in vitro cytotoxicity assay are shown in Figure 5. The conversion of yellow tetrazolium MTT to purple color formazan crystals by the action of dehydrogenase enzymes present in mitochondria of living cells is widely accepted and reliable method to examine cell viability.35 Cytotoxicity of plain morin, morin NPs, cream base, and optimized creams (SC5 and SC8) was evaluated on HaCaT and Vero cells. All these samples were found to be non-toxic as >87% of both cells were viable after the treatment with test solutions for 48 hours. This indicates the non-toxic nature of native morin, morin NPs, as well as the formulated sunscreen creams.
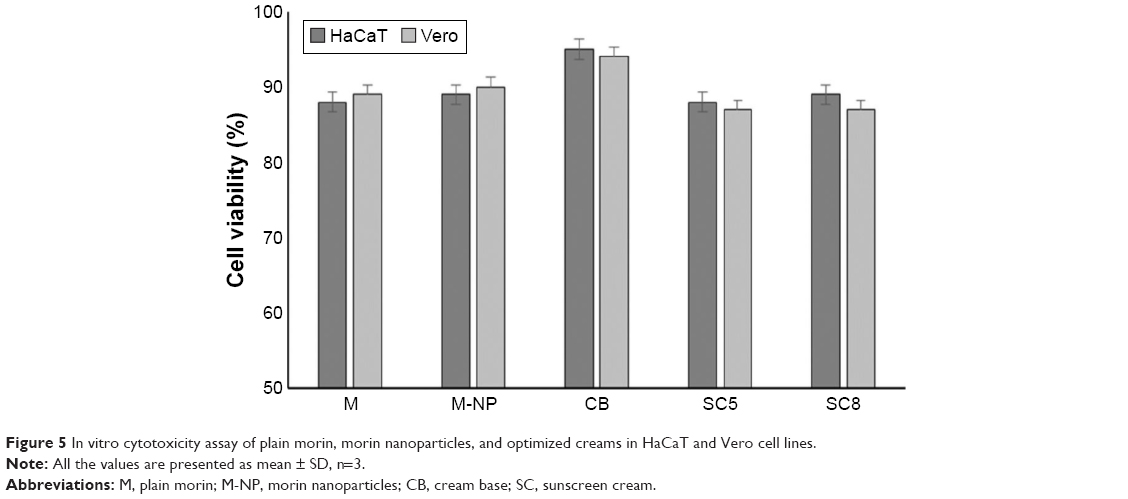 | Figure 5 In vitro cytotoxicity assay of plain morin, morin nanoparticles, and optimized creams in HaCaT and Vero cell lines. |
Primary skin irritation studies
Primary skin irritation studies for selected creams (SC2, SC3, SC5, and SC8) were performed in Wistar rats (Table 3). As rat skin has more structural similarities to human tissues and permeation kinetic parameters have been frequently compared with human skin.56,57 The erythema score for the rats treated with selected creams was found to be 0.17±0.41, 0.17±0.41, 0.17±0.41, and 0.33±0.51, respectively. The edema score for the animals treated with SC2, SC3, SC5, and SC8 was observed to be 0.00±0.00, 0.17±0.41, 0.00±0.00, and 0.17±0.41, respectively. Control animals did not show any sign of erythema and edema. The results clearly demonstrated that the tested creams did not produce any significant edema and erythema in rats.
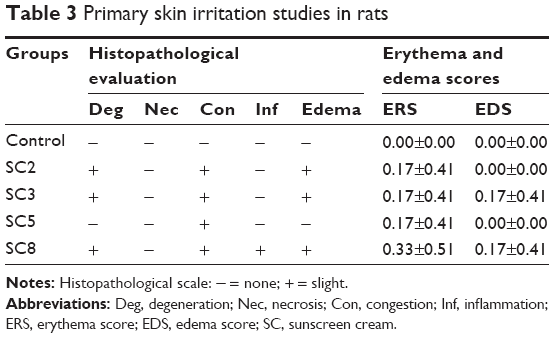 | Table 3 Primary skin irritation studies in rats |
Histopathological studies were also conducted on excised skin of Wistar rats. Excised skin was studied microscopically in order to evaluate the different histological parameters. Table 3 shows the histopathological evaluation of rat skin treated with SC2, SC3, SC5, and SC8 creams. Control skin did not show any sign of dermal toxicity. The animals treated with sunscreen creams showed negligible degeneration, congestion, necrosis, edema, and inflammability, indicating no considerable dermal toxic reactions. SC2 and SC3 sunscreen creams showed slight degeneration, congestion, and edema. SC5 did not show any sign of tested conditions except negligible congestion. SC8 creams showed slight degeneration, congestion, inflammation, and edema. These results demonstrated excellent dermal safety and non-toxic nature of the tested sunscreen cream.
In vivo antioxidant activity with exposure to UVR
Exposure of UVB light leads to skin damage, cellular changes, and also DNA damage.1 The deleterious effects of UVR are thought to be mediated through generation of free radicals which are scavenged by endogenous antioxidants. In the present study, we analyzed the antioxidant activity in the skin samples exposed to UVR by estimating the levels of non-enzymatic antioxidant GSH and antioxidant enzymes such as SOD and CAT. SOD and CAT are the main antioxidant enzymes present in blood or tissues, which help in transforming reactive oxygen species and reactive nitrogen species into stable compounds. GSH is a tripeptide that efficiently scavenges free radicals like hydroxyl radicals (˙HO), and lipid hydroperoxides, either directly or through GSH peroxidase enzyme for which GSH acts as a cofactor. It helps in detoxifying several inhaled oxidizing air pollutants such as ozone, NO2, and free radicals present in cigarette smoke.37,38 The restoration of SOD, CAT, and GSH levels in skin by the treatment with optimized sunscreen creams is indicative of protective mechanism against UVR.
CAT is a heme enzyme responsible for reduction of H2O2 to H2O and O2. The level of CAT decreases in oxidative stress, which indicates an imbalance between free radical generation and antioxidant system. The levels of CAT in skin of different groups were estimated and calculated with respect to total protein content within the skin (Figure 6). The average activity of CAT in normal group was found to be 0.116±0.011 units/mg of protein, which significantly (P<0.05) reduced to 0.027±0.003 units/mg of protein after UVR exposure (in UVR control group). However in SC5 and SC8 cream-treated groups, the average activity of this enzyme was found to be 0.148±0.024 and 0.168±0.020 units/mg of protein, respectively, which were significantly (P<0.05) higher than that of UVR control group. This indicates that SC5 and SC8 sunscreen creams are efficient to protect the skin against UVR exposure by elevating the endogenous CAT activity.
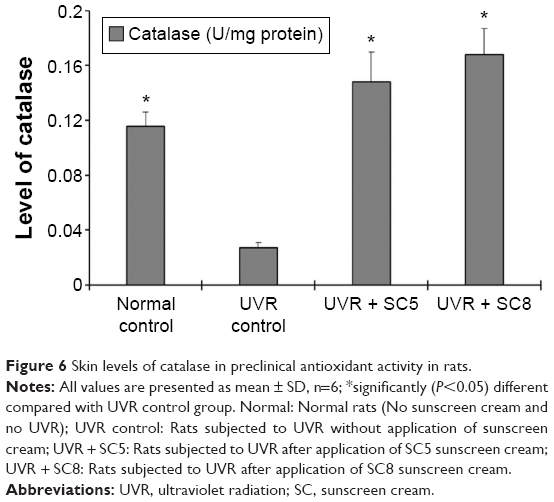 | Figure 6 Skin levels of catalase in preclinical antioxidant activity in rats. |
SOD plays an important role as a defensive mechanism against oxidative damage caused by UVR. SOD scavenges superoxide anion by increasing its dismutation. Similarly, the levels of SOD in skin of different groups of rats were estimated and calculated with respect to total protein content within the skin (Figure 7). The average activity of SOD in normal group was found to be 21.42±1.209 units/mg of protein, which was reduced to 17.51±1.149 units/mg of protein after UV exposure (in UVR control group) making the skin susceptible for oxidative damage. Whereas in SC5 and SC8 sunscreen cream-treated groups, the average concentration of SOD was found to be 26.84±1.959 and 25.42±1.799 units/mg of protein, respectively, which were significantly (P<0.05) higher than that of UVR control group. Increased level of SOD in treatment groups indicates that applied formulation has scavenged the reactive oxygen species generated upon exposure to UV irradiation. As observed in the case of CAT, the sunscreen creams were able to increase the endogenous SOD activity which could help in tackling the free radicals generated by exposure to UVR.
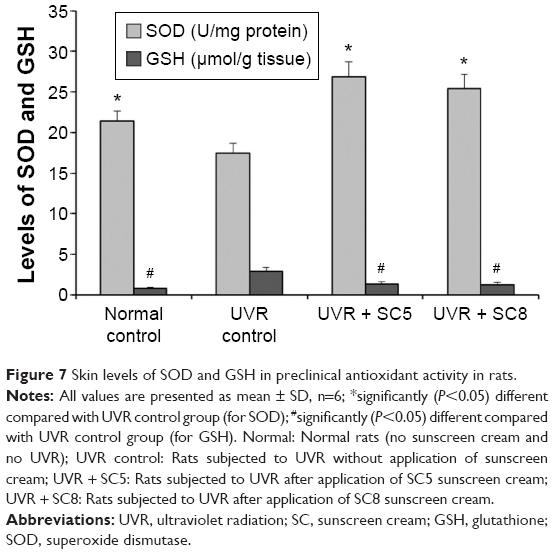 | Figure 7 Skin levels of SOD and GSH in preclinical antioxidant activity in rats. |
GSH is considered to be one of the major endogenous antioxidants produced by cells, which participate directly in neutralization of free radicals. The average concentration of GSH was found to be 0.831±0.094 μmol/g of tissue in normal group, which was found to be higher (2.942±0.460 μmol/g of tissue) in skin samples of UV-exposed rats (UVR control group). The average concentration of GSH was found to be 1.282±0.213 and 1.243±0.197 μmol/g of tissue for SC5 and SC8 creams, respectively, which were significantly (P<0.05) lower than that observed with UVR control group (Figure 7).
In the present study, we observed a decrease in the CAT and SOD activity in UVR control group in comparison with normal rats which agrees with previous reports.39 However, there was an increase in GSH level after subjecting the rats with UVR alone. It is possible that the SOD and the CAT are engaged in scavenging the free radicals generated by UV leading to their depletion; while as an immediate adaptive response, the GSH level may increase initially and decrease gradually with increase in post-irradiation interval. The increase in GSH level as an adaptive response following exposure to radiation has been demonstrated by earlier studies.40 When rats with SC5 and SC8 creams applied on the skin were exposed to UV, we observed that the GSH level was close to the control group. This may be due to the fact that the sunscreen creams act as a filter to UVR and hence minimize the absorbed dose of radiation. In addition, this phenomenon may be due to the sparing action of antioxidant morin on endogenous GSH level but not on SOD and CAT activity. The results of in vivo antioxidant activity clearly demonstrate the appreciable antioxidant activity of SC5 and SC8 sunscreen creams in skin against UVR. These results further support the observations of in vitro free radical scavenging activity.
In vivo skin permeation study
In vivo permeation study was conducted for optimized sunscreen creams (SC5 and SC8) at the application dose of 1 g for 1.33 cm2, as performed in in vitro skin permeation studies. Morin was not detected at the end of 12 hours in plasma from both SC5 and SC8 sunscreen creams. Amount of morin retained within the skin at the end of 12 hours from SC5 and SC8 sunscreen creams was 166.16±6.01 μg/cm2 and 171.21±5.01 μg/cm2, respectively (P>0.05, both values are not significantly different from each other). These skin retention values for morin observed in in vivo permeation studies were very close to those observed in in vitro skin permeation studies. This study indicates appreciable skin deposition of morin within the skin.
Like in vitro skin permeation studies, the in vivo skin permeation studies were also conducted at the actual dose of application (2 mg/cm2) of sunscreen creams. At this application dose also, morin was not detected in plasma at the end of 12 hours. However, appreciable deposition of morin was found in the skin at the end of 12 hours (346.56±12.10 ng/cm2 and 328.55±10.12 ng/cm2 from SC5 and SC8 sunscreen creams, respectively).
The in vivo skin permeation studies, supported by in vitro permeation profiles, revealed that optimized sunscreen creams are designed in such a way that morin preferentially gets deposited within the skin rather than getting permeated across the skin to receptor medium or to blood. This is the ideal property desired for the sunscreen creams containing physical sunscreen agents (TiO2 and ZnO) along with an antioxidant agent (morin) in which the antioxidant agent should be retained within the skin. The in vitro and in vivo skin permeation studies further demonstrated the usefulness of formulating polymeric NPs in sunscreen creams in order to achieve high retention for antioxidant agent (morin) within the skin.
Conclusion
Among the different sunscreen creams developed, SC5 (cream containing physical sunscreen agents and morin NPs) and SC8 (cream containing physical sunscreen agents, morin NPs, and avabenzone) creams showed favorable properties. Within the set of the skin permeation experiments conducted, the results demonstrated that optimized sunscreen creams preferentially deposit morin within the skin rather than allowing it to permeate across the skin. The sunscreen creams showed excellent SPF values and antioxidant effect. The study indicates the potential use of morin as a sunscreen agent. The results indicate that morin NPs along with physical sunscreen agents exhibit good UVR protection as well as antioxidant effects. This would be a detailed and prototype study that paves path to use nanoparticulate forms of polyphenols or other agents in sunscreen products along with physical sunscreen agents in order to get additional desirable effects for the sunscreen products besides having synergism in UVR protection property.
Acknowledgments
The authors are thankful to Manipal University, Manipal, India for providing necessary facilities. Authors express sincere thanks to Department of Biotechnology (DBT), Government of India, New Delhi for the financial assistance.
Disclosure
The authors report no conflicts of interest in this work.
References
Rai R, Srinivas C. Photoprotection. Indian J Dermatol Venereol Leprol. 2007;73(2):73. | ||
González S, Fernández-Lorente M, Gilaberte-Calzada Y. The latest on skin photoprotection. Clin Dermatol. 2008;26(6):614–626. | ||
Mishra AK, Mishra A, Chattopadhyay P. Evaluation of sun protection factor of some marketed formulations of sunscreens by ultraviolet spectroscopic method. J Curr Pharm Res. 2011;5(1):32–35. | ||
Edlich R, Winters KL, Lim HW, et al. Photoprotection by sunscreens with topical antioxidants and systemic antioxidants to reduce sun exposure. J Long Term Eff Med Implants. 2004;14(4):317–340. | ||
McArdle F, Rhodes LE, Parslew RA, et al. Effects of oral vitamin E and ß-carotene supplementation on ultraviolet radiation-induced oxidative stress in human skin. Am J Clin Nutr. 2004;80(5):1270–1275. | ||
Parrish JA, Jaenicke KF, Anderson R. Erythema and melanogenesis action spectra of normal human skin. Photochem Photobiol. 1982;36(2):187–191. | ||
Ziegler A, Jonason AS, Leffellt DJ, et al. Sunburn and p53 in the onset of skin cancer. Nature. 1994;372(6508):773–776. | ||
Bernerd F, Vioux C, Lejeune F, Asselineau D. The sun protection factor (SPF) inadequately defines broad spectrum photoprotection: demonstration using skin reconstructed in vitro exposed to UVA, UVB or UV-solar simulated radiation. Eur J Dermatol. 2003;13(3):242–249. | ||
Serpone N, Dondi D, Albini A. Inorganic and organic UV filters: their role and efficacy in sunscreens and suncare products. Inorganica Chim Acta. 2007;360(3):794–802. | ||
Kale S, Gaikwad M, Bhandare S. Determination and comparison of in vitro SPF of topical formulation containing Lutein ester from Tagetes erecta L. flowers, Moringa oleifera. Int J Res Pharm Biomed Sci. 2011;2(3):1220–1224. | ||
Lin C-C, Lin W-J. Sun protection factor analysis of sunscreens containing titanium dioxide nanoparticles. J Food Drug Anal. 2011;19(1):1–8. | ||
Newman MD, Stotland M, Ellis JI. The safety of nanosized particles in titanium dioxide–and zinc oxide-based sunscreens. J Am Acad Dermatol. 2009;61(4):685–692. | ||
Smijs TG, Pavel S. Titanium dioxide and zinc oxide nanoparticles in sunscreens: focus on their safety and effectiveness. Nanotechnol Sci Appl. 2011;4:95–112. | ||
Jain S, Mittal A, Jain AK. Enhanced topical delivery of cyclosporin-A using PLGA nanoparticles as carrier. Curr Nanosci. 2011;7(4):524–530. | ||
Tomoda K, Terashima H, Suzuki K, Inagi T, Terada H, Makino K. Enhanced transdermal delivery of indomethacin-loaded PLGA nanoparticles by iontophoresis. Colloids Surf B Biointerfaces. 2011;88(2):706–710. | ||
Torbica S, Vuleta G, Ignjatović N, Uskoković D. Polymeric nanoparticles: carriers for transdermal drug delivery. Tehnika-Novi Materijali. 2009;18(4):1–14. | ||
Gulbake A, Jain A, Khare P, Jain SK. Solid lipid nanoparticles bearing oxybenzone: in-vitro and in-vivo evaluation. J Microencapsul. 2010;27(3):226–233. | ||
Nesseem D. Formulation of sunscreens with enhancement sun protection factor response based on solid lipid nanoparticles. Int J Cosmet Sci. 2011;33(1):70–79. | ||
Fathi-Azarbayjani A, Tan PL, Chan YY, Chan SY. Ascorbic acid for the safe use of a sunscreen agent: accumulation of nano zinc oxide and titanium dioxide on the skin. Sci Pharm. 2013;81(4):1141–1150. | ||
Senzui M, Tamura T, Miura K, Ikarashi Y, Watanabe Y, Fujii M. Study on penetration of titanium dioxide (TiO2) nanoparticles into intact and damaged skin in vitro. J Toxicol Sci. 2010;35(1):107–113. | ||
Golmohammadzadeh S, Imani F, Hosseinzadeh H, Jaafari MR. Preparation, characterization and evaluation of sun protective and moisturizing effects of nanoliposomes containing safranal. Iran J Basic Med Sci. 2011;14(6):521–533. | ||
Kitagawa S, Tanaka Y, Tanaka M, Endo K, Yoshii A. Enhanced skin delivery of quercetin by microemulsion. J Pharm Pharmacol. 2009;61(7):855–860. | ||
Velasco MVR, Sarruf FD, Salgado-Santos IMN, Haroutiounian-Filho CA, Kaneko TM, Baby AR. Broad spectrum bioactive sunscreens. Int J Pharm. 2008;363(1):50–57. | ||
Wu T-W, Zeng L, Wu J, Fung K. Morin hydrate is a plant-derived and antioxidant-based hepatoprotector. Life Sci. 1993;53(13):PL213–PL218. | ||
Waddad AY, Abbad S, Yu F, et al. Formulation, characterization and pharmacokinetics of Morin hydrate niosomes prepared from various non-ionic surfactants. Int J Pharm. 2013;456(2):446–458. | ||
Zhang J, Peng Q, Shi S, et al. Preparation, characterization, and in vivo evaluation of a self-nanoemulsifying drug delivery system (SNEDDS) loaded with morin-phospholipid complex. Int J Nanomed. 2011;6:3405. | ||
Gaspar MM, Blanco D, Cruz MEM, Alonso MJ. Formulation of L-asparaginase-loaded poly (lactide-co-glycolide) nanoparticles: influence of polymer properties on enzyme loading, activity and in vitro release. J Control Rel. 1998;52(1):53–62. | ||
Zambaux M, Bonneaux F, Gref R, et al. Influence of experimental parameters on the characteristics of poly (lactic acid) nanoparticles prepared by a double emulsion method. J Control Rel. 1998;50(1):31–40. | ||
Narla RS, Rao M. Scavenging of free-radicals and inhibition of lipid peroxidation by 3-phenylsydnone. J Pharm Pharmacol. 1995;47(8):623–625. | ||
Purushothamrao K, Khaliq K, Sagare P, Patil S, Kharat S, Alpana K. Formulation and evaluation of vanishing cream for scalp psoriasis. Int J Pharm Sci Tech. 2010;4(1):33–41. | ||
Parija S, Sahoo AC, Sundeep Kumar H, Mishra B. Formulation development and evaluation of triple combination cream of hydroquinone, tretinoin and mometasone furoate for the treatment of skin disorders. Int J Pharm Ind Res. 2012;2:2231–3468. | ||
Saraf S, Kaur C. Phytoconstituents as photoprotective novel cosmetic formulations. Pharmacogn Rev. 2010;4(7):1–11. | ||
Kale S, Kavade E, Yadav A. Formulation and in-vitro evaluation for sun protection factor of Crinum asiaticum Linn flower (Family-Amaryllidaceae) extract sunscreen creams. Indian J Pharm Edu Res. 2012;46(2):112–119. | ||
Denizot F, Lang R. Rapid colorimetric assay for cell growth and survival: modifications to the tetrazolium dye procedure giving improved sensitivity and reliability. J Immunol Methods. 1986;89(2):271–277. | ||
Mosmann T. Rapid colorimetric assay for cellular growth and survival: application to proliferation and cytotoxicity assays. J Immunol Methods. 1983;65(1):55–63. | ||
Panus PC, Campbell J, Kulkarni SB, Herrick RT, Ravis WR, Banga AK. Transdermal iontophoretic delivery of ketoprofen through human cadaver skin and in humans. J Control Rel. 1997;44(2):113–121. | ||
Jagetia GC, Rajanikant G, Rao SK, Baliga MS. Alteration in the glutathione, glutathione peroxidase, superoxide dismutase and lipid peroxidation by ascorbic acid in the skin of mice exposed to fractionated γ radiation. Clin Chim Acta. 2003;332(1):111–121. | ||
Jagetia GC, Venkatesha V, Reddy TK. Naringin, a citrus flavonone, protects against radiation-induced chromosome damage in mouse bone marrow. Mutagenesis. 2003;18(4):337–343. | ||
Madhavan V, Shah P, Murali A, Yoganarasimhan S. In vitro and in vivo antioxidant activity studies on the roots of Toddalia asiatica (L.) Lam.(Rutaceae). Asian J Tradit Med. 2010;5(5):188–198. | ||
Kumar D, Salian SR, Kalthur G, et al. Association between sperm DNA integrity and seminal plasma antioxidant levels in health workers occupationally exposed to ionizing radiation. Environ Res. 2014;132:297–304. | ||
Jassim ZE, Hussein AA. Formulation and evaluation of clopidogrel tablet incorporating drug nanoparticles. Int J Pharm Pharm Sci. 2014;6:838–851. | ||
Kotikalapudi LS, Adepu L, VijayaRatna J, Diwan PV. Formulation and in vitro characterization of domperidone loaded solid lipid nanoparticles. Int J Pharm. 2012;3(1):22–29. | ||
Mutalik S, Anju P, Manoj K, Usha AN. Enhancement of dissolution rate and bioavailability of aceclofenac: a chitosan-based solvent change approach. Int J Pharm. 2008;350(1):279–290. | ||
Shim J, Kang HS, Park W-S, Han S-H, Kim J, Chang I-S. Transdermal delivery of mixnoxidil with block copolymer nanoparticles. J Control Rel. 2004;97(3):477–484. | ||
Qi L, Xu Z, Jiang X, Hu C, Zou X. Preparation and antibacterial activity of chitosan nanoparticles. Carbohydr Res. 2004;339(16):2693–2700. | ||
Bennet D, Kim S. A transdermal delivery system to enhance quercetin nanoparticle permeability. J Biomater Sci Polym Ed. 2013;24(2):185–209. | ||
Deshmukh K, Amin P. Formulation and evaluation of solid–lipid nanoparticle based 0.1% Soy isoflavone dermal gels. J Pharm BioSci. 2013;1:7–18. | ||
Wissing S, Müller R. The development of an improved carrier system for sunscreen formulations based on crystalline lipid nanoparticles. Int J Pharm. 2002;242(1):373–375. | ||
Ghanbarzadeh S, Arami S. Enhanced transdermal delivery of diclofenac sodium via conventional liposomes, ethosomes, and transfersomes. BioMed Res Int. 2013;2013. | ||
Sarkar BK, Maharshi A, Baniwal A, Kumar S, Sachan M. Formulation and characterization of quercetin transfersome for transdermal delivery. Int J Pharm Med Sci. 2012;1(1):28–38. | ||
Sheo D, Shweta A, Vijay K, Ram C, Aklavya S, Ghanshyam M. Enhanced Transdermal delivery of indinavir sulfate via transfersomes. Pharm Globale (IJCP). 2010;1(06):1–7. | ||
Lademann J, Richter H. Hair follicles-a long-term reservoir for drug delivery. Skin Pharmacol Appl Skin Physiol. 2006;19:232–236. | ||
Cevc G, Vierl U. Nanotechnology and the transdermal route. A state of the art review and critical appraisal. J Control Release. 2009;141:277–299. | ||
Desai P, Patlolla RR, Singh M. Interaction of nanoparticles and cell-penetrating peptides with skin for transdermal drug delivery. Mol Membr Biol. 2010;27(7):247–259. | ||
Touitou E, Godin B. Skin nonpenetrating sunscreens for cosmetic and pharmaceutical formulations. Clin Dermatol. 2008;26(4):375–379. | ||
Godin B, Touitou E. Transdermal skin delivery: predictions for humans from in vivo, ex vivo and animal models. Adv Drug Deliv Rev. 2007;59(11):1152–1161. | ||
Mutalik S, Udupa N. Formulation development, in vitro and in vivo evaluation of membrane controlled transdermal systems of glibenclamide. J Pharm Pharm Sci. 2005;8(1):26–38. |
 © 2015 The Author(s). This work is published and licensed by Dove Medical Press Limited. The
full terms of this license are available at https://www.dovepress.com/terms
and incorporate the Creative Commons Attribution
- Non Commercial (unported, 3.0) License.
By accessing the work you hereby accept the Terms. Non-commercial uses of the work are permitted
without any further permission from Dove Medical Press Limited, provided the work is properly
attributed. For permission for commercial use of this work, please see paragraphs 4.2 and 5 of our Terms.
© 2015 The Author(s). This work is published and licensed by Dove Medical Press Limited. The
full terms of this license are available at https://www.dovepress.com/terms
and incorporate the Creative Commons Attribution
- Non Commercial (unported, 3.0) License.
By accessing the work you hereby accept the Terms. Non-commercial uses of the work are permitted
without any further permission from Dove Medical Press Limited, provided the work is properly
attributed. For permission for commercial use of this work, please see paragraphs 4.2 and 5 of our Terms.