Back to Journals » Infection and Drug Resistance » Volume 19
Development and Clinical Evaluation of an LC-MS/MS Method for the Determination of Isoniazid in Cerebrospinal Fluid from Tuberculous Meningitis
Authors Xin M ![]() , Liang J, Lin M, Wang X, Hou W, Zhong L, Ma X, Ji X
, Liang J, Lin M, Wang X, Hou W, Zhong L, Ma X, Ji X
Received 7 November 2025
Accepted for publication 17 February 2026
Published 26 February 2026 Volume 2026:19 579844
DOI https://doi.org/10.2147/IDR.S579844
Checked for plagiarism Yes
Review by Single anonymous peer review
Peer reviewer comments 2
Editor who approved publication: Dr Hazrat Bilal
Mingming Xin,1,* Jiabin Liang,2,* Minggui Lin,1 Xiaohui Wang,1 Wenjing Hou,1 Leping Zhong,1 Xuzhu Ma,1 Xiwei Ji2
1Department of Infectious Diseases, Beijing Tsinghua Changgung Hospital, School of Clinical Medicine, Tsinghua Medicine, Tsinghua University, Beijing, People’s Republic of China; 2Institute of Clinical Pharmacology, Peking University First Hospital, Beijing, People’s Republic of China
*These authors contributed equally to this work
Correspondence: Xuzhu Ma, Department of Infectious Diseases, Beijing Tsinghua Changgung Hospital, School of Clinical Medicine, Tsinghua Medicine, Tsinghua University, Beijing, People’s Republic of China, Email [email protected] Xiwei Ji, Institute of Clinical Pharmacology, Peking University First Hospital, Beijing, People’s Republic of China, Email [email protected]
Purpose: Isoniazid (INH), a first-line anti-tuberculosis agent, exhibits variable cerebrospinal fluid (CSF) penetration owing to NAT2 genetic polymorphisms. This study developed an LC–MS/MS method to quantify INH in the human CSF for therapeutic drug monitoring in patients with tuberculous meningitis.
Methods: The LC-MS/MS method developed and validated in this study includes linearity, sensitivity, accuracy, precision, extraction recovery, matrix effect, and stability evaluations, all of which meet the standards for bioanalytical method validation. This method was applied to a real-world prospective observational study to compare CSF trough concentrations of INH between patients receiving conventional anti-tuberculosis therapy and those receiving conventional therapy combined with intrathecal INH injection, and a pharmacokinetic study was conducted in one TBM patient.
Results: The validated LC‑MS/MS method achieved a total run time of 3.5 min, demonstrated linearity over the range of 5– 4000 ng/mL, and had an LLOQ of 5 ng/mL, with all validation parameters meeting acceptance criteria. In the clinical cohort, the median CSF trough concentration of INH was significantly higher in the intrathecal therapy group (1130.00 ng/mL, N=117) than in the conventional therapy group (155.00 ng/mL, N=45, P< 0.001). Target attainment rates at ≥ 120 ng/mL and ≥ 250 ng/mL were also significantly greater in the intrathecal group (84.62% and 77.78%, respectively) versus the conventional group (57.78% and 35.56%, both P< 0.001). Pharmacokinetic analysis in a TBM patient after intrathecal INH administration revealed a Tmₐₓ of 6 h, Cmₐₓ of 2810 ng/mL, and an elimination half‑life of approximately 14 h.
Conclusion: A sensitive and reliable LC-MS/MS method was successfully developed and validated for quantification of INH in human CSF. This study confirms that intrathecal administration of INH can significantly increase drug concentrations in the CSF of TBM patients, providing methodological support and preliminary clinical evidence for optimizing treatment strategies in TBM.
Keywords: LC-MS/MS, isoniazid, cerebrospinal fluid, tuberculous meningitis
Introduction
Tuberculous meningitis (TBM) is a non-purulent meningitis caused by Mycobacterium tuberculosis (MTB) infection, accounting for only 1% of all tuberculosis cases; however, its mortality rate can reach 27%, with poor prognosis, making it the most fatal form of tuberculosis and posing a serious impact on global public health.1 Furthermore, an estimated 23% of global adult TBM incidence occurred in people with HIV.2 In recent years, factors such as population mobility, increasing MTB drug resistance, and rising HIV incidence have contributed to a growing prevalence of TBM.3
Isoniazid (INH) is a first-line drug for the treatment of TBM.4 Its pharmacokinetics in the blood are significantly influenced by the activity of hepatic N-acetyltransferase 2 (NAT2), which exhibits considerable interindividual variability. Although INH exhibits good blood‑brain barrier permeability, variability in NAT2 activity may result in suboptimal systemic drug exposure following intravenous or oral administration, which in turn can limit INH concentrations in the cerebrospinal fluid (CSF) below therapeutic levels and undermine TBM treatment efficacy.5 Monitoring INH concentrations in CSF and developing personalized dosing regimens are therefore critically important.
Liquid chromatography-tandem mass spectrometry (LC-MS/MS) is widely used for therapeutic drug monitoring (TDM) due to its high sensitivity, excellent specificity, straightforward method development, and low detection costs.6 In this study, we developed a LC-MS/MS method for determination of INH in human CSF, which was characterized by a rapid sample pre-preparation procedure, a simple component of mobile phase, high sensitivity and short elution time. This method is applied in a real-world prospective observational study aimed at comparing the effects of different INH dosing regimens on CSF drug concentrations. By measuring INH trough levels in CSF, it analyzes differences in target attainment rates among various dosing strategies to guide clinical treatment.
Materials and Methods
Clinical Data
Patient Inclusion and Exclusion Criteria
Inclusion Criteria: Patients clinically diagnosed with TBM. Diagnostic principles include: ① Positive conventional microbiological culture for MTB or positive nucleic acid amplification test; ② In the absence of etiological diagnosis, a scoring diagnosis is performed based on clinical symptoms combined with CSF laboratory tests and imaging findings.7 No restrictions on gender, age, ethnicity, or personal history.
Exclusion Criteria: ① Patients with other concurrent central nervous system infections or tumors; ② HIV‑positive patients.
Baseline Indicators
Age, sex, disease severity (TBM grade), baseline CSF parameters, hepatic and renal function, nutritional status, treatment history, and underlying diseases. TBM severity is graded according to the British Medical Research Council criteria: Grade I, Alert, oriented, with no focal neurological deficits; Grade II, Glasgow Coma Scale (GCS) 10–14, with or without focal neurological deficits, or GCS 15 with focal neurological deficits; Grade III, GCS <10, with or without focal neurological deficits.8,9
Interventions
Enrolled patients received conventional anti‑tuberculosis therapy including INH via oral or intravenous routes, with treatment duration lasting at least until the study endpoint. The intrathecal treatment group received INH 50 mg or 100 mg plus dexamethasone 2 mg, administered 2–3 times per week. Patients receiving conventional anti‑TB therapy without intrathecal injection served as the control group. All the participants provided written informed consent.
CSF Sample Collection
Control group: 1–2 mL of CSF was collected during routine CSF examination. Intrathecal injection group: 1–2 mL of CSF was collected immediately before the next scheduled intrathecal injection for measurement of INH trough concentration. For patients requiring external ventricular drainage, 100 mg INH was administered intrathecally. CSF samples from the ventricular drain were collected at 0 h (pre‑dose) and at 5 min, 10 min, 30 min, 1 h, 2 h, 6 h, 12 h, and 48 h post‑dose. All CSF samples were centrifuged, and the supernatant was stored at –80 °C.
Drug Concentration Evaluation Criteria
Based on the Clinical and Laboratory Standards Institute (CLSI) 2023 second‑edition standard “Susceptibility Testing of Mycobacteria, Nocardia spp., and Other Aerobic Actinomycetes”, INH interpretive breakpoints are as follows: sensitive (≥120 ng/mL), resistant (≥250 ng/mL).10
Drugs and Reagents
INH (chemical purity 99.9%) and deuterated isoniazid (D4-INH; isotopic abundance ≥ 99%, chemical purity 98.7%) were obtained from Alta Scientific Co., Ltd. (Tianjin, China). D4-INH was used as the internal standard (IS). The mobile phases were prepared using ammonium acetate, acetonitrile, and water. The reagents used included ammonium acetate (C2H7NO2, purity 99.99%, Shanghai Macklin Biochemical Technology Co., Ltd.), acetonitrile (C2H3N, Optima® LC/MS grade, Fisher Scientific), and methanol (CH4O, chromatographic grade, Fisher Chemical), all meeting analytical requirements with clearly labeled batch numbers and specifications.
Instrument
LC-MS/MS was used for sample detection. HPLC (SHIMADZU LC-20AD) system consisted of a degasser, binary pump, and autosampler. Electrospray Ionization mass spectrometry (ESI-MS) was performed using an API QTRAP 5500 mass spectrometer (Applied Biosystems Inc., USA). A reverse-phase Agilent Eclipse Plus C18 column (50 mm×4.6 mm, 3.5 μm) was used to separate the chemical ingredients. The instruments used in the experiment included an analytical balance (Mettler, XS105DU), a water purification system (Milli-Q Integral 5, Merck Millipore), and a refrigerated centrifuge (Sigma Laborzentrifugen, ST16R), all of which met the experimental and precision requirements.
Preparation of Stock and Working Solutions
Standard stock solutions of INH and IS were prepared in methanol: water (50:50, v/v) at 1.0 mg/mL. All stocks were stored at 4 °C. Calibration standards for INH (0.1–80 μg/mL) were prepared by serial dilution of the stock solution in methanol:water (50:50, v/v). The IS working solution (4 μg/mL) was obtained by diluting 4 μL of IS stock with 996 μL of methanol:water (50:50, v/v).
Preparation of Standard and Quality Control Samples
Calibration standards, with nominal CSF concentrations of 0, 5, 10, 50, 250, 500, 1000, 2000, and 4000 ng/mL, were prepared by adding 10 μL of working solution and 10 μL of IS (4 μg/mL) to 190 μL of blank cerebrospinal fluid. Quality control (QC) samples were prepared in the same manner at CSF concentrations of 15 ng/mL (low), 800 ng/mL (medium) and 3200 ng/mL (low, medium, and high, respectively).
Sample Preparation
This part of the study employed a one-step acetonitrile-mediated protein precipitation method for sample pretreatment.11 Samples stored at −80 °C were thawed at 4 °C. 10 μL of IS (4 μg/mL) were added to 200 μL of CSF samples. After vortexing for 30s, 600 μL of acetonitrile was added to the mixture to precipitate the protein. Then The samples were vortex-mixed for 3 min and centrifuged at 16200×g for 10 min at 4 °C. The supernatant was collected and an aliquot (5 μL) was injected into the LC-MS/MS system for immediate analysis.
Method Validation
FDA guidance for bioanalytical method validation was used in this study (FDA, 2022).12 QC samples (n=6) at concentrations of 15, 800, and 3200 ng/mL were used to validate the method in terms of precision, accuracy, recovery, matrix effects, and stability. The acceptance criteria of their Relative Standard Deviation (RSD) were within ±15% (except for the lowest standard and low-concentration QC samples, for which the RSD value was within ±20%).
Specificity
Specificity was tested by analyzing five different blank human CSF samples to ensure the absence of endogenous compounds with the same retention times as INH and the IS.
Linearity and Sample Quantification
Calibration standards were prepared and analyzed in triplicate to establish a calibration curve ranging from 5 to 4000 ng/mL. In addition, linearity was zero. Standards were processed with samples simultaneously but assayed ahead. The QCs were run along the samples. The peak area ratio of INH to IS was plotted against the concentration. The curves were fitted by least-squares linear regression using a weighting factor of 1/x2. The INH concentrations in the samples were calculated from calibration curves.
Lower Limit of Quantification
Sensitivity was defined as the lower limit of quantification (LLOQ), which represents the lowest calibration standard yielding a signal-to-noise ratio of ≥ 10, with accuracy and precision within ±20% and ≤20%, respectively.
Precision and Accuracy
The intra-day precision and accuracy of the method were evaluated in six replicates at three concentrations (15, 800, and 3200 ng/mL) on the same day. The inter-day precision and accuracy were measured by analyzing a set of samples (n=6) at three levels on three consecutive days. Precision was evaluated as RSD, and accuracy was expressed as relative error (RE).
Recovery and Matrix Effect
The extraction recovery of INH was determined by comparing the peak areas obtained from the extracted samples of blank CSF spiked with known amounts of the standard to those of the standard working solutions. Experiments were performed at three QC concentrations in six replicates.
The matrix effect was evaluated to determine whether the endogenous matrix components in the CSF samples suppressed or enhanced analyte response. It was evaluated by comparing the peak areas obtained from the mixture (INH final concentration of three QC levels) of the extract of precipitated blank CSF with known amounts of standard to those of the standard working solutions. The experiments were performed with six replicates.
Stability
Stability of INH in human CSF samples was evaluated under the following conditions: QC samples were stored at −80 °C for 36 days, in three daily freeze–thaw cycles at −20 °C; stored at 4 °C for 24 h, and stored at room temperature for 4 h. Experiments were performed at three different concentrations (15, 800, and 3200 ng/mL) in six replicates.
Effect of Dilution
The effect of dilution was investigated by diluting the samples at a concentration of 7000 ng/mL INH by 2-fold with blank human CSF, resulting in a final CSF concentration of INH (3500 ng/mL) within the range of the standard curve. The analysis was performed six times using calibration curves.
Statistical Methods
Patient baseline characteristics were summarized as follows: continuous variables are presented as median (range), with between‑group comparisons performed using the Kruskal‑Wallis H-test; categorical variables are presented as counts, with between‑group comparisons conducted using Fisher’s exact test.
For the statistical analysis of INH concentrations in CSF, continuous variables (drug concentrations) were not normally distributed and are described as median with the 25th and 75th percentiles (P25, P75). Categorical variables (attainment rates of concentration thresholds) are expressed as frequency (N) and percentage (%). Comparisons of concentration medians were performed using the Kruskal‑Wallis test, followed by a linear mixed‑effects model to adjust for clustering effects resulting from multiple measurements per subject. Comparisons of attainment rates among different experimental groups were made using the χ2-test or Fisher’s exact test, with within‑subject repeated measurements adjusted using generalized estimating equations (GEE).
All analyses were conducted using SPSS 29.0 statistical software. Pharmacokinetic analyses were performed using GraphPad Prism 10 software.
Results
Baseline Characteristics of the Study Population
This study enrolled 34 patients (162 cerebrospinal fluid samples) clinically diagnosed with TBM in the Department of Infectious Diseases, Beijing Tsinghua Changgung Hospital, from April 2024 to September 2025. Among them, 16 patients (45 CSF samples) were assigned to the control group and 18 patients (117 CSF samples) to the experimental group. No statistically significant differences were observed in clinical baseline characteristics between the two groups (P > 0.05), indicating that the baseline profiles were balanced and comparable (Table 1).
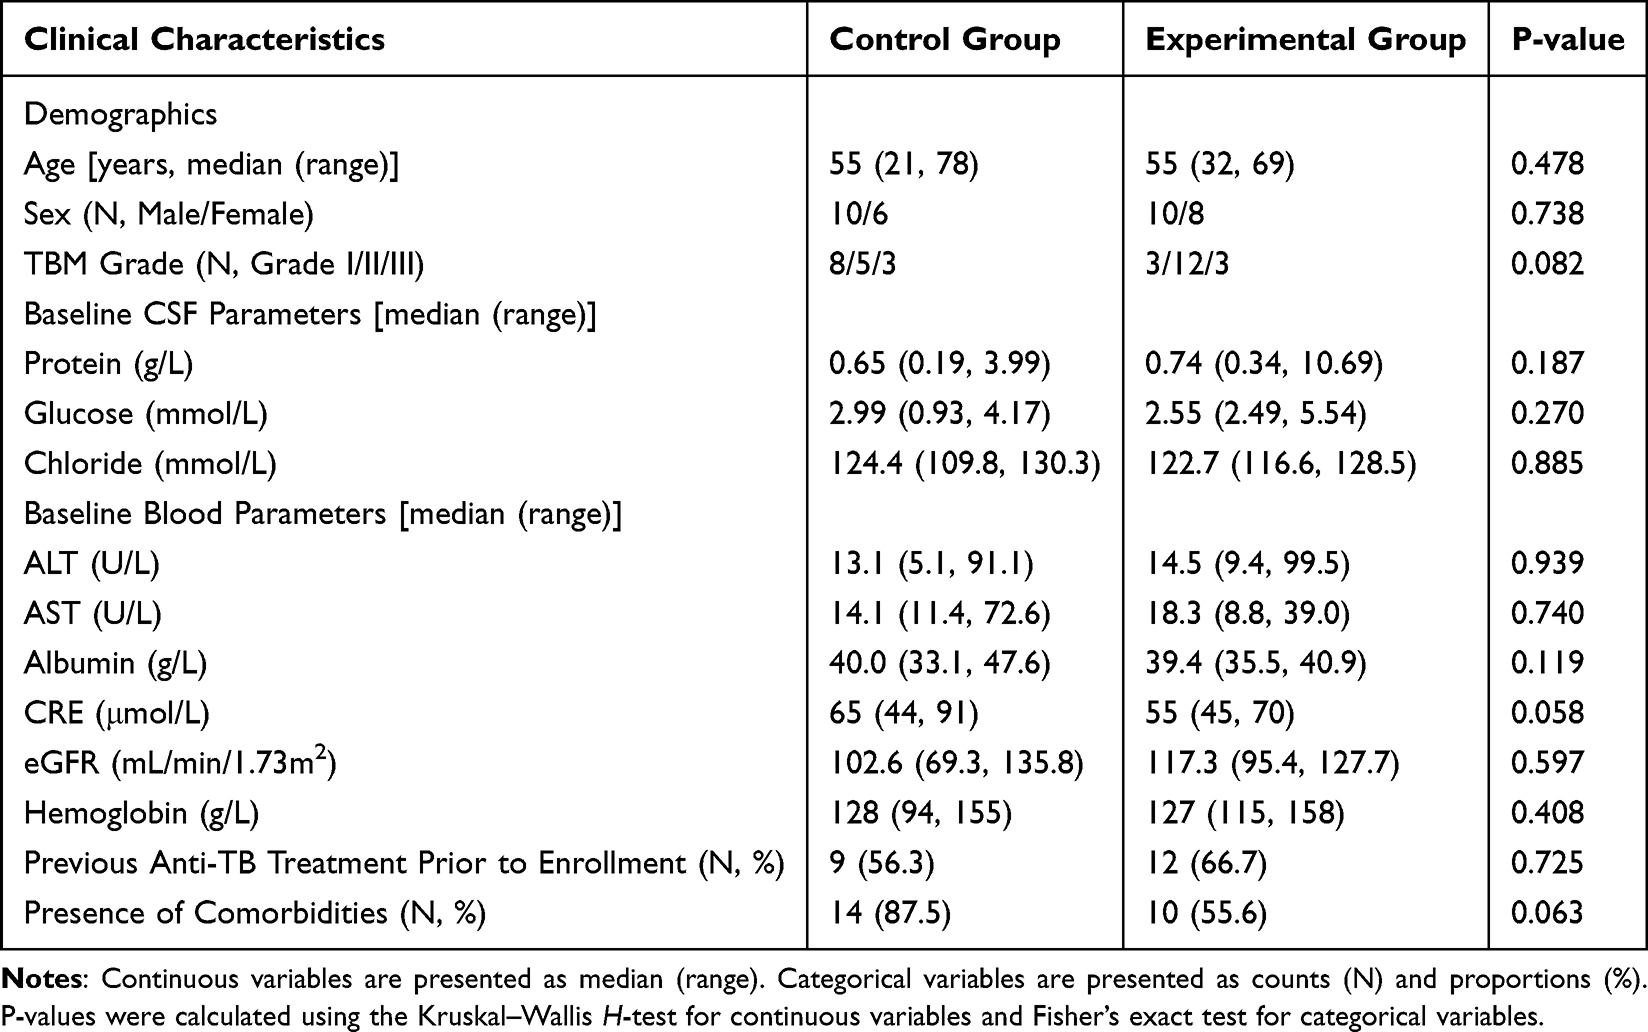 |
Table 1 Baseline Characteristics of Enrolled Patients |
LC-MS/MS Conditions
HPLC Condition
Chromatographic separation was achieved using a gradient elution system with mobile phases A (acetonitrile) and B (10 mM ammonium acetate in water) at a constant flow rate of 0.5 mL/min. The gradient program was set as follows: 10% A was maintained from 0 to 1.0 min; linearly increased to 90% A between 1.0 and 1.2 min; held at 90% A for 2.0 min; linearly decreased to 10% A from 2.0 to 2.5 min; and re-equilibrated at 10% A for 3.5 min. All solvent ratios are expressed as volume-to-volume (v/v). The autosampler temperature was maintained at 4°C and samples were protected from light throughout the analysis. An injection volume of 5 μL was used for all the samples.
MS/MS Condition
The analysis was performed in multiple reaction monitoring (MRM) mode. The optimized mass spectrometric parameters were set as follows: electrospray ionization (ESI) in positive ion mode, curtain gas (CUR) at 40 psi, collision gas (CAD) at medium level, ion source gas 1 (Gas 1) at 20 psi, ion source gas 2 (Gas 2) at 20 psi, ion spray voltage (IS) at 5500 V, and source temperature (TEM) at 500°C. The MRM transitions were monitored at m/z 138.0 → 121.0 for INH and m/z 142.0 → 125.0 °for D4-INH (Figure 1).
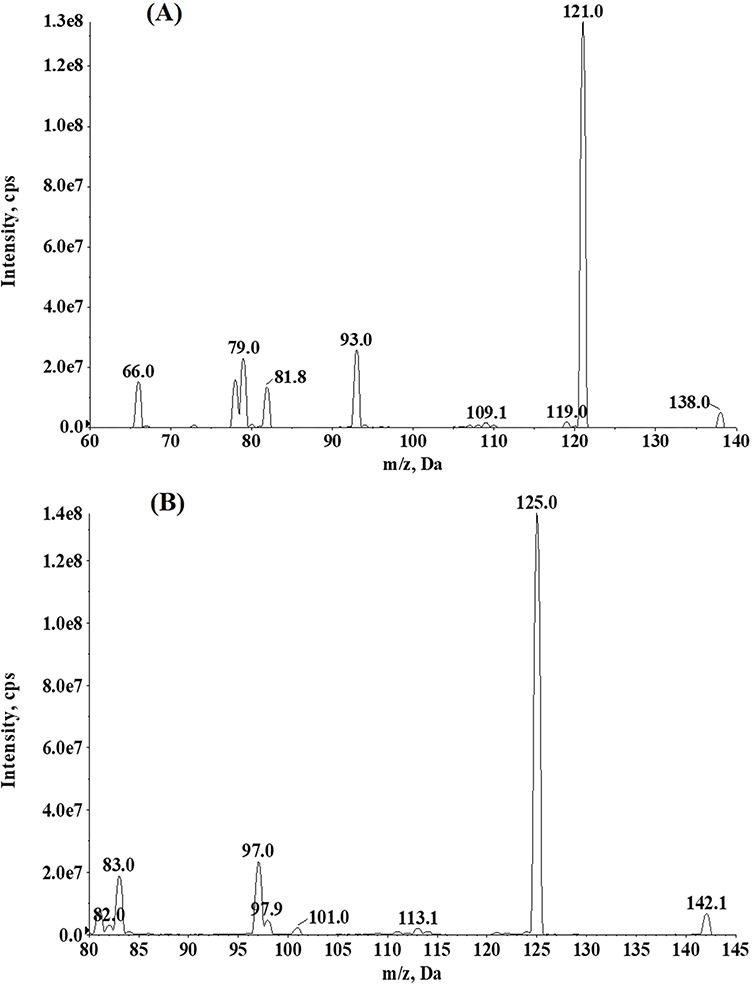 |
Figure 1 (A) Representative ion spectra showing the precursor (138.0 m/z) and fragment ions of INH. (B) Representative ion spectra showing the precursor (142.0 m/z) and fragment ions of IS. |
Method Validation Results
Specificity
The MRM chromatogram for the detection of INH in CSF (Figure 2) shows that both INH and IS exhibited a retention time of 1.18 min, with a total run time of 3.5 min. No endogenous interference was observed at the retention times of INH and IS. Analysis of a clinical CSF sample revealed an INH concentration of 6.74 ng/mL, with chromatographic peak shapes consistent with those of the standard solution and comparable IS peak intensity. These results demonstrate the good specificity of the method, supporting its applicability for the clinical determination of INH concentrations in CSF.
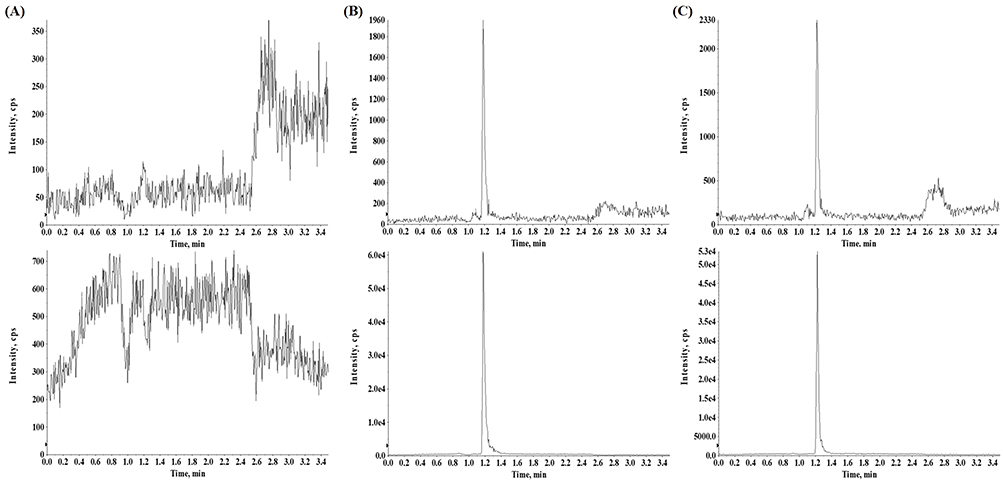 |
Figure 2 (A) MRM chromatograms from blank CSF; (B) solution containing 5 ng/mL for INH and 200 ng/mL for IS; (C) clinical sample containing 6.74 ng/mL for INH collected after intrathecal injection of INH at a dose of 100 mg. |
Linearity and LLOQ
The method exhibited linearity within the concentration range of 5–4000 ng/mL. The calibration curve was analyzed in a CSF matrix on three consecutive days, yielding an average correlation coefficient (r) of 0.9967 ± 0.001418 across the three runs, demonstrating stable and reliable linearity (Table 2). LLOQ was 5 ng/mL, with accuracy (RE) and precision (RSD) of 6.70% and 5.29%, respectively, indicating that the method is highly sensitive, accurate, and suitable for the determination of INH in human CSF.
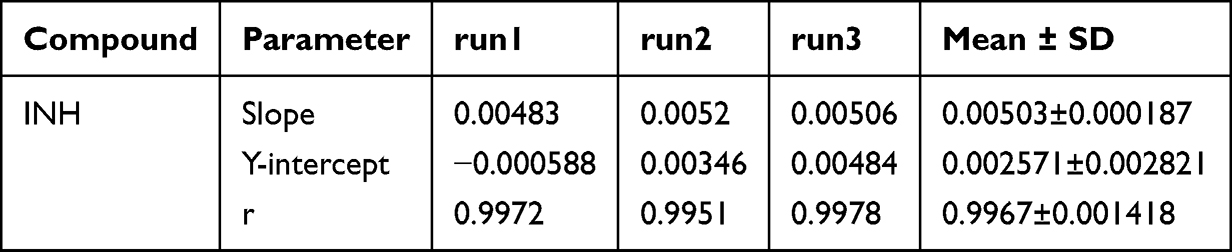 |
Table 2 Calibration Curves of INH in Three Runs |
Accuracy and Precision
The accuracy and precision of the method were evaluated at three QC concentration levels (15.00, 800.00, and 3200.00 ng/mL). The inter‑run relative standard deviation (Inter‑RSD) ranged from 0.95% to 12.78%, intra‑run RSD (Intra‑RSD) ranged from 5.48% to 9.15%, and the relative error (RE) ranged from -5.76 to 1.74% (Table 3). All results met the predefined acceptance criteria for bioanalytical method validation, demonstrating that the method has good reproducibility and accuracy, and meets the reliability requirements for quantitative analysis of INH in cerebrospinal fluid.
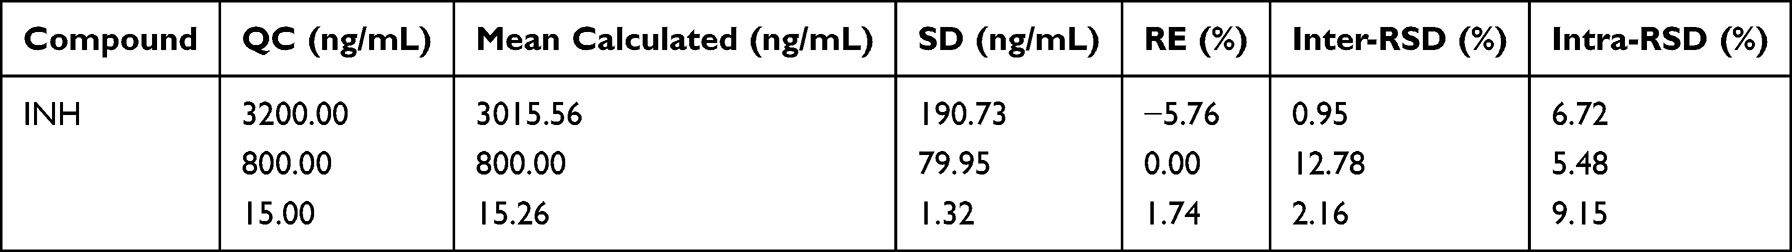 |
Table 3 Inter- and Intra-Day Precision (RSD) and Accuracy (RE) of INH (n=6) |
Matrix Effect and Recovery
The extraction recovery of INH was evaluated at three QC concentration levels (15.00, 800.00, and 3200.00 ng/mL). The results showed recoveries of 100.00 ± 8.15%, 93.16 ± 7.62%, and 104.74 ± 7.62%, respectively. The recovery rates at each concentration level were close to 100% with small coefficients of variation, indicating that the sample pretreatment method was stable and reliable. The matrix effect was assessed and found to range from 97.43% to 105.04%, which is close to 100% and exhibited no significant fluctuation. This suggests that the CSF matrix did not cause obvious interference with the ionization process of INH, and that the method effectively eliminates the impact of matrix effects, thereby ensuring the accuracy and reliability of the quantitative results (Table 4).
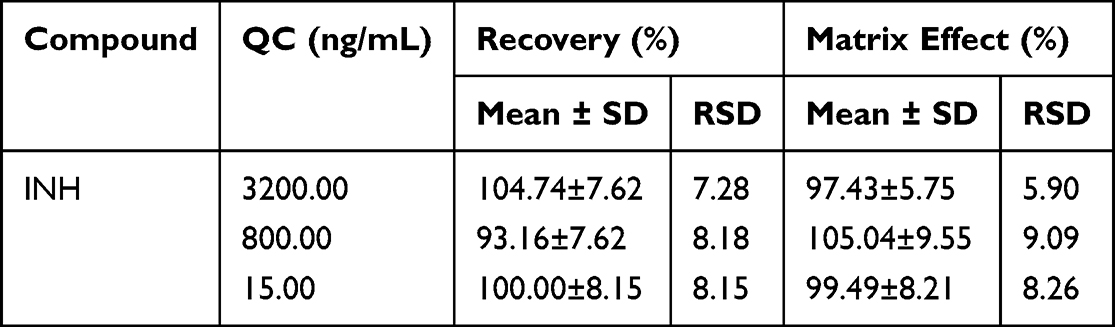 |
Table 4 Matrix Effect and Recovery of INH (n=6) |
Stability
A comprehensive stability evaluation of INH in CSF was conducted under various storage and processing conditions, including 4 h at room temperature, 36 days at –80 °C, 24 h at 4 °C, and three freeze‑thaw cycles. The results showed that the accuracy (RE) of QC samples at low, medium, and high concentration levels ranged from –12.46% to 10.47%, and the precision (RSD) was within 15% under all tested conditions (Table 5). These findings indicate that INH remains stable under the described conditions, meeting the quality requirements for the entire process of clinical sample collection, transportation, storage, and analytical testing, thereby ensuring accurate and reliable measurement results.
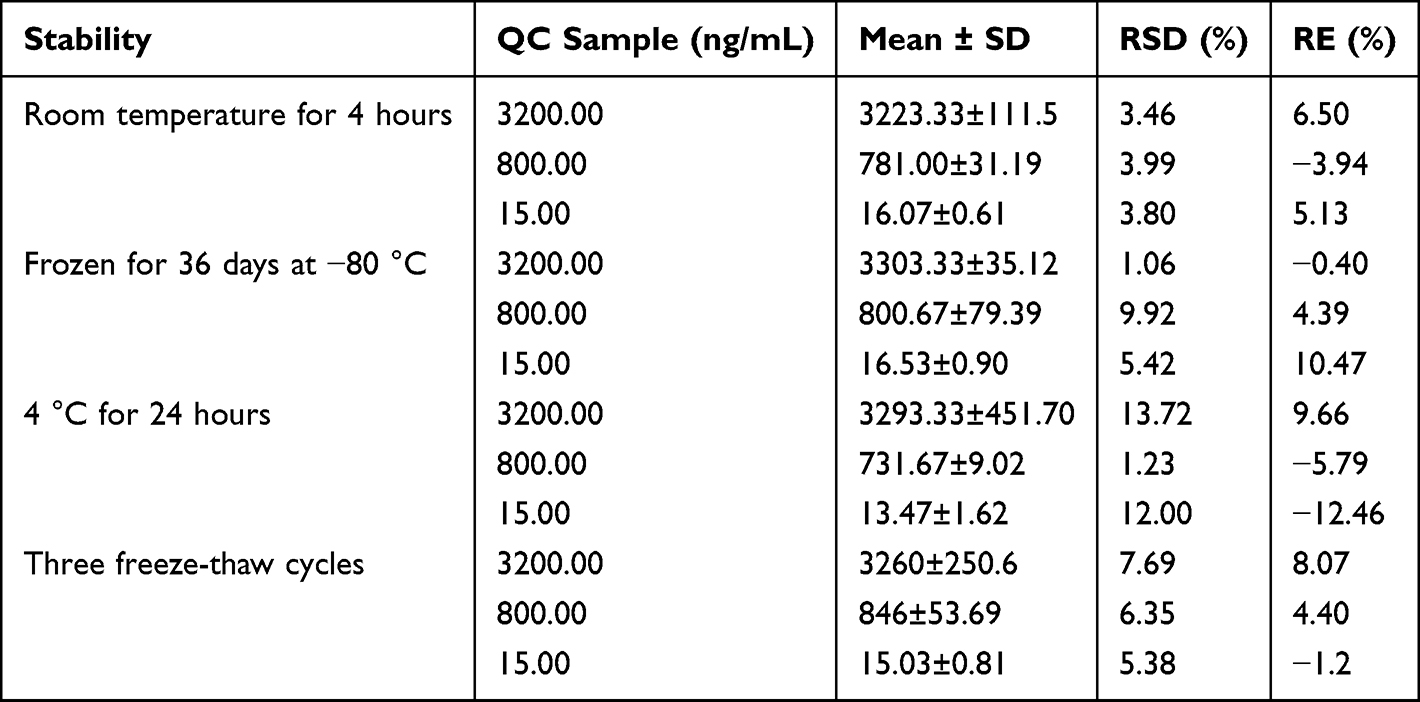 |
Table 5 Stability of INH in CSF (n=6) |
Effect of Dilution
The method was further assessed for its suitability to measure high-concentration samples via dilution. When INH concentrations in CSF exceeded the upper limit of quantification (4000 ng/mL), samples were appropriately diluted before analysis. The precision (RSD) and accuracy (RE) for the diluted samples were 5.77% and –2.05%, respectively, both meeting the pre-defined acceptance criteria of ≤15% for precision and accuracy in method validation. These results demonstrate that the method is not only applicable for quantitative analysis within the conventional concentration range, but can also accurately determine high-concentration CSF samples through dilution, indicating good method extensibility and clinical applicability.
Clinical Evaluation
Pharmacokinetic
This study was a real-world prospective observational investigation. A 14-year-old male patient with TBM was recruited from the Department of Infectious Diseases, Beijing Tsinghua Changgung Hospital, in June 2025. The patient presented with a chief complaint of “intermittent headache for 9 months and impaired consciousness for 3 months”. Etiological diagnosis (CSF Xpert MTB/RIF) was positive for Mycobacterium tuberculosis complex (MTBC) (semi-quantitative grade: medium, Ct value: 23). The patient’s family denied any history of underlying diseases, infectious disease exposure, smoking, alcohol consumption, or relevant family history.
The patient was classified as TBM Grade III. Baseline admission laboratory parameters were as follows: alanine aminotransferase (ALT) 11.7 U/L, aspartate aminotransferase (AST) 20.2 U/L, serum creatinine (CRE) 18 μmol/L, estimated glomerular filtration rate (eGFR) 235.38 mL/min/1.73 m2, serum albumin 41.2 g/L, hemoglobin 101 g/L. Cerebrospinal fluid (CSF) analysis showed: protein 1.45 g/L, glucose 1.28 mmol/L, chloride 116.9 mmol/L, and white blood cell count 6 × 10⁶/L.
Upon admission, the patient had an existing external ventricular drainage catheter. The anti-tuberculosis treatment regimen consisted of oral or intravenous administration of INH 600 mg once daily, rifampicin 0.45 g once daily, pyrazinamide 0.5 g once daily, and ethambutol 0.5 g once daily. Adjunctive therapy included methylprednisolone 20 mg once daily and mannitol for intracranial pressure management. Concurrently, intrathecal injections were administered at a dose of INH 100 mg plus DEX 2 mg, three times per week, following informed consent.
CSF samples were collected from the external ventricular drain at the following time points relative to intrathecal INH administration: 0 h (pre-dose), and 5 min, 10 min, 30 min, 1 h, 2 h, 6 h, 12 h, and 48 h post-dose. The measured concentrations of all samples fell within the range of the standard calibration curve. Pharmacokinetic analysis of INH in CSF was performed for this patient, and the concentration-time profile is presented in Figure 3.
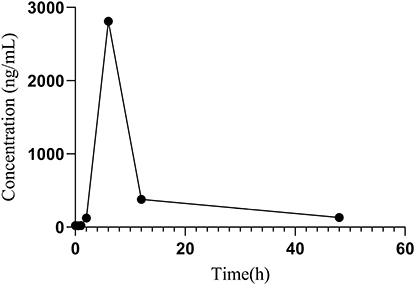 |
Figure 3 Concentration-time profile of INH in one patient following intrathecal administration of 100 mg. The concentration reached a peak of 2810 ng/mL at 6 hours post-dose and declined to 132 ng/mL by 48 hours, immediately before the next scheduled intrathecal injection. |
Based on the CSF concentration data following the intrathecal administration of 100 mg INH, the pharmacokinetic parameters were as follows: time to maximum concentration (Tmax) = 6 h, maximum concentration (Cmax) = 2810 ng/mL, trough concentration at 48 h (Ctrough) = 132 ng/mL. The area under the concentration-time curve from 0 to 48 hours (AUC0–48) was 35650 ng·h/mL, with AUC0–6 = 5380 ng·h/mL and AUC6–48 = 30270 ng·h/mL. The distribution half-life (t1/2α) was approximately 1.5 h, and the elimination half-life (t1/2β) was approximately 14 h. The apparent clearance (CL/F) was 2.8 L/h, and the apparent volume of distribution (Vd/F) was 55 L.
Analysis of Trough Concentrations of INH in CSF
A total of 162 CSF samples were analyzed. The range of INH trough concentrations was 709.50 (140.50, 1517.50) ng/mL. The drug concentrations were compared between the control group and the experimental group based on the number of CSF samples, as presented in Table 6. The results revealed that the median INH concentration in the CSF of the experimental group (1130.00 ng/mL) was significantly higher than that in the control group (155.00 ng/mL) (P < 0.001). Regarding the target attainment rates at the two defined concentration breakpoints, the experimental group demonstrated significantly superior performance compared to the control group, with the differences being statistically significant (P < 0.001).
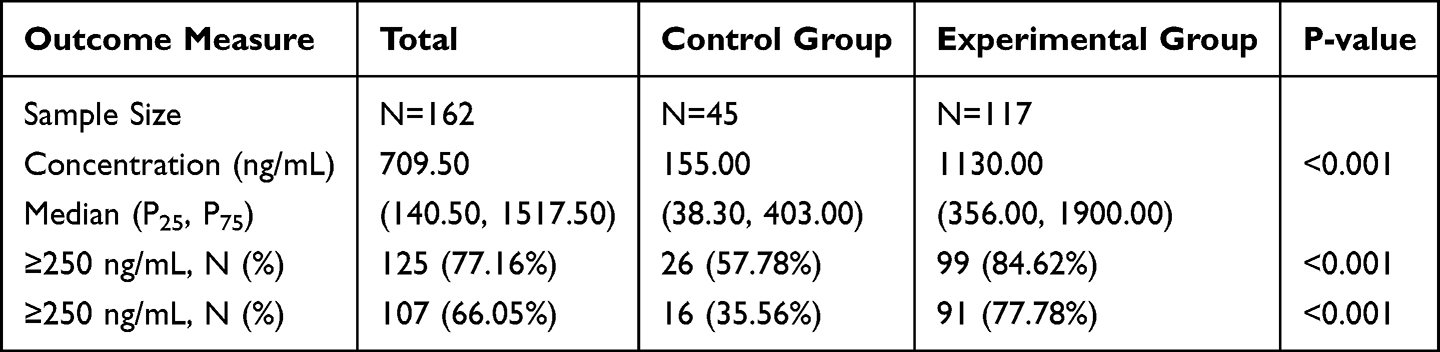 |
Table 6 Comparison of CSF Drug Concentration/Target Attainment Rate (Per Sample Frequency) |
Discussion
Three critical factors must be considered when developing a functional analytical method: LLOQ with high sensitivity, a simple and efficient sample preparation procedure, and reasonable chromatographic elution time. Although several LC–MS/MS methods have been reported in the literature,13,14 most of them use plasma as the detection matrix and require complex pretreatment steps such as derivatization of INH metabolites or phospholipid removal. Additionally, these methods often exhibit relatively high LLOQ (80 ng/mL or higher), employ gradient elution programs exceeding 4.2 minutes, or rely on injection volumes larger than 50 μL to maintain adequate sensitivity.
Human CSF was used as the matrix in the present study. Compared with the previously reported method,15 this LC-MS/MS method demonstrates significantly higher sensitivity for INH detection, achieving LLOQ of 5 ng/mL, which is notably lower than the 58.6 ng/mL reported. The chromatographic run time was also reduced to 3.5 minutes, compared to the 4.5 minutes required by the earlier method. For sample preparation, the one-step acetonitrile-mediated protein precipitation employed here is simpler and faster than the solid-phase extraction procedure using Strata‑X mixed-mode plates, while maintaining satisfactory recovery (93.16–104.74%). The validated quantification range of 5–4000 ng/mL fully covers the INH concentrations observed following intrathecal administration, supporting its suitability for TDM and pharmacokinetic studies.
The prospective clinical study revealed that in patients receiving conventional anti-tuberculosis therapy, the median trough concentration of INH in CSF was only 155.00 ng/mL, with 42.22% (19/45) of samples falling below the MIC for drug-sensitive MTB (120 ng/mL),10 indicating inadequate inhibitory levels. Given the rising prevalence of drug-resistant tuberculosis, where the MIC for resistant strains can reach 4000 ng/mL,16 it is notable that only 35.56% (16/45) of samples in the conventional treatment group exceeded 250 ng/mL. This suggests that CSF drug concentrations in most patients may be insufficient to suppress resistant strains, partly explaining the suboptimal therapeutic responses observed clinically.5 In contrast, the regimen combined with intrathecal INH injection significantly increased drug exposure in CSF, achieving a median trough concentration of 1130.00 ng/mL. Moreover, 84.62% (99/117) of samples exceeded 120 ng/mL, and 77.78% (91/117) exceeded 250 ng/mL. The present results not only confirm that intrathecal administration effectively elevates INH concentrations in CSF, but also highlight the importance of TDM in TBM management. TDM enables timely identification of patients with insufficient CSF INH concentrations, allowing for regimen adjustment to improve clinical outcomes.
Limitations
The primary aim of this study was to establish a methodology and conduct a preliminary evaluation of its clinical application. The limitations of the clinical research mainly include a relatively small sample size and its single‑center observational design, which may introduce selection bias. The study only measured trough concentrations of INH in CSF and did not comprehensively assess the dynamic relationship between peak concentrations and the time‑dependent bactericidal characteristics. Furthermore, the study did not systematically explore the optimal dose, frequency, or duration of intrathecal administration. Future studies should involve multicenter, large‑sample prospective research to further validate the clinical benefits and safety of intrathecal INH administration and to establish an individualized dosing model based on CSF drug concentrations. Additionally, pharmacokinetic/pharmacodynamic integrated analyses should be conducted to clarify the quantitative relationship between INH concentrations in CSF and clinical efficacy, the development of drug resistance, and adverse reactions, thereby providing stronger evidence for the precision treatment of severe and drug‑resistant TBM.
Conclusion
The established LC-MS/MS method in this study is accurate and reliable, making it suitable for clinical monitoring of INH concentrations in the CSF of TBM patients. Clinical results demonstrate that intrathecal INH administration significantly increases CSF drug concentrations and improves target attainment rates. Therefore, TDM is recommended for severe or treatment-refractory TBM patients, and intrathecal delivery should be considered as a key strategy for optimizing therapeutic regimens.
Ethical Statement
This study was approved by the Institutional Review Board of Beijing Tsinghua Changgung Hospital (Ethics No. 24210-4-03) and conducted in accordance with the Declaration of Helsinki. No AI-generated content or tools were used for the writing or analysis of this manuscript.
Acknowledgments
The authors thank all contributors to this work.
Author Contributions
Mingming Xin and Jiabin Liang share first authorship. All authors made a significant contribution to the work reported, whether that is in the conception, study design, execution, acquisition of data, analysis and interpretation, or in all these areas; took part in drafting, revising or critically reviewing the article; gave final approval of the version to be published; have agreed on the journal to which the article has been submitted; and agree to be accountable for all aspects of the work.
Funding
This work was supported by the general program of Beijing Natural Science Foundation (Grant No. 7242209). The funding source had no role in the study design, data collection, analysis, interpretation, or decision to submit the manuscript for publication.
Disclosure
The authors declare that there are no conflicts of interest.
References
1. Saluja A, Vibha D, Pandit AK, et al. Comparison of dexamethasone regimens in tubercular meningitis (TBM): a randomized open label clinical trial. J Infect Dev Ctries. 2023;17(12):1769–12. doi:10.3855/jidc.17563
2. Dodd PJ, Osman M, Cresswell FV, et al. The global burden of tuberculous meningitis in adults: a modelling study. PLOS Glob Public Health. 2021;1(12):e0000069. doi:10.1371/journal.pgph.0000069
3. World Health Organization. Global Tuberculosis Report 2024. World Health Organization; 2024. Available from: https://www.who.int/teams/global-tuberculosis-programme/tb-reports/global-tuberculosis-report-2024.
4. World Health Organization. WHO Consolidated Guidelines on Tuberculosis: Module 4: Treatment - Drug-Susceptible Tuberculosis Treatment. Geneva: World Health Organization; 2022.
5. Ashizawa N, Kubo R, Tagawa R, et al. Efficacy of intrathecal isoniazid and steroid therapy in refractory tuberculous meningitis. Intern Med. 2024;63(4):583–586. doi:10.2169/internalmedicine.1917-23
6. Thomas SN, French D, Jannetto PJ, Rappold BA, Clarke WA. Liquid chromatography-tandem mass spectrometry for clinical diagnostics. Nat Rev Meth Primers. 2022;2(1):96. doi:10.1038/s43586-022-00175-x
7. Marais S, Thwaites G, Schoeman JF, et al. Tuberculous meningitis: a uniform case definition for use in clinical research. Lancet Infect Dis. 2010;10(11):803–812. doi:10.1016/S1473-3099(10)70138-9
8. Thwaites G, Fisher M, Hemingway C, et al. British Infection Society guidelines for the diagnosis and treatment of tuberculosis of the central nervous system in adults and children. J Infect. 2009;59(3):167–187. doi:10.1016/j.jinf.2009.06.011
9. Streptomycin in Tuberculosis Trials Committee, Medical Research Council. Streptomycin treatment of tuberculous meningitis. Lancet. 1948;1(6503):582–596.
10. Clinical and Laboratory Standards Institute. Performance standards for susceptibility testing of Mycobacteria, Nocardia spp. and other aerobic actinomycetes, 2nd edition. CLSI supplement M24S. Clinical and Laboratory Standards Institute; 2023.
11. Ji X, Chen Y, Li R, Zhou T, Lu W. A high-sensitivity LC-MS/MS method for the determination of 4-methyl-piperazine-1-carbodithioc acid 3-cyano-3, 3-diphenylpropyl ester hydrochloride in rat plasma and its application to a pharmacokinetics study. Biomed Chromatogr. 2012;26(10):1196–1201. doi:10.1002/bmc.2678
12. U.S. Food and Drug Administration. M10 bioanalytical method validation and study sample analysis: guidance for industry. U.S. Food and Drug Administration; 2022. Available from: https://collections.nlm.nih.gov/catalog/nlm:nlmuid-9918590087306676-pdf.
13. Ky Anh N, My Tung P, Kim MJ, et al. Quantitative analysis of isoniazid and its four primary metabolites in plasma of tuberculosis patients using LC-MS/MS. Molecules. 2022;27(23):8607. doi:10.3390/molecules27238607
14. Pršo K, Žideková N, Porvazník I, Solovič I, Mokrý J, Kertys M. A high‐throughput LC–MS/MS method for simultaneous determination of isoniazid, ethambutol and pyrazinamide in human plasma. Rapid Commun Mass Spectrom. 2023;37(2):e9425. doi:10.1002/rcm.9425
15. Maputla SP, Joubert A, Castel S, et al. Development and validation of a liquid chromatography-tandem mass spectrometry assay for the simultaneous analysis of isoniazid and pyrazinamide in cerebrospinal fluid. J Pharm Biomed Anal. 2025;255:116613. doi:10.1016/j.jpba.2024.116613
16. Vasiliauskaitė L, Bakuła Z, Vasiliauskienė E, et al. Detection of multidrug-resistance in Mycobacterium tuberculosis by phenotype- and molecular-based assays. Ann Clin Microbiol Antimicrob. 2024;23(1):81. doi:10.1186/s12941-024-00741-z
 © 2026 The Author(s). This work is published and licensed by Dove Medical Press Limited. The
full terms of this license are available at https://www.dovepress.com/terms
and incorporate the Creative Commons Attribution
- Non Commercial (unported, 4.0) License.
By accessing the work you hereby accept the Terms. Non-commercial uses of the work are permitted
without any further permission from Dove Medical Press Limited, provided the work is properly
attributed. For permission for commercial use of this work, please see paragraphs 4.2 and 5 of our Terms.
© 2026 The Author(s). This work is published and licensed by Dove Medical Press Limited. The
full terms of this license are available at https://www.dovepress.com/terms
and incorporate the Creative Commons Attribution
- Non Commercial (unported, 4.0) License.
By accessing the work you hereby accept the Terms. Non-commercial uses of the work are permitted
without any further permission from Dove Medical Press Limited, provided the work is properly
attributed. For permission for commercial use of this work, please see paragraphs 4.2 and 5 of our Terms.