Back to Journals » International Journal of General Medicine » Volume 15
Developing a Nomogram-Based Scoring Tool to Estimate the Risk of Pulmonary Embolism
Authors Zhou Q, Xiong XY, Liang ZA
Received 20 January 2022
Accepted for publication 28 March 2022
Published 5 April 2022 Volume 2022:15 Pages 3687—3697
DOI https://doi.org/10.2147/IJGM.S359291
Checked for plagiarism Yes
Review by Single anonymous peer review
Peer reviewer comments 2
Editor who approved publication: Dr Scott Fraser
Qiao Zhou,* Xing-Yu Xiong,* Zong-An Liang
Department of Respiratory and Critical Care Medicine, West China Hospital of Sichuan University, Chengdu, People’s Republic of China
*These authors contributed equally to this work
Correspondence: Zong-An Liang, Email [email protected]
Background: Pulmonary embolisms (PEs) are clinically challenging because of their high morbidity and mortality. This study aimed to develop a scoring tool for predicting PEs to improve their clinical management.
Methods: Clinical, laboratory, and imaging parameters were retrospectively collected from suspected PE patients who had cough or chest pain and were hospitalized in West China Hospital of Sichuan University from May 2015 to April 2020. The final diagnosis of PE was defined based on findings from computed tomographic pulmonary angiography (CTPA). In this study, patients were randomly divided 2:1 into derivation and validation cohorts, which were used to create and validate, respectively, a nomogram. Model performance was estimated with the area under the receiver operating characteristic curve and a calibration curve.
Results: Our study incorporated data on more than 100 features from 1480 patients (811 non-PE, 669 PE). The nomogram was constructed using important predictive features including D-dimer, APTT, FDP, platelet count, sodium, albumin and cholesterol and achieved AUC values of 0.692 with the derivation cohort (95% CI 0.688– 0.696, P < 0.01) and 0.688 with the validation cohort (95% CI 0.653– 0.723, P < 0.01). The calibration curve showed good agreement between the probability predicted by the nomogram and the actual probability.
Conclusion: In this study, we successfully developed a nomogram that can predict the risk of PE, which can not only improve the clinical management of PE patients but also decrease unnecessary CTPA scans and their adverse effects.
Keywords: pulmonary embolism, clinical management, nomogram, risk-scoring tool
Introduction
Pulmonary embolism (PE) is a serious pulmonary circulatory disease caused by blockage of the main branches of the pulmonary artery. According to the literature, a missed diagnosis or a misdiagnosis often occurs because the clinical symptoms of PE are difficult to distinguish from other diseases, such as lung cancer.1–3 Although computed tomographic pulmonary angiography (CTPA) is currently the first-line choice for diagnosing and assessing PEs, it is not without some limitations, including poor sensitivity in diagnosing pulmonary artery thromboses in its subsegments and smaller elements. CTPA is also time-consuming, expensive and unavailable at bedside, during critical conditions, in the emergency department and in grassroots units. A recent study found that the detection rate of PE through CTPA was less than 5%.4 More importantly, CTPA can cause severe adverse effects in patients, such as renal functional damage caused by the contrast medium. Therefore, it is particularly important to develop a simple, rapid, safe, reliable and sensitive method to help clinicians improve the diagnosis of PE patients. Relevant guidelines5–7 have proposed that the diagnosis of PE should be assisted by clinical scoring systems such as the Wells score, which has decreased the number of unnecessary CTPAs and, as a result, the adverse effects associated with the scan. Although existing clinical scoring systems have a certain diagnostic value for suspected PE patients, this value is clinically controversial, and the accuracy rate remains low.8,9
At present, the nomogram has been generally accepted as a reliable scoring tool for quantifying the risk of clinical events.10–12 A nomogram integrates multiple prediction indexes based on multifactor regression analysis and then uses line segments with scales for connecting scores with a straight line to express the relationship between the different variables in the prediction model. The nomogram transforms complex regression equations into a visual graph, which makes the results of the prediction model more intuitive and convenient for the clinical evaluation of patients. In this study, we aimed to identify the combination of variables that would result in a highly accurate prediction of PE and then develop a predictive nomogram to improve the clinical management of PE patients.
Materials and Methods
Ethics Statements
This study was approved by the biomedical ethics review committee of West China Hospital of Sichuan University, and the whole study was conducted according to the principles expressed in the Declaration of Helsinki. Neither the patients nor the public were involved in the design, conduct, reporting, or dissemination plans of our study. Because this study involved no more than a minimal risk to patients, the requirement for informed consent was waived. In this study, all efforts were made to protect the patients’ privacy and anonymity.
Patient Selection and Clinical Data
We promise that all data will be made available during or after data collection. In this study, the medical records of 1480 consecutive suspected PE patients who were hospitalized in West China Hospital of Sichuan University from May 2015 to April 2020 were retrospectively reviewed. CTPA was performed for all suspected patients included in the study, and suspected PE patients were finally diagnosed through the results of the scans (811 non-PE, 669 PE). The inclusion criteria were as follows: 1. presence of high risk factors for venous thromboembolism (VTE), including venous blood stasis, endothelial injury of the venous system and hypercoagulable blood condition, with or without the following clinical symptoms: cough, chest pain, chest tightness, shortness of breath, dyspnea, hypoxemia, hemoptysis and syncope; 2. complete medical records during the s period, including medical history, clinical manifestations, laboratory results, imaging results, diagnosis and treatment activities and prognosis; and 3. CTPA results that allowed a clear diagnosis of PE. The exclusion criteria were as follows: 1. CTPA results that did not allow a clear diagnosis of PE; and 2. age < 18 years or pregnancy. A flow diagram of the patient selection procedure is presented in Figure 1.
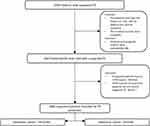 |
Figure 1 Flow diagram of the patient selection procedure. |
Development of the Model
Eligible patients were randomized at a 2:1 ratio into the derivation and validation cohorts based on the TRIPOD standard.13 The associations of the risk of PE with the clinical, laboratory, and imaging parameters were preliminarily evaluated using the LASSO model, which was followed by having PE specialists simplify the variables according to the actual clinical situation. Variables with p values less than 0.05 were entered into multivariable logistic regression analysis to further identify the predictive factors for PE. Based on the results from the regression analysis, a nomogram for predicting PE was constructed.14
The nomogram was created using the data from the derivation cohort by converting each regression coefficient from the multivariate logistic regression into a scale of 0 points (low) to 100 points (high), and finally, the total scores for all of the variables were summed.15 The performance of the nomogram was assessed by discrimination and calibration, and the discriminative ability of the model was estimated by the receiver operating characteristic (ROC) curve.16 A validation cohort was used to evaluate the model’s consistency relative to the observed outcomes.17 A calibration curve was used to assess the consistency between the actual incidence of PE and the incidence predicted by the model.
Statistics
Continuous variables with a normal distribution are presented as the mean±standard deviation (SD), nonnormal variables are reported as the median (Q1, Q3), and categorical data are described as numbers (n, %). Student’s t test or one-way analysis of variance (ANOVA) was used for normally distributed continuous variables. The Kruskal–Wallis test was used for the nonnormally distributed continuous variables. Fisher’s exact test or the chi-squared test was used for comparisons of categorical data separately. Logistic regression was used to evaluate the different predictive factors, and the results are presented as odds ratios (ORs) with corresponding 95% confidence intervals (95% CIs). Differences were considered significant at p values of < 0.05, and all analyses were performed using R software.
Results
Demographics and Baseline Characteristics
In this study, a total of 1480 eligible patients were included. Of these, a total of 811 non-PE patients (525 males and 286 females) had an average age of 60 ± 15.2 years, while the remaining 669 PE patients (409 males and 260 females) had an average age of 59.4 ± 15.4 years. The demographic and baseline characteristics of the patients are presented in Table 1.
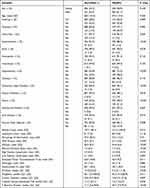 |
Table 1 Demographic and Baseline Patient Characteristics |
Comparison Between the Derivation and Validation Cohorts
After random grouping at a ratio of 2:1, 1036 and 444 patients were divided into a derivation cohort and a validation cohort, respectively. In the derivation cohort (662 men and 374 women), the average age was 59.8 ± 15.3 years, while in the validation cohort (272 men and 172 women), the average age was 59.5 ± 15.3 years. There was no significant difference between the derivation cohort and the validation cohort (Table 2).
 |
Table 2 Comparison Between Derivation Cohort and Validation Cohort |
Variable Selection
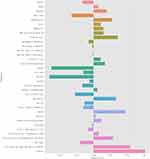
All data during hospitalization were analyzed by Lasso model, features selected by Lasso were presented as Figure 2. Seven variables were considered significant predictors of PE, including D-dimer, APTT, FDP, platelet count, albumin, cholesterol and sodium. Multivariate logistic regression analysis on the derivation cohort data revealed that PE was independently predicted by D-dimer (OR 1.05, 95% CI 1.01–1.09), APTT (OR 1.02, 95% CI 1.00–1.03), FDP (OR 1.02, 95% CI 1.00–1.03), platelet count (OR 1.01, 95% CI 1.00–1.02), albumin (OR 0.95, 95% CI 0.93–0.97), cholesterol (OR 1.21, 95% CI 1.08–1.36), and sodium (OR 1.07, 95% CI 1.04–1.10) (Table 3).
 |
Table 3 Multivariate Logistic Regression Analyses for Developing the Nomogram to Predict PE |
Performance of the Nomogram
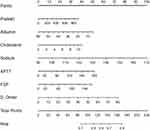
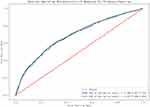
On the basis of the multivariate logistic regression, a nomogram for predicting PE was developed by incorporating seven variables, including D-dimer, APTT, FDP, platelet count, albumin, cholesterol and sodium (Figure 3). The AUC was 0.692 in the derivation cohort (95% CI 0.688–0.696, P<0.01) and 0.688 in the validation cohort (95% CI 0.653–0.723, P<0.01), which indicated that the model’s consistency relative to the observed outcomes was good (Figure 4). The calibration curve revealed good agreement between the probability predicted by the nomogram and the actual probability (Figure 5).
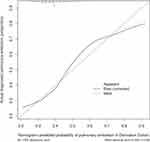 |
Figure 5 Calibration curve for the nomogram predicting PE. The horizontal axis represents the nomogram-predicted probability of PE, and the vertical axis represents the actual observed PE. |
Discussion
Acute PE is the third most common cause of cardiovascular death in the world after coronary heart disease and stroke.18 According to the literature, the short-term mortality of untreated PE patients is as high as 30%, and the 30-day mortality of patients with a simplified pulmonary embolism severity index (sPESI)≥1 is as high as 10.9%.19,20 Similar to deep venous thrombosis (DVT), PE is essentially a different manifestation of VTE in different parts of the body and in different stages. An embolism of the pulmonary artery can cause a series of pathophysiological changes, such as right ventricular ischemia, right heart dysfunction, systemic hypotension, shock, gas exchange disorders, pulmonary infarction, and chronic thromboembolic pulmonary hypertension; in severe cases, it can cause death.
At present, the clinical management of PE remains challenging because of its high incidence and mortality. In this study, we successfully developed a simple, intuitive nomogram for a statistical predictive model that quantified the risk of PE, which may assist clinicians in diagnosing PE and in making recommendations for the patient. Previously, a prediction model based on deep learning was developed to assess the probability of PE and clot burden in patients with CTPA data.21 However, a nomogram for predicting PE has not been previously constructed. To our knowledge, this study was the first to construct a quantitative nomogram to predict the probability of PE, as previously constructed nomograms have focused only on predicting the probability of deterioration for normotensive patients with acute PEs on admission.22
In our nomogram, D-dimer and sodium were the greatest contributors to the risk of PE, followed by APTT and FDP, while c and the platelet count showed the smallest effect on the probability of PE, and albumin showed an adverse effect on the probability of PE. To our knowledge, D-dimer, APTT, FDP and platelet count have previously been considered to be important independent predictors of PE, consistent with our results.23–25 More importantly, our nomogram combined these independent predictors to determine the risk of PE by calculating the total score. In 1856, Virchow26 proposed three elements of thrombosis: blood flow stagnation, blood hypercoagulability and vascular endothelial injury. In fact, all the high-risk factors are the result in part or from all three of the above elements. For example, as we have seen in our study, hypernatremia is commonly a result of blood concentration, which makes the blood more viscous and the blood flow slow down, resulting in blood hypercoagulability that can increase the risk of thrombosis. In addition, hypercholesterolemia is an important cause of coronary atherosclerosis and thrombosis, which may be related to blood hypercoagulability, which is caused by many factors.27 Previous studies have found that a decrease in albumin was a contributor to the risk of thrombotic diseases, such as venous thromboembolism, PE and acute coronary syndromes, which is consistent with our study.28,29 The difference was that this nomogram incorporated albumin into the PE prediction model for the first time. First, hypoproteinemia causes a reduction in blood volume and an increase in liver synthetic lipoprotein, resulting in secondary hyperlipidemia and the formation of a hypercoagulable blood condition. At the same time, hypoproteinemia can promote the synthesis of coagulation factors in the liver and activate the internal and external coagulation systems, resulting in thrombosis. In addition, hypoproteinemia can cause systemic edema, which compresses the blood vessels and leads to blood stasis.29,30
Limitations
However, several limitations should be addressed. First, our analysis used only single-center data, so the performance of the nomogram might differ for datasets obtained from multiple institutions with differently distributed patient characteristics. Second, if outpatients had been involved in this study, the results would have been more accurate. Third, this study was a retrospective analysis, and a large number of prospective studies are needed to further confirm the results.
Conclusions
We developed a scoring tool based on a nomogram published as a tool for predicting PE. This risk-scoring tool is simple, intuitive and feasible, and it may help clinicians improve the management of PE patients.
Abbreviations
PE, pulmonary embolism; CTPA, computed tomographic pulmonary angiography; ROC, receiver operating characteristic curve; AUC, area under the curve; OR, odds ratio; CI, confidence interval; SD, standard deviation; TRIPOD, Transparent reporting of a multivariable prediction model for individual prognosis or diagnosis; APTT, activated partial thromboplastin time; FDP, fibrin degradation product.
Data Sharing Statement
The data and materials used and/or analyzed during the current study are available from the corresponding author upon reasonable request.
Acknowledgment
This article was edited by the professional scientific editing service from AJE.
Author Contributions
All authors made significant contributions to the work reported, whether in the conception, study design, execution, acquisition of data, analysis and interpretation, or in all these areas; took part in drafting, revising or critically reviewing the article; gave final approval of the version to be published; have agreed on the journal to which the article has been submitted; and agree to be accountable for all aspects of the work.
Funding
This study was supported by the Novel Coronavirus Emergency Projects of Sichuan Science and Technology Office (grant no 2020YFS0005 and grant no 2020YFS0009).
Disclosure
The authors report no conflicts of interest for this work.
References
1. Meyer G, Roy P-M, Gilberg S, Perrier A. Pulmonary embolism. BMJ. 2010;340(apr13 2):c1421. doi:10.1136/bmj.c1421
2. Melazzini F, Reduzzi M, Quaglini S, Fumoso F, Lenti MV, Di Sabatino A. Diagnostic delay of pulmonary embolism in COVID-19 patients. Front Med. 2021;8:637375.
3. Hendriksen JM, Koster-van Ree M, Morgenstern MJ, et al. Clinical characteristics associated with diagnostic delay of pulmonary embolism in primary care: a retrospective observational study. BMJ Open. 2017;7:e012789.
4. Righini M, Robert-Ebadi H, Le Gal G. Diagnosis of acute pulmonary embolism. J Thromb Haemost. 2017;15:1251–1261.
5. Konstantinides SV, Meyer G, Becattini C, et al. ESC Guidelines for the diagnosis and management of acute pulmonary embolism developed in collaboration with the European Respiratory Society (ERS): the task force for the diagnosis and management of acute pulmonary embolism of the European Society of Cardiology (ESC). Eur Respir J. 2019;2019(54):e1901647.
6. Howard L, Barden S, Condliffe R, et al. British thoracic society guideline for the initial outpatient management of pulmonary embolism (PE). Thorax. 2018;73:ii1–ii29.
7. Tran HA, Gibbs H, Merriman E, et al. New guidelines from the thrombosis and haemostasis society of Australia and New Zealand for the diagnosis and management of venous thromboembolism. Med J Aust. 2019;210:227–235.
8. Van der Hulle T, Cheung WY, Kooij S, et al. Simplified diagnostic management of suspected pulmonary embolism (the YEARS study): a prospective, multicentre, cohort study. Lancet. 2017;390:289–297.
9. Penaloza A, Verschuren F, Meyer G, et al. Comparison of the unstructured clinician gestalt, the wells score, and the revised Geneva score to estimate pretest probability for suspected pulmonary embolism. Ann Emerg Med. 2013;62:117–124.e2.
10. Liang W, Zhang L, Jiang G, et al. Development and validation of a nomogram for predicting survival in patients with resected non-small-cell lung cancer. J Clin Oncol. 2015;33:861–869.
11. Zheng W, Li K, Zhu W, et al. Nomogram prediction of overall survival based on log odds of positive lymph nodes for patients with penile squamous cell carcinoma. Cancer Med. 2020;9:5425–5435.
12. Aviram G, Shmueli H, Adam SZ, et al. Pulmonary hypertension: a nomogram based on CT pulmonary angiographic data for prediction in patients without pulmonary embolism. Radiology. 2015;277:236–246.
13. Moons KG, Altman DG, Reitsma JB, et al. Transparent reporting of a multivariable prediction model for individual prognosis or diagnosis (TRIPOD): explanation and elaboration. Ann Intern Med. 2015;162:W1–W73.
14. Karlo CA, Kou L, Di Paolo PL, et al. Renal cell carcinoma: a nomogram for the CT imaging-inclusive prediction of indolent, non-clear cell renal cortical tumours. Eur J Cancer. 2016;59:57–64.
15. Lei Z, Li J, Wu D, et al. Nomogram for preoperative estimation of microvascular invasion risk in hepatitis B virus-related hepatocellular carcinoma within the Milan criteria. JAMA Surg. 2016;151:356–363.
16. Iasonos A, Schrag D, Raj GV, Panageas KS. How to build and interpret a nomogram for cancer prognosis. J Clin Oncol. 2008;26:1364–1370.
17. Wolff RF, Moons KGM, Riley RD, et al. PROBAST: a tool to assess the risk of bias and applicability of prediction model studies. Ann Intern Med. 2019;170:51–58.
18. Wendelboe AM, Raskob GE. Global burden of thrombosis: epidemiologic aspects. Circ Res. 2016;118:1340–1347.
19. Becattini C, Agnelli G, Lankeit M, et al. Acute pulmonary embolism: mortality prediction by the 2014 European Society of Cardiology risk stratification model. Eur Respir J. 2016;48:780–786.
20. Konstantinides SV, Meyer G, Becattini C, et al. ESC Guidelines for the diagnosis and management of acute pulmonary embolism developed in collaboration with the European Respiratory Society (ERS). Eur Heart J. 2019;2020(41):543–603.
21. Liu W, Liu M, Guo X, et al. Evaluation of acute pulmonary embolism and clot burden on CTPA with deep learning. Eur Radiol. 2020;30:3567–3575.
22. Gao Y, Ji C, Zhao H, Han J, Shen H, Jia D. Developing a scoring tool to estimate the risk of deterioration for normotensive patients with acute pulmonary embolism on admission. Respir Res. 2021;22:9.
23. Righini M, van Es J, den Exter PL, et al. Age-adjusted D-dimer cutoff levels to rule out pulmonary embolism: the ADJUST-PE study. JAMA. 2014;311:1117–1124.
24. Rezania S, Puskarich MA, Petrusca DN, Neto-Neves EM, Rondina MT, Kline JA. Platelet hyperactivation, apoptosis and hypercoagulability in patients with acute pulmonary embolism. Thromb Res. 2017;155:106–115.
25. Sato N, Takahashi H, Shibata A. Fibrinogen/fibrin degradation products and D-dimer in clinical practice: interpretation of discrepant results. Am J Hematol. 1995;48:168–174.
26. Bagot CN, Arya R. Virchow and his triad: a question of attribution. Br J Haematol. 2008;143:180–190.
27. Tada H, Nohara A, Inazu A, Sakuma N, Mabuchi H, Kawashiri MA. Sitosterolemia, hypercholesterolemia, and coronary artery disease. J Atheroscler Thromb. 2018;25:783–789.
28. González-Pacheco H, Amezcua-Guerra LM, Sandoval J, et al. Prognostic implications of serum albumin levels in patients with acute coronary syndromes. Am J Cardiol. 2017;119:951–958.
29. Chi G, Gibson CM, Liu Y, et al. Inverse relationship of serum albumin to the risk of venous thromboembolism among acutely ill hospitalized patients: analysis from the APEX trial. Am J Hematol. 2019;94:21–28.
30. Huang MJ, Wei RB, Wang ZC, et al. Mechanisms of hypercoagulability in nephrotic syndrome associated with membranous nephropathy as assessed by thromboelastography. Thromb Res. 2015;136:663–668.
 © 2022 The Author(s). This work is published and licensed by Dove Medical Press Limited. The full terms of this license are available at https://www.dovepress.com/terms.php and incorporate the Creative Commons Attribution - Non Commercial (unported, v3.0) License.
By accessing the work you hereby accept the Terms. Non-commercial uses of the work are permitted without any further permission from Dove Medical Press Limited, provided the work is properly attributed. For permission for commercial use of this work, please see paragraphs 4.2 and 5 of our Terms.

