Back to Archived Journals » Advances and Applications in Bioinformatics and Chemistry » Volume 13
Developing a Kinase-Specific Target Selection Method Using a Structure-Based Machine Learning Approach
Authors Afanasyeva A, Nagao C ![]() , Mizuguchi K
, Mizuguchi K ![]()
Received 3 September 2020
Accepted for publication 13 November 2020
Published 2 December 2020 Volume 2020:13 Pages 27—40
DOI https://doi.org/10.2147/AABC.S278900
Checked for plagiarism Yes
Review by Single anonymous peer review
Peer reviewer comments 2
Editor who approved publication: Dr Juan Fernandez-Recio
Arina Afanasyeva,1 Chioko Nagao,1,2 Kenji Mizuguchi1,2
1Bioinformatics Project, National Institutes of Biomedical Innovation, Health and Nutrition, Osaka, Japan; 2Institute for Protein Research, Osaka University, Osaka, Japan
Correspondence: Arina Afanasyeva Email [email protected]
Introduction: Despite recent advances in the drug discovery field, developing selective kinase inhibitors remains a complicated issue for a number of reasons, one of which is that there are striking structural similarities in the ATP-binding pockets of kinases.
Objective: To address this problem, we have designed a machine learning model utilizing various structure-based and energy-based descriptors to better characterize protein–ligand interactions.
Methods: In this work, we use a dataset of 104 human kinases with available PDB structures and experimental activity data against 1202 small-molecule compounds from the PubChem BioAssay dataset “Navigating the Kinome”. We propose structure-based interaction descriptors to build activity predicting machine learning model.
Results and Discussion: We report a ligand-oriented computational method for accurate kinase target prioritizing. Our method shows high accuracy compared to similar structure-based activity prediction methods, and more importantly shows the same prediction accuracy when tested on the special set of structurally remote compounds, showing that it is unbiased to ligand structural similarity in the training set data. We hope that our approach will be useful for the development of novel highly selective kinase inhibitors.
Keywords: kinase, machine learning, activity prediction, docking, interaction descriptors
Introduction
Protein kinases are highly attractive drug targets since they are implicated in critical functions in signaling pathways in all cells. In many cases, the development of highly-specific kinase inhibiting reagents is crucial, because of various adverse effects caused by off-target activity. One example is receptor-associated Janus kinases (JAK1, JAK2, JAK3 and TYK2), which are involved in transmitting signals from cytokine receptors. Potentially, JAK3-specific inhibitors can act on immune cells, inhibiting only the γc-chain-containing cytokine receptors, whereas it was shown experimentally that the germline targeting of JAK1 and JAK2 results in perinatal and embryonic lethality.1,2 Kinases are also highly attractive targets for anti-cancer therapy.3–8 There are many mechanisms where specific kinases or their mutated forms are involved in cancer cell development and regulation. For example, the neurotrophic growth factor receptor (nTRK2) was shown to be essential for allowing some cells to survive detachment and therefore it is required for tumor cell metastasis. Vascular endothelial growth factor receptor (VEGFR) and the fibroblast growth factor receptor (FGFR) kinases are important in developing and sustaining tumor blood supply. Nevertheless, the development of kinase inhibitors for anticancer therapy is hindered by the problem of target selectivity, especially within the kinase family. Clinically observed adverse effects for kinase-based drugs such as imatinib, sorafenib, sunitinib and inhibitors of epidermal-growth-factor receptor (EGFR) include skin rash, secondary hypertension and vascular thrombosis.9 Some of the side effects could be caused by a non-direct mechanism of drug intervention, or due to off-target activity, where the drug compound interacts with non-target proteins, or due to the implications of the affected proteins in a number of pathways and different regulatory mechanisms, which may also be affected.10,11
Binding pockets in kinase proteins are highly structurally conserved; therefore, developing inhibitors selective to kinase remains a highly challenging task. To address the problem of kinase selectivity, a variety of approaches have been developed during the past decades. For example, recently many drug developers have focused on type II kinase inhibitors. These are compounds that bind within the allosteric site, stabilizing inactive kinase conformation and interacting with the conserved DFG-motif (“Asp-Phe-Gly”) when it is in “out” form.12 An interesting alternative is the so-called I1/2 type inhibitors, which possess advantages of both the type I and type II inhibitors, forming interactions in the ATP binding area with the hinge region and the DFG motif in both the “in” and “out” conformations of the activation loop.13 Cohen et al used a bioinformatics-based approach to define two main residues to act as selectivity filters, that are responsible for the selectively inhibiting p90 ribosomal protein S6 kinase (RSK) and not other kinases. Based on these findings, they designed potent selective inhibitors that required the presence of both the residues in appropriate positions in the ATP-binding pocket, as is found only in RSK kinases.14
There are many examples that demonstrate the effective application of machine learning in various different ways in order to solve the problem of large-scale target prioritization or activity prediction. Christmann-Franck et al presented a large-scale investigation of kinase promiscuity based on kinase activity profiles combined in a dataset covering 482 kinases against 2106 reported kinase inhibitors of different types. They were able to develop proteochemometric models for activity prediction by combining ligand and target descriptors.15 Stepniewska-Dziubinska et al used a structure-based approach for binding affinity prediction using deep learning for a diverse set of targets. For this purpose, they exploited 3D voxel-type descriptors applied to protein-ligand complexes with known crystal structures (PDBbind dataset). These descriptors characterize different aspects of the physico-chemical properties in each voxel.16 Another structure-based affinity prediction model based on a 3D convolutional neural network (CNN) was presented by Jiménez et al. In this work, the authors used voxel-type descriptors from the python library High Through-Put Molecular Dynamics (HTMD) applied for protein-ligand complexes of known structure (PDBbind).17 In computational drug design projects, protein-ligand crystal structures are often unavailable, but methods such as molecular docking can be used to obtain ligand conformations in the protein binding pocket. For such cases, Fukunishi et al developed a quantitative structure-activity relationship (QSAR) model based on docking scores to predict the binding energy in protein-ligand complexes, and tested it on kinase family proteins and matrix metalloproteinase (MMP) proteins.18
Lately, multi-task machine learning approaches attracted the attention of many computational chemists. Recent studies demonstrated high accuracy of such methods in tasks related to activity prediction across multiple targets and pharmacokinetic properties.19–21 Improvement has been achieved due to the synergetic effect of several related tasks predicted during the model training at the same time. In addition, such models are more efficient due to the reduced training time compared to the models trained for each endpoint separately.
The purpose of our research is to prioritize small-molecule kinase inhibitors selective against a broad range of kinases. Such an operation should be useful for the prediction of potential off-target activity of a drug candidate compound at the early stages of drug development. To achieve these objectives, we have developed an activity prediction method for a candidate inhibitor against a large set of kinases with or without the knowledge of the compound’s primary target. We combined the latest advances in machine learning techniques with structure-based methods for computational drug design. The set of descriptors that we designed to characterize protein–ligand interactions in complex structures do not include any direct structural characterization and therefore, our method is potentially unbiased to the structural similarity of the training dataset. Most QSAR methods have a limited applicability domain, meaning that they perform less accurately when tested on compounds which are out of the chemical space of the compounds in the training set and therefore can usually not be applied to novel compounds, or should be applied with caution.22 Therefore, the absence of structural descriptors in our model makes it advantageous for application to de novo designed drug candidates.
Methods
To build a kinase-targeted activity prediction model, we used activity data from the PubChem BioAssay Database dataset “Navigating the Kinome”, containing experimental data for activity screening for 172 kinase proteins, 1497 drug-like kinase-binding ligands, and overall 107,791 activity values.23 We used a single activity dataset in order to exclude the possibility of data inconsistency associated with a difference of experimental conditions and techniques. The set of descriptors we used to develop the machine-learning models include information from different stages of the workflow and incorporate features for unbound ligands, proteins and different aspects of kinase-–ligand interaction in a complex obtained by docking (Figure 1).
 |
Figure 1 Schematic workflow of activity prediction with a machine-learning model for test compounds. |
We assumed that the analyzed compounds have a known primary kinase target within the dataset, based on the analysis of relationship between target similarity and target activity profiles (target similarity reflects the similarity of target activity profiles, see the results and discussion section for further details). We defined the primary target as the kinase with the highest activity for a given compound and pKi > 6. The compounds not having activity data > 6 pKi were excluded from analysis. After data preparation, there were 1202 ligands and 104 kinases remaining in our dataset (Supplementary materials).
Preparing the Dataset of Crystal Structures for Kinases
We collected the dataset of kinase crystal structures from the PDB database, available for the proteins in the activity dataset. For each target from the dataset we have chosen one crystal structure, taking into consideration the following criteria:
Furthermore, some additional processing steps were performed:
- removal of the secondary alternative positions of atoms in the PDB file;
- reconstruction of hydrogens;
- removal of ambiguous covalent bonds with some metals according to the ICM and MMFF force field;
- assigning of the formal charges and partial atomic charges based on MMFF force field;
- reconstruction of missing heavy atoms according to the residue library;
- optimization of residues which have several states of protonation: His (three protonation states and two rotations), Asn and Gln (a 180 deg. flip), and Cys in the vicinity of metals.
- global energy optimization to avoid clashes.
6) all proteins were superimposed by ATP-binding pockets with an APF superimposition tool.25
Performing these steps resulted in a structural dataset consisting of 104 kinase protein structures.
Calculation of Pairwise Similarities
To investigate the effect of target structural similarity on target activity similarity (similarity of activity profiles) we calculated pairwise protein-protein similarities of 2 types: sequence similarity and APF structural similarity.
Sequence similarity was obtained as an ICM function Score, which returns the real score of the Needleman and Wunsch alignment for each protein pair.26 To calculate these scores we used sequences of PDB crystal structures that were prepared as described above.
APF score was obtained with the ICM tool siteSuperAPF. Atomic Property Fields (APF), is a method for chemical superimposition based on the consensus of atomic field maps, characterizing seven different physico-chemical properties, such as H-bond donor/acceptor property, lipophilicity, electrostatics, charge, size, and sp2-hybridization state. This method can be effectively applied for protein pockets, and APF consensus score is a good indicator for pairwise pocket similarity in terms of the physico-chemical properties of the pocket environment. Furthermore, we calculated the normalized APF distance and Sequence distance scores to avoid protein/pocket size effect as follows:
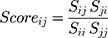
Sij and Sji are raw APF or Sequence similarity scores for i and j proteins in the dataset, Sii and Sjj - raw similarity scores of i and j proteins when similarity is measured against the protein itself (self-similarity).
Calculated similarities were incorporated with other descriptors for use in the activity prediction model. To introduce these values as descriptors for all protein-ligand pairs we assume that each of the ligands has its primary protein target within the dataset (the target with the highest activity and pKi > 6. Compounds that did not satisfy this requirement were excluded from the analysis). In this case, for each protein-ligand complex, we can assign similarity of the protein in a given complex to the primary target protein of the ligand (in the case where a given protein is the primary target for a given ligand in the analysed complex, the similarity will be the highest).
Docking Protocol to Obtain Protein-Ligand Complex Structures
To obtain the complex structures of the protein-ligand pairs according to the activity data from the “Navigating the Kinome” dataset we performed a docking simulation for 1202 compounds into prepared receptor structures of 104 human kinases. Docking was performed with the SMINA software, which is a fork of Autodock Vina with an improved scoring function, and is convenient for automated docking as a command-line tool.27 For each of the ligands, we sampled a single low-energy 3D conformation, added hydrogens, and charged with ICM tools.
The best-scored conformation for each receptor-ligand pair was used for further analysis. The resultant dataset of protein-ligand pairs with available activities consisted of 21,482 entries with activity range pKi 4–11.1.
Docking Accuracy Test
To estimate the potential docking-associated errors, we performed re-docking experiments for the refined DUDE dataset of 4129 co-crystallized protein-ligand structures.28 Protein structures were prepared according to the protocol described in the Methods section. The ligand molecules were removed from the binding pockets and initial ligand conformations were randomly sampled with the Open Babel tool.29 Docking was performed with SMINA as described in Methods, but for each ligand, for this test, we saved up to 100 top-scored ligand conformations. For each of docking conformations, we calculated static RMSD to its correct crystal conformation.
Calculating Descriptors
Docking-obtained protein-ligand complexes were used for the calculation of several features characterizing complex interactions.
SMINA Score
The scores obtained from docking included several energy terms reflecting different types of interaction, including hydrogen bond formation, hydrophobic interaction, electrostatic interaction and others.27 We extracted values for all these terms as additional descriptors for our model.
X-Score
We calculated binding affinities using resulted complexes using the X-score.30 The X-score includes three differently calibrated scoring functions and the consensus function X-CSCORE. We used all 4 scores for each complex.
Protein-Ligand Contact Area
The protein-ligand contact area was calculated with the ICM-pro Area tool.
Interaction Signatures for Complexes
The PyMol-based program PLIP (Protein-Ligand Interaction Profiler)31 was used to calculate Interaction signatures for complexes. To process the PLIP output report file we additionally created a bash-script to run the processing automatically and to extract the interaction signatures from the program output report (counting the number of interactions of each type). PLIP descriptors include H-bond and Hal-bond formation, hydrophobic interactions, pi-Cation and pi-Stacking interaction, and formation of salt bridges (if present in the structure).
H-Bond Formation with the Hinge Region of ATP-Binding Pockets
This feature was calculated using the PLIP utility as well. For this purpose, we determined hinge region residues for each protein target based on multiple protein sequence alignments (hinge residues for the proteins of the set are available in the project’s Github repository). We prepared a bash-script to check for H-bond interactions of the ligand with these residues for each protein-ligand complex from PLIP report files and to run the process automatically.
Solvation Energies of the Ligands
To better understand the solvation energy change between unbound and bound states of ligands, we calculated solvation energies of the ligands in an unbound state in water solution for all of the dataset compounds based on the R6 Generalized Born Model.32 The tool calculates several values including polar and nonpolar components of solvation energy and electrostatic potential energy and requires an input file in PQR format, containing partial charge and atom radius information. To convert MOL2 format to PQR we used the ACPYPE tool (AnteChamber PYthon Parser interfacE).33
Number of Atoms and Number of Rotational Bonds in a Ligand
Additionally, we added two descriptors – the number of atoms in a ligand and the number of rotational bonds in a ligand, calculated with ICM tools.
Machine Learning Models Construction
We built two regression models to predict the activity of protein-ligand complexes: one is a Random Forest (RF) based model and the other is a Deep Neural Network (DNN) model based on the Python package Keras.34 All operations for dataset processing were performed with the Pandas module. Numerical features were normalized by Z-score (z = (x–x_m)/s, where x_m is the sample mean, and s is the sample standard deviation), assuming that most of the features have standard distribution. For categorical features, we used the one-hot encoding technique to allow incorporation with numerical features and introduction to the machine learning solver.
Five features were treated as categorical: target (complex forming protein), primary_target (primary target for the given ligand) and H-bond formation with the 3 residues in the hinge region (since these values are usually either 0 or 1).
After feature preparation, we have randomly split the dataset into a training set (1600 complexes) and a validation set (5047 complexes), roughly 3:1. The validation set was used to fine-tune the models’ hyperparameters.
To examine the effect of the structural similarity of ligands on prediction results, we prepared an additional small test set, consisting of 15 compounds that were fully excluded from training and validation sets. To choose these 15 compounds we performed cluster analyses of all ligands in the dataset based on a compressed hierarchical clustering algorithm35 using structure fingerprints36 in order to elucidate the most dissimilar compounds (we chose compounds forming single clusters with a similarity threshold of 0.5). These compounds were selected as an additional test set (Supplementary Figure S1) with 435 experimental activities in the range 5.1–9.3 pKi. This test set was used one time to assess the ML models’ accuracy on the challenging molecules (structural outliers) and was not used for the training and the hyperparameter fine-tuning.
To optimize the number of trees for the RF model, we analyzed the validation curve from the sklearn.learning_curve tool for a range of tree numbers (5, 10, 15, 25, 50, 100, 200, 400, and 800). RandomForestRegressor was used as an estimator, and the optimization was conducted on the training set with 5-fold cross validation. The mean validation accuracy (R2) was used to plot the validation curve (Figure S2). We observed a plateau on the validation curve approximately between 200 and 400 estimators (Supplementary Figure S2). For that reason, we have chosen the number of estimators to be 300, trained the RF model again with 3-fold cross validation, and estimated resulted accuracy additionally on the validation set.
To build the deep learning model we used the Sequential model from the Keras package and added 3 fully connected dense layers with 512 nodes each (dropout=0.3, regularization l1=1e-5 and l2=1e-5, activation function - ReLU) and 1 output layer for regression (Figure 2).
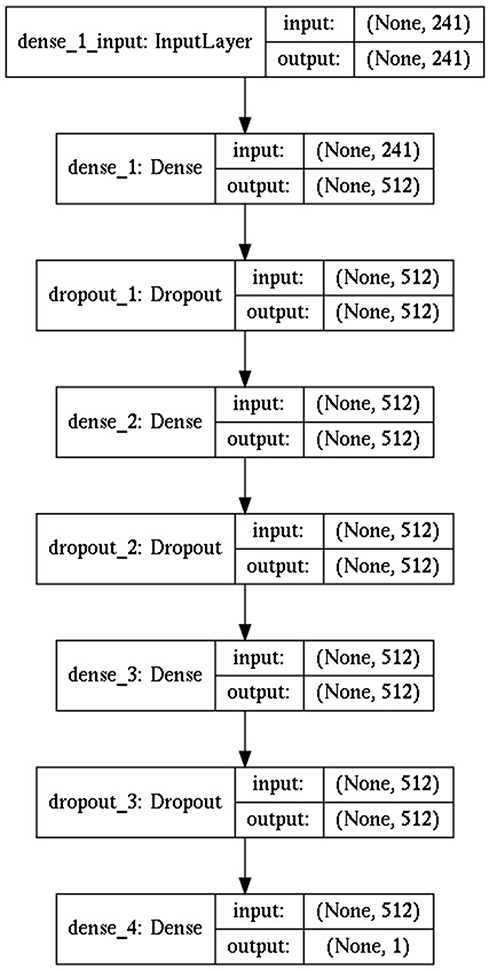 |
Figure 2 DNN model architecture scheme. |
The following parameters were set for model training: batch size is 10 (batch_size), maximum number of epochs is 100. The root-mean-square error (RMSE) was used as a loss function for model training. We used early stopping implementation in Keras to stop the training if there was no improvement of loss function for the validation set for 10 steps in a row (Supplementary Figure S3). The model weights giving the lowest loss function on a validation set were saved and used finally for the test set evaluation.
Hyperparameters tuning was performed by probing several different combinations of the number of layers (1–3), the numbers of nodes (128, 264, 512, 1024, 2048), dropout level (10%, 20%, 30%, 40%, 50%), L1 and L2 regularizations (0.001, 0.0001, 0.00001), and the batch size (10, 20, 50, 100, 200). We changed hyperparameters one at a time and trained the model for 100 epochs by tracking the loss of the validation set. We paid attention to the training/validation accuracy gap (overfitting effect), training speed, and stability of training.
Results and Discussion
Target Similarity Implies the Similarity of Target Activity Profiles
It is known that in many cases very similar or related proteins show similar activity for the same compounds. Many target prediction methods are based on this idea, utilizing protein sequence similarities and compound structural similarities in different ways.15,37–39 To investigate this dependency, we calculated pairwise protein-protein similarities of two types: sequence similarity and similarity of physicochemical properties of the ATP-pockets (APF score), as described in the Methods section. To account for the similarity of activity profiles, we calculated the Pearson correlation coefficient for the activity values of the common compounds for each protein-protein pair for each of the receptors in our dataset. To ensure the significance of the Pearson correlation coefficient, we set the minimum number of common compounds with known activities to be 100.
Figure 3 shows the normalized values for the pairwise Sequence similarities and pocket APF similarities versus pairwise activity correlations.
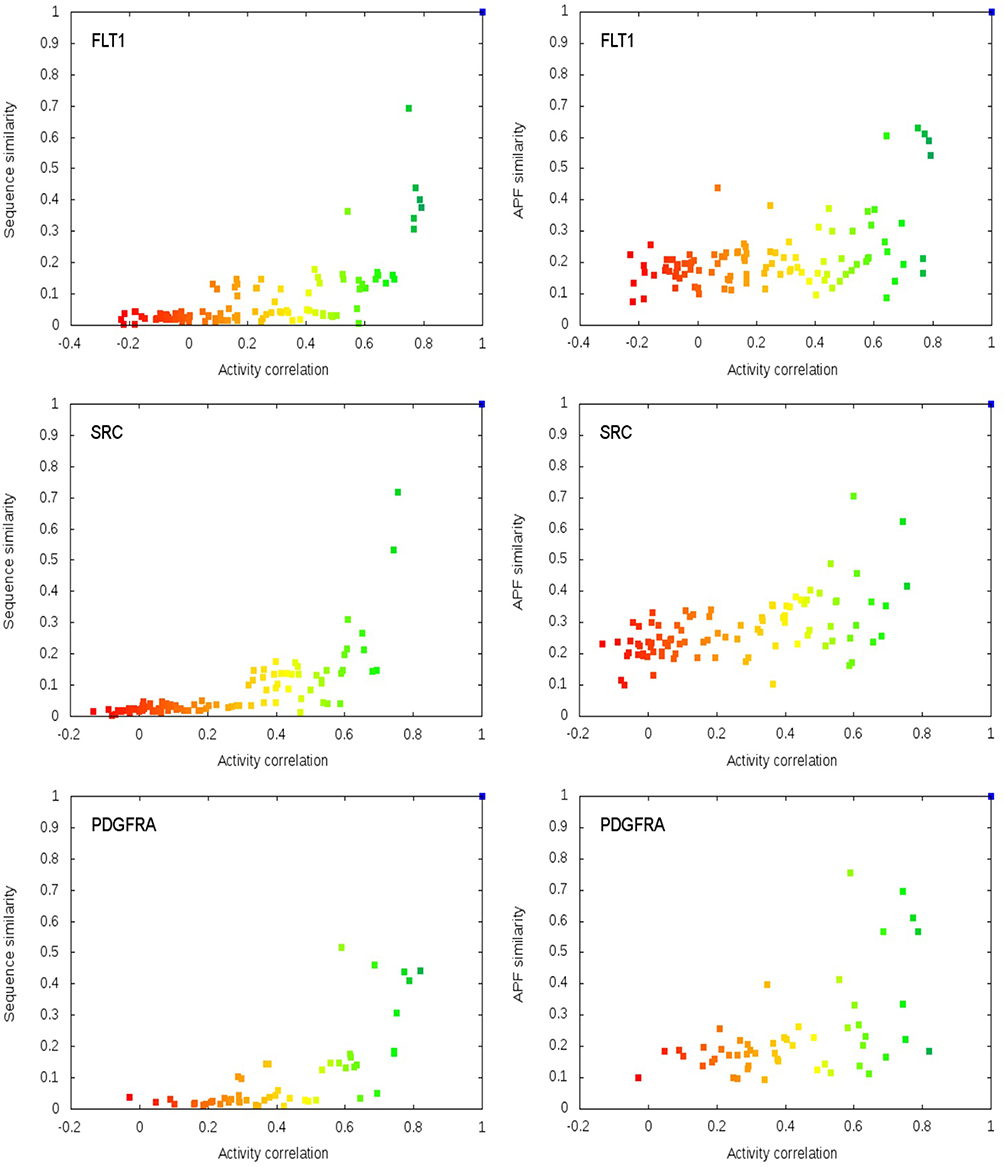 |
Figure 3 Relationships between protein–protein similarity and pairwise activity correlations for several kinases in the dataset. (Each dot represents a protein–protein pair in the 104 kinase structural dataset.) Sequence similarity on the left, and similarity in APF pockets on the right (colour gradient corresponds to activity correlation values). |
Most of the dots on these plots fall into the area of the lower-right corner on the plot space (area of higher activity correlation and lower protein similarity). This is especially prominent for the sequence similarity plots. Few points appear in the upper-right corner (area of high protein similarity and lower activity correlation) and even those fall close to the diagonal line. Interestingly, the dots on the APF plots are more spread comparing to a corresponding sequence similarity plot, even though overall, these plots are similar. Moreover, we found that for highly relative pairs of proteins, these plots are highly similar (Figure 4).
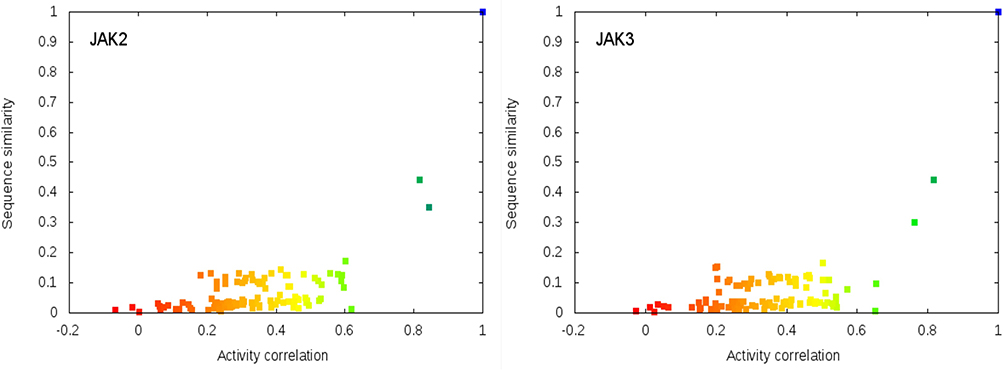 |
Figure 4 Comparison of the pairwise sequence similarity versus activity correlations plots for a pair of relative kinases. |
Overall, there is no clear correlation between kinase similarity and similarity of activity profiles. Nevertheless, these plots suggest that two highly similar proteins have a high probability of having very similar activity profiles (higher right corner of the plot area). However, two proteins may demonstrate relatively high activity profile correlation even if they are not structurally similar (lower left corner of the plot area). In this case, it is likely that some other features of these proteins are responsible for the activity profile similarity.
Based on these findings, we chose target similarity as an important feature that should be accounted for in the machine learning model. To incorporate this feature as a descriptor for protein-ligand complexes, we introduced the concept of a primary target, assuming that the highest activity target is known for each compound (see Methods). When we have candidate compounds for a particular kinase and wish to investigate their off-target activities, our predictive model will be applicable, assuming that this kinase is the compounds’ primary target. (Potential pitfalls of this argument and how to mitigate them will be discussed later.) For our dataset, the primary target of each compound is the target with the highest activity (in terms of pKi available from the experimental activity data). Thus, for each protein-ligand complex, we can now introduce a new feature, the pairwise similarity between this protein and the compound’s primary target. As will be shown later, this feature plays a powerful role in activity prediction.
Docking Accuracy Issue
We decided to generate protein-ligand complexes using molecular docking, because our activity prediction model should be used in a situation where the compounds being investigated are unlikely to have been co-crystallized with all the kinases of interest. We should, then, keep in mind that any docking protocol has limited accuracy due to different reasons, ranging from the lack of (or inaccurate) structural data (such as protein flexibility, binding cofactors, or mediating water molecules) to the probabilistic nature of docking algorithms. All these factors can lead to inaccurate ligand conformations, which is critical for the accuracy of the activity prediction model.
In 68% of cases, the highest scoring docking pose was satisfactory (<2Å RMSD to the crystal structure) and in 52% of cases, the highest scoring pose was <1Å RMSD from the crystal pose. In 59% of the cases, the highest scoring pose was found to be the closest to the crystal structure. For the remaining 41%, the most accurate pose was not scored the highest but was usually conformationally close to the highest scoring pose. Therefore, we assumed that it would be reasonable to use only the highest scoring docking conformation for our analysis.
Random Forest (RF) and Deep Neural Network (DNN) Models Showing Similar Accuracy for Activity Prediction
We built two regression models, using RF and DNN, to predict the activity of protein-ligand complexes. To analyze the accuracy of these models, we used the Pearson correlation, RMSE and 1-fold and 2-fold error metrics. The 1-fold and 2-fold error metric represents the ratio of points with prediction errors exceeding 1 or 2 pKi (10 and 100 Ki, respectively) and therefore, these metrics are more intuitive to assess the prediction performance. Both models showed similar accuracy for the validation and test sets in terms of RMSE (see Table 1). The RF model was much more overtrained than the DNN model, because for the DNN model, we used an early stopping technique to stop model training when accuracy did not improve for the validation set, in order to prevent overtraining.
 |
Table 1 Comparing RF and DNN Model Accuracy |
The Pearson correlation coefficients for the test set were relatively poor for the following possible reason. The test set was prepared specifically to represent the compounds that are structurally most distant from the training and validation datasets. The activity data for this subset had a distribution different from the training or validation datasets, which were formed by random splitting (Figure 5); the external test dataset consists of 435 activity data points with pKi mostly lying in the narrow range of 5.5–7.0 pKi. This observation explains the lower correlation of predicted accuracy for the test set.40 To address this issue with Pearson correlation, we also used other statistical metrics as mentioned above.
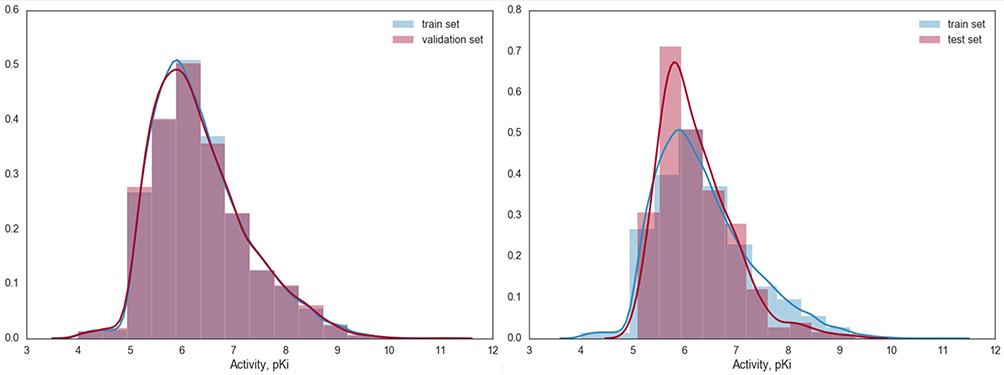 |
Figure 5 Distribution densities for the activity values in the training and validation subsets (on the left) in comparison to the training and test sets (on the right). |
Overall, both models demonstrate low RMSE for the validation and test set, which means that most of the predictions for the validation and test set are located in the area within ±2 pKi from the diagonal line on the scatter plot (2-fold error less than 1% for all subsets in both models) (Figure 6). Predictions for the test set fall in the same area as the validation set, that can be proved as well by very close values of RMSE and 1-fold and 2-fold errors for the test and validation sets. This proves that our models are unbiased to the structural similarity of the tested ligands to training set ligands (since the test set consists of 15 compounds which are structurally the most different from the other compounds and were fully excluded from both training and validation sets).
 |
Figure 6 Performance of activity prediction models: a) DNN model and b) RF model. |
To investigate the feature importance in constructed models we used the feature_importances_ module from Sklearn for the RF model. From the bar plot in Figure 7 we can see that the features associated with primary target information (protein-protein similarity features) are at the top of the list.
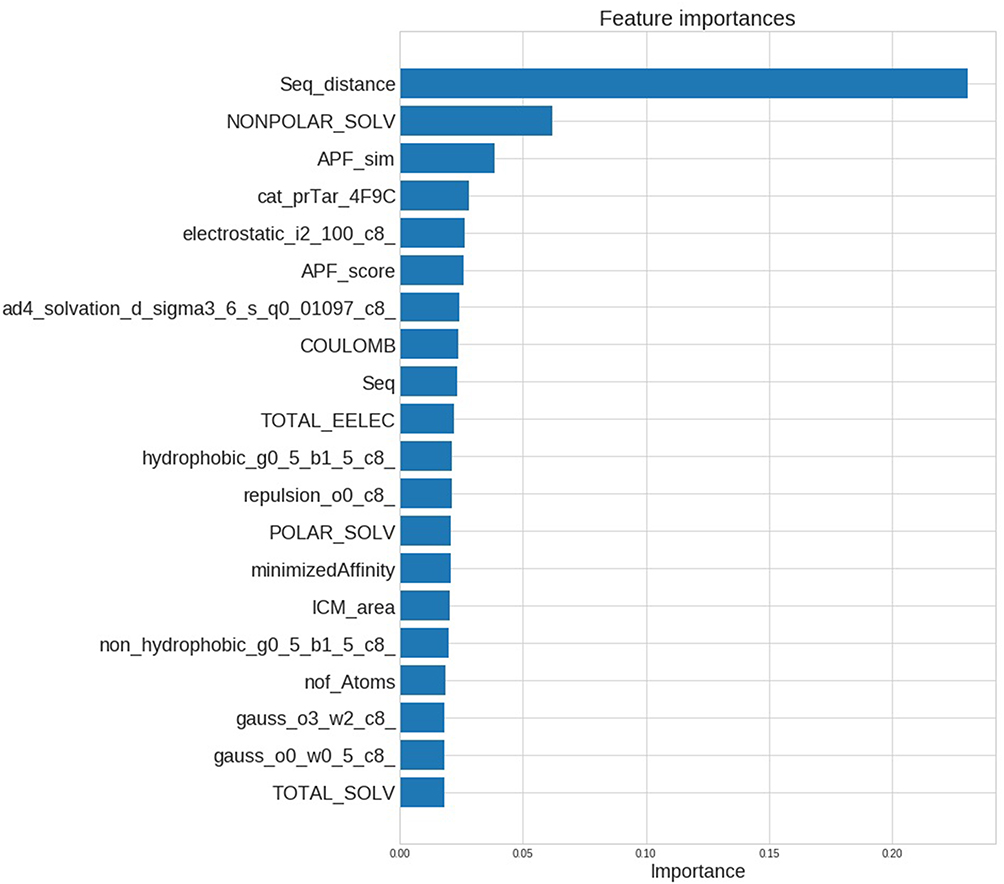 |
Figure 7 Top list of features sorted by its estimated importance based on RF model. |
Incorrect Primary Target Assignment Greatly Affects Activity Prediction
To investigate the effect of incorrect primary target information on the prediction accuracy of our models, we simulated two test cases.
For the first test case, we prepared the test set based on the validation set, where for a primary target we assigned the protein with the lowest activity for a given compound (overall activity range for these protein-ligand pairs was 4–6 pKi). Accordingly, we changed the protein-protein similarity metrics of these compounds to reproduce a real-case scenario, when the “primary target” was assigned wrongly for the input compound.
In the second test case, we simulated the situation where the primary target does not have the highest but instead has average-range activity for a test ligand. The activity range for primary target – ligand pairs in this test set is 7–8 pKi.
Descriptors for both test sets were processed in the same way as for the original dataset, and activities were predicted with pre-trained DNN and RF models.
The results of the activity prediction for the two test scenarios are presented on the scatterplots in Figure 8.
 |
Figure 8 Prediction accuracy test for the cases with wrongly assigned primary targets: primary targets with low activity (pK i < 6) on the left; and primary targets with average activity (7 < pK i < 8) on the right. |
Prediction for the first test is mostly wrong for both models. For the second test, we can see that protein-ligand pairs with high activities were considerably underestimated while low and average activity complexes resulted in the similar accuracy as the original dataset.
Investigating Alternative Model Without Primary Target Information
In the real-life process of computational drug design, we often do not have strong evidence to assign “primary targets” for a tested compound. As we have shown, the primary target associated features are among the strongest predictors and the incorrectly assigned “primary targets” affect prediction performance greatly. As a result, we decided to investigate how exclusion of such information would affect the model potency and whether this alternative model based on a reduced predictor set may still be useful for kinase prioritizing analysis.
We excluded from the original dataset all descriptors associated with “primary target”, including sequence similarity and APF pocket similarity. In total, we excluded 108 features: 104 resulted from splitting of the primary_target categorical feature and four are sequence and APF similarities, raw and normalized, as described in the methods section (do not confuse with Z-score normalization). After that, we re-trained both models with no other changes in model construction or data preparation and model training protocols.
The resultant accuracy for validation and test sets was lower for both models, as expected (Figure 9).
 |
Figure 9 Performance of activity prediction models trained on the dataset without primary target. |
Pearson correlation for the validation set decreased from 0.73 to 0.63 and from 0.71 to 0.61 in the RF and DNN models, respectively, RMSE increased from 0.63 to 0.72 for the RF model and similarly from 0.64 to 0.72 for the DNN model for the validation set. However, elimination of the most potent features resulted in an observable drop in predictive accuracy. Therefore, when there is a lack of evidence for the primary target having a high activity for the tested compound, we will recommend using this alternative model trained on the data with no primary target information.
Performance of Developed Activity Prediction Methods
Regarding the predicting accuracy of our approach we assume that the main source of error in our predicting models may be introduced due to incorrect ligand conformation in the protein pocket resulting from docking, since, as we discussed above, molecular docking has limited accuracy in both pose prediction and pose scoring.
There are many factors affecting docking accuracy, including ligand flexibility and size, in addition to receptor conformational flexibility and the possibility of having several conformational states (like the open/closed position of the activating loop in kinase proteins). In addition, the filtering of incorrect docking poses is a very non-trivial task, especially when it comes to large-scale analysis. Therefore, if more sophisticated docking protocol is proposed, it could significantly improve the performance of our designed activity prediction model.
The other important point is the composition of the training dataset. The dataset used in this work contained compounds whose activity data had a narrow activity range, which was later reflected in the correlation values. In addition, for many compounds the strongest activity value was relatively low (pKi > 6), ie, for such compounds, we did not have examples of “good” targets. We expect that expanding the activity dataset will lead to a better more robust model, although using different sources for activity data may introduce errors associated with the differences in experimental approaches, which would need to be accounted for.
Conclusion
In this work, we developed a set of descriptors characterizing protein–ligand interaction and demonstrated the effectiveness of activity prediction based on these descriptors using two machine-learning models: RF and DNN.
Both models demonstrate relatively high prediction accuracy in terms of the RMSE. Descriptors that we used included very limited information on ligand structure; therefore, our method is unbiased to structural similarity of training set compounds, which is an important advantage for a machine-learning-based method. We have proved this by using a test dataset consisting of ligands that are structurally most distant from both training and validation datasets. This feature makes the developed machine learning method highly prospective for the prediction of off-target activity for novel kinase inhibitors.
The other advantage of the developed approach is that it is based on docking obtained from complex structures so it could be applied for novel compounds which usually do not have X-ray structures of their co-crystallized complexes. Using docking obtained complexes to predict activity in other machine learning models built upon complex crystal data may result in much worse prediction accuracy than reported, due to the limited accuracy of docking.
Data availability
The scripts and datasets are available at https://github.com/arinaafan/predict_Kinase.git.
Acknowledgments
We thank Andrew Myers for a critical review of the manuscript and valuable discussion.
Funding
This research was supported by Japan Agency for Medical Research and Development (AMED) under the Grant Number JP18ak0101102.
Disclosure
Kenji Mizuguchi and Chioko Nagao report grant from Taisho Pharmaceutical Co., Ltd. Kenji Mizuguchi reports grants from Asahi Kasei Pharma Corporation, and Shionogi Co., Ltd., Lifematics Inc., Suntory Wellness Ltd., non-financial support from AstraZeneca plc, and grants and non-financial support from Mitsubishi Tanabe Pharma, outside the submitted work. The authors report no other potential conflicts of interest for this work.
References
1. Soth M, Hermann JC, Yee C, et al. 3-Amido pyrrolopyrazine JAK kinase inhibitors: development of a JAK3 vs JAK1 selective inhibitor and evaluation in cellular and in vivo models. J Med Chem. 2012;56(1):345–356. doi:10.1021/jm301646k
2. Levine RL, Pardanani A, Tefferi A, Gilliland DG. Role of JAK2 in the pathogenesis and therapy of myeloproliferative disorders. Nat Rev Cancer. 2007;7(9):673. doi:10.1038/nrc2210
3. Zhang J, Yang PL, Gray NS. Targeting cancer with small molecule kinase inhibitors. Nat Rev Cancer. 2009;9(1):28. doi:10.1038/nrc2559
4. Zhang S, Yu D. Targeting Src family kinases in anti-cancer therapies: turning promise into triumph. Trends Pharmacol Sci. 2012;33(3):122–128. doi:10.1016/j.tips.2011.11.002
5. Olson JM, Hallahan AR. p38 MAP kinase: a convergence point in cancer therapy. Trends Mol Med. 2004;10(3):125–129. doi:10.1016/j.molmed.2004.01.007
6. Fischer PM, Lane DP. Inhibitors of cyclin-dependent kinases as anti-cancer therapeutics. Curr Med Chem. 2000;7(12):1213–1245. doi:10.2174/0929867003374048
7. Brunelleschi S, Penengo L, Santoro MM, Gaudino G. Receptor tyrosine kinases as target for anti-cancer therapy. Curr Pharm Des. 2002;8(22):1959–1972. doi:10.2174/1381612023393530
8. Morgensztern D, McLeod HL. PI3K/Akt/mTOR pathway as a target for cancer therapy. Anticancer Drugs. 2005;16(8):797–803. doi:10.1097/01.cad.0000173476.67239.3b
9. Keller DA, Brennan RJ, Leach KL. Clinical and nonclinical adverse effects of kinase inhibitors. In: Urban L, Patel V, Vaz RJ, editors. Antitargets and Drug Safety. Vol. 66. John Wiley & Sons; 2015:365–400.
10. Tsai J, Lee JT, Wang W, et al. Discovery of a selective inhibitor of oncogenic B-Raf kinase with potent antimelanoma activity. Proc Natl Acad Sci. 2008;105(8):3041–3046.
11. Robert C, Soria J-C, Spatz A, et al. Cutaneous side-effects of kinase inhibitors and blocking antibodies. Lancet Oncol. 2005;6(7):491–500. doi:10.1016/S1470-2045(05)70243-6
12. Treiber DK, Shah NP. Ins and outs of kinase DFG motifs. Chem Biol. 2013;20(6):745–746. doi:10.1016/j.chembiol.2013.06.001
13. Zuccotto F, Ardini E, Casale E, Angiolini M. Through the “gatekeeper door”: exploiting the active kinase conformation. J Med Chem. 2009;53(7):2681–2694. doi:10.1021/jm901443h
14. Cohen MS, Zhang C, Shokat KM, Taunton J. Structural bioinformatics-based design of selective, irreversible kinase inhibitors. Science. 2005;308(5726):1318–1321. doi:10.1126/science1108367
15. Christmann-Franck S, van Westen GJ, Papadatos G, et al. Unprecedently large-scale kinase inhibitor set enabling the accurate prediction of compound–kinase activities: a way toward selective promiscuity by design? J Chem Inf Model. 2016;56(9):1654–1675. doi:10.1021/acs.jcim.6b00122
16. Stepniewska-Dziubinska MM, Zielenkiewicz P, Siedlecki P. Development and evaluation of a deep learning model for protein-ligand binding affinity prediction. Bioinformatics. 2018;1:9.
17. Jiménez J, Skalic M, Martínez-Rosell G, De Fabritiis G. K DEEP: protein–ligand absolute binding affinity prediction via 3D-convolutional neural networks. J Chem Inf Model. 2018;58(2):287–296. doi:10.1021/acs.jcim.7b00650
18. Fukunishi Y, Yamashita Y, Mashimo T, Nakamura H. Prediction of protein−compound binding energies from known activity data: docking‐score‐based method and its applications. Mol Inf. 2018;37:1700120. doi:10.1002/minf.201700120
19. Pliakos K, Vens C, Tsoumakas G. Predicting drug-target interactions with multi-label classification and label partitioning. IEEE/ACM Trans Comput Biol Bioinform. 2019.
20. Whitehead TM, Irwin BW, Hunt P, Segall MD, Conduit GJ. Imputation of assay bioactivity data using deep learning. J Chem Inf Model. 2019;59(3):1197–1204. doi:10.1021/acs.jcim.8b00768
21. Xu Y, Ma J, Liaw A, Sheridan RP, Svetnik V. Demystifying multitask deep neural networks for quantitative structure–activity relationships. J Chem Inf Model. 2017;57(10):2490–2504. doi:10.1021/acs.jcim.7b00087
22. Toplak M, Močnik R, Polajnar M, et al. Assessment of machine learning reliability methods for quantifying the applicability domain of QSAR regression models. J Chem Inf Model. 2014;54(2):431–441. doi:10.1021/ci4006595
23. Metz JT, Johnson EF, Soni NB, Merta PJ, Kifle L, Hajduk PJ. Navigating the kinome. Nat Chem Biol. 2011;7(4):200–202. doi:10.1038/nchembio.530
24. Abagyan R, Totrov M, Kuznetsov D. ICM – a new method for protein modeling and design: applications to docking and structure prediction from the distorted native conformation. J Comput Chem. 1994;15(5):488–506. doi:10.1002/jcc.540150503
25. Totrov M. Atomic property fields: generalized 3D pharmacophoric potential for automated ligand superposition, pharmacophore elucidation and 3D QSAR. Chem Biol Drug Des. 2007;71(1):15–27. doi:10.1111/j.1747-0285.2007.00605.x
26. Needleman SB, Wunsch CD. A general method applicable to the search for similarities in the amino acid sequence of two proteins. J Mol Biol. 1970;48(3):443–453. doi:10.1016/0022-2836(70)90057-4
27. Trott O, Olson AJ. AutoDock Vina: improving the speed and accuracy of docking with a new scoring function, efficient optimization, and multithreading. J Comput Chem. 2010;31(2):455–461.
28. Mysinger MM, Carchia M, Irwin JJ, Shoichet BK. Directory of useful decoys, enhanced (DUD-E): better ligands and decoys for better benchmarking. J Med Chem. 2012;55(14):6582–6594. doi:10.1021/jm300687e
29. O’Boyle NM, Banck M, James CA, Morley C, Vandermeersch T, Hutchison GR. Open Babel: an open chemical toolbox. J Cheminformatics. 2011;3(1):33. doi:10.1186/1758-2946-3-33
30. Wang R, Lai L, Wang S. Further development and validation of empirical scoring functions for structure-based binding affinity prediction. J Comput Aided Mol Des. 2002;16(1):11–26. doi:10.1023/A:1016357811882
31. Salentin S, Schreiber S, Haupt VJ, Adasme MF, Schroeder M. PLIP: fully automated protein–ligand interaction profiler. Nucleic Acids Res. 2015;43(W1):W443–W447. doi:10.1093/nar/gkv315
32. Aguilar B, Onufriev AV. Efficient computation of the total solvation energy of small molecules via the R6 generalized born model. J Chem Theory Comput. 2012;8(7):2404–2411. doi:10.1021/ct200786m
33. da Silva AWS, Vranken WF. ACPYPE-antechamber python parser interface. BMC Res Notes. 2012;5(1):367. doi:10.1186/1756-0500-5-367
34. Chollet F. Keras: deep learning library for theano and tensorflow; 2015. Available from: https://keras.io/k.
35. Johnson SC. Hierarchical clustering schemes. Psychometrika. 1967;32(3):241–254. doi:10.1007/BF02289588
36. O’Boyle NM, Sayle RA. Comparing structural fingerprints using a literature-based similarity benchmark. J Cheminformatics. 2016;8(1):36. doi:10.1186/s13321-016-0148-0
37. Gfeller D, Grosdidier A, Wirth M, Daina A, Michielin O, Zoete V. SwissTargetPrediction: a web server for target prediction of bioactive small molecules. Nucleic Acids Res. 2014;42(W1):W32–W38. doi:10.1093/nar/gku293
38. Bleakley K, Yamanishi Y. Supervised prediction of drug–target interactions using bipartite local models. Bioinformatics. 2009;25(18):2397–2403. doi:10.1093/bioinformatics/btp433
39. Gonen M. Predicting drug-target interactions from chemical and genomic kernels using Bayesian matrix factorization. Bioinformatics. 2012;28(18):2304–2310. doi:10.1093/bioinformatics/bts360
40. Goodwin LD, Leech NL. Understanding correlation: factors that affect the size of r. J Exp Educ. 2006;74(3):249–266. doi:10.3200/JEXE.74.3.249-266
 © 2020 The Author(s). This work is published and licensed by Dove Medical Press Limited. The
full terms of this license are available at https://www.dovepress.com/terms
and incorporate the Creative Commons Attribution
- Non Commercial (unported, 3.0) License.
By accessing the work you hereby accept the Terms. Non-commercial uses of the work are permitted
without any further permission from Dove Medical Press Limited, provided the work is properly
attributed. For permission for commercial use of this work, please see paragraphs 4.2 and 5 of our Terms.
© 2020 The Author(s). This work is published and licensed by Dove Medical Press Limited. The
full terms of this license are available at https://www.dovepress.com/terms
and incorporate the Creative Commons Attribution
- Non Commercial (unported, 3.0) License.
By accessing the work you hereby accept the Terms. Non-commercial uses of the work are permitted
without any further permission from Dove Medical Press Limited, provided the work is properly
attributed. For permission for commercial use of this work, please see paragraphs 4.2 and 5 of our Terms.