Back to Journals » Cancer Management and Research » Volume 11
Determining the optimal cutoff point for lymph node density and its impact on overall survival in children with Wilms’ tumor
Authors Pan Z, Bu Q, You H ![]() , Yang J, Liu Q, Lyu J
, Yang J, Liu Q, Lyu J ![]()
Received 8 October 2018
Accepted for publication 31 December 2018
Published 15 January 2019 Volume 2019:11 Pages 759—766
DOI https://doi.org/10.2147/CMAR.S190138
Checked for plagiarism Yes
Review by Single anonymous peer review
Peer reviewer comments 3
Editor who approved publication: Dr Rituraj Purohit
Zhenyu Pan,1–3,* Qingting Bu,4,* Haisheng You,5 Jin Yang,1,2 Qingqing Liu,1,2 Jun Lyu1,2
1Clinical Research Center, The First Affiliated Hospital of Xi’an Jiaotong University, Xi’an, Shaanxi, People’s Republic of China; 2School of Public Health, Xi’an Jiaotong University Health Science Center, Xi’an, Shaanxi, People’s Republic of China; 3Department of Pharmacy, The Affiliated Children Hospital of Xi’an Jiaotong University, Xi’an, Shaanxi, People’s Republic of China; 4Department of Genetics, Northwest Women’s and Children’s Hospital, Xi’an, Shaanxi, People’s Republic of China; 5Department of Pharmacy, The First Affiliated Hospital of Xi’an Jiaotong University, Xi’an, Shaanxi, People’s Republic of China
*These authors contributed equally to this work
Objective: Previous studies showed that the lymph node density (LND) was a predictor of survival in Wilms’ tumor (WT). However, the optimal LND cutoff point is controversial due to methodological shortcomings of previous studies, and no studies have shown the effect of LND on survival in children with WT. The purpose of this study was to remedy this situation.
Methods: We identified 376 children with WT. LND cutoff point was determined using the median value, the X-tile program, the survival-tree algorithm, and the time-dependent ROC curve analysis. Survival functions were estimated by the Kaplan–Meier method. We used Cox regression analysis to determine the impact of LND on survival. Smooth curve fitting between relative mortality risk and LND was performed.
Results: The LND cutoff point was 0.44, 0.65, 0.65, and 0.64 according to the median value, the X-tile program, the survival-tree algorithm, and the time-dependent ROC curve analysis, respectively. The 5-, 10-, and 20-year overall survival rates were 86.9%, 86.9%, and 84.7%, respectively, in the <0.44 group and 81.3%, 80.3%, and 80.3%, respectively, in the ≥0.44 group. Survival did not differ significantly between the two groups (P=0.185). The 5-, 10-, and 20-year overall survival rates were 87.8%, 87.8%, and 86.0%, respectively, in the < 0.65 or < 0.64 group and 76.5%, 75.1%, and 75.1%, respectively, in the ≥ 0.65 or ≥ 0.64 group. Children with the high LND had a significantly worse survival (P=0.011) if 0.64 or 0.65 was used for the stratification. LND was a significant predictor for overall survival in the multivariate Cox regression analysis (HR =1.797; 95% CI, 1.043–3.097; P=0.035). Smooth curve fitting suggested that the risk of mortality tended to be ascending with the increase in LND in general.
Conclusion: The three methods including the X-tile program, the survival-tree algorithm, and the time-dependent receiver operating characteristic (ROC) curve analysis are equivalent in their ability to stratify patients and clearly better than the median method. The results showed that the optimal LND cutoff point was around 0.65 and the LND was a reliable predictor of overall survival in children with WT.
Keywords: Wilms’ tumor, lymph node density, cutoff point, survival
Introduction
Wilms’ tumor (WT) is the most common pediatric renal tumor, representing approximately 90% of all pediatric renal tumors1 and 5% of all pediatric tumors.2 Although the overall survival rate exceeds 90% in patients with WT,3 reliable prognostic factors still need to be identified because they can be used to stratify patients in order to further improve the survival rate and reduce the intensity of chemotherapy or radiotherapy in situations where the prognosis is constant. The two recent studies of You et al4 and Saltzman et al5 showed that the lymph node density (LND) defined as the proportion of the number of positive lymph nodes (LNs) relative to the number of examined LNs can be used to stratify the prognosis in WT patients. Nevertheless, the impact of the LND on overall survival in children is unclear since all the previous studies also included adults. Furthermore, the optimal LND cutoff point is unclear. The cutoff point was determined by the classification and regression tree method available in the SPSS software in the study of You et al and as the median LND in the study of Saltzman et al. These studies4,5 did not consider that survival rates constitute time-dependent data. Three methods are commonly used to calculate an optimal cutoff point for time-dependent data as follows: 1) the X-tile program,6–9 2) the survival-tree algorithm, which involves a classification and regression tree that can deal with time-dependent data,10–12 and 3) the time-dependent receiver operating characteristic (ROC) curve analysis.13–17 However, no previous study has compared the effects of these three methods.
In this study, we compared these three methods with the median method in determining the optimal LND cutoff point in children with WT. We also determined the impact of the LND on overall survival in children with WT based on data in the Surveillance, Epidemiology, and End Results (SEER) database.
Methods
Patient selection and data acquisition
The SEER database is a free database covering the period from 1973 to 2014. It includes data from 18 population-based registries and covers 28% of the US population.18 The data of patients with WT are recorded according to the third edition of the International Classification of Diseases for Oncology (ICD-O-3). Patients whose ICD-O-3 histological diagnostic code is 8960 were included in this study, whereas patients were excluded if they were older than 18 years, had no examined LNs, or an LND of 0. The following information was collected for each patient: age at diagnosis, sex, race, number of examined LNs, SEER stage, tumor laterality, year of diagnosis, LND, follow-up time, and vital status. The year of diagnosis was stratified based on the treatment time defined by the National Wilms’ Tumor Study Group (NWTS)-2, -3, -4, and -5 trial publication times (in 1981, 1989, 1998, and 2001, respectively).19–22 The study is in accordance with the Declaration of Helsinki and approved by the institutional review board of the First Affiliated Hospital of Xi’an Jiaotong University. All analyses were based on a free database, and thus for this type of study, informed consent is not required.
Statistical analyses
The LND cutoff point was calculated based on the median LND, the X-tile program, the survival-tree algorithm, and the time-dependent ROC curve analysis. The X-tile program was implemented using X-tile software (http://tissuearray.org/). The survival-tree algorithm and the time-dependent ROC curve analysis were implemented using the Rpart package and the survivalROC package in the R platform. The Kaplan–Meier method was used to perform survival analysis. Survival curves were compared using the log-rank test and used to determine the optimal LND cutoff point, which was used to stratify the patients into low-LND and high-LND groups. The graphical relationship of LND with mortality risk was evaluated with smooth curve fitting based on the restricted cubic spline method. Smooth curve fitting was performed by Empower(R) software (www.empowerstats.com; X&Ysolutions, Inc., Boston, MA, USA).
The characteristics of patients were compared using Pearson’s chi-squared test or Student’s t-test for data that conformed to a normal distribution and using the Mann–Whitney U test for other data. The 5-, 10-, and 20-year survival rates were calculated based on life tables. Cox regression analysis was conducted to assess the prognostic significance of the potential risk factors, with risk factors that were significant in the univariate Cox regression analysis being included in the multivariate Cox regression analysis. A two-sided probability value of P≤0.05 was considered indicative of statistical significance. Statistical analyses were performed using SPSS 24.0 (IBM Corporation, Armonk, NY, USA) and R (version 3.4.3; http://www.r-project.org/).
Results
Characteristics of the patients
We included 376 patients with WT who conformed with the study inclusion criteria. These patients had a median age of 4 years, and a median of five LNs had been examined. Most of the patients were White (79.8%), had unilateral WT (98.9%), were diagnosed during 2000–2014 (67.6%), were female (56.1%), and had regional tumors (57.4%; the remaining 42.6% had distant tumors). The characteristics of the patients are presented in Table 1.
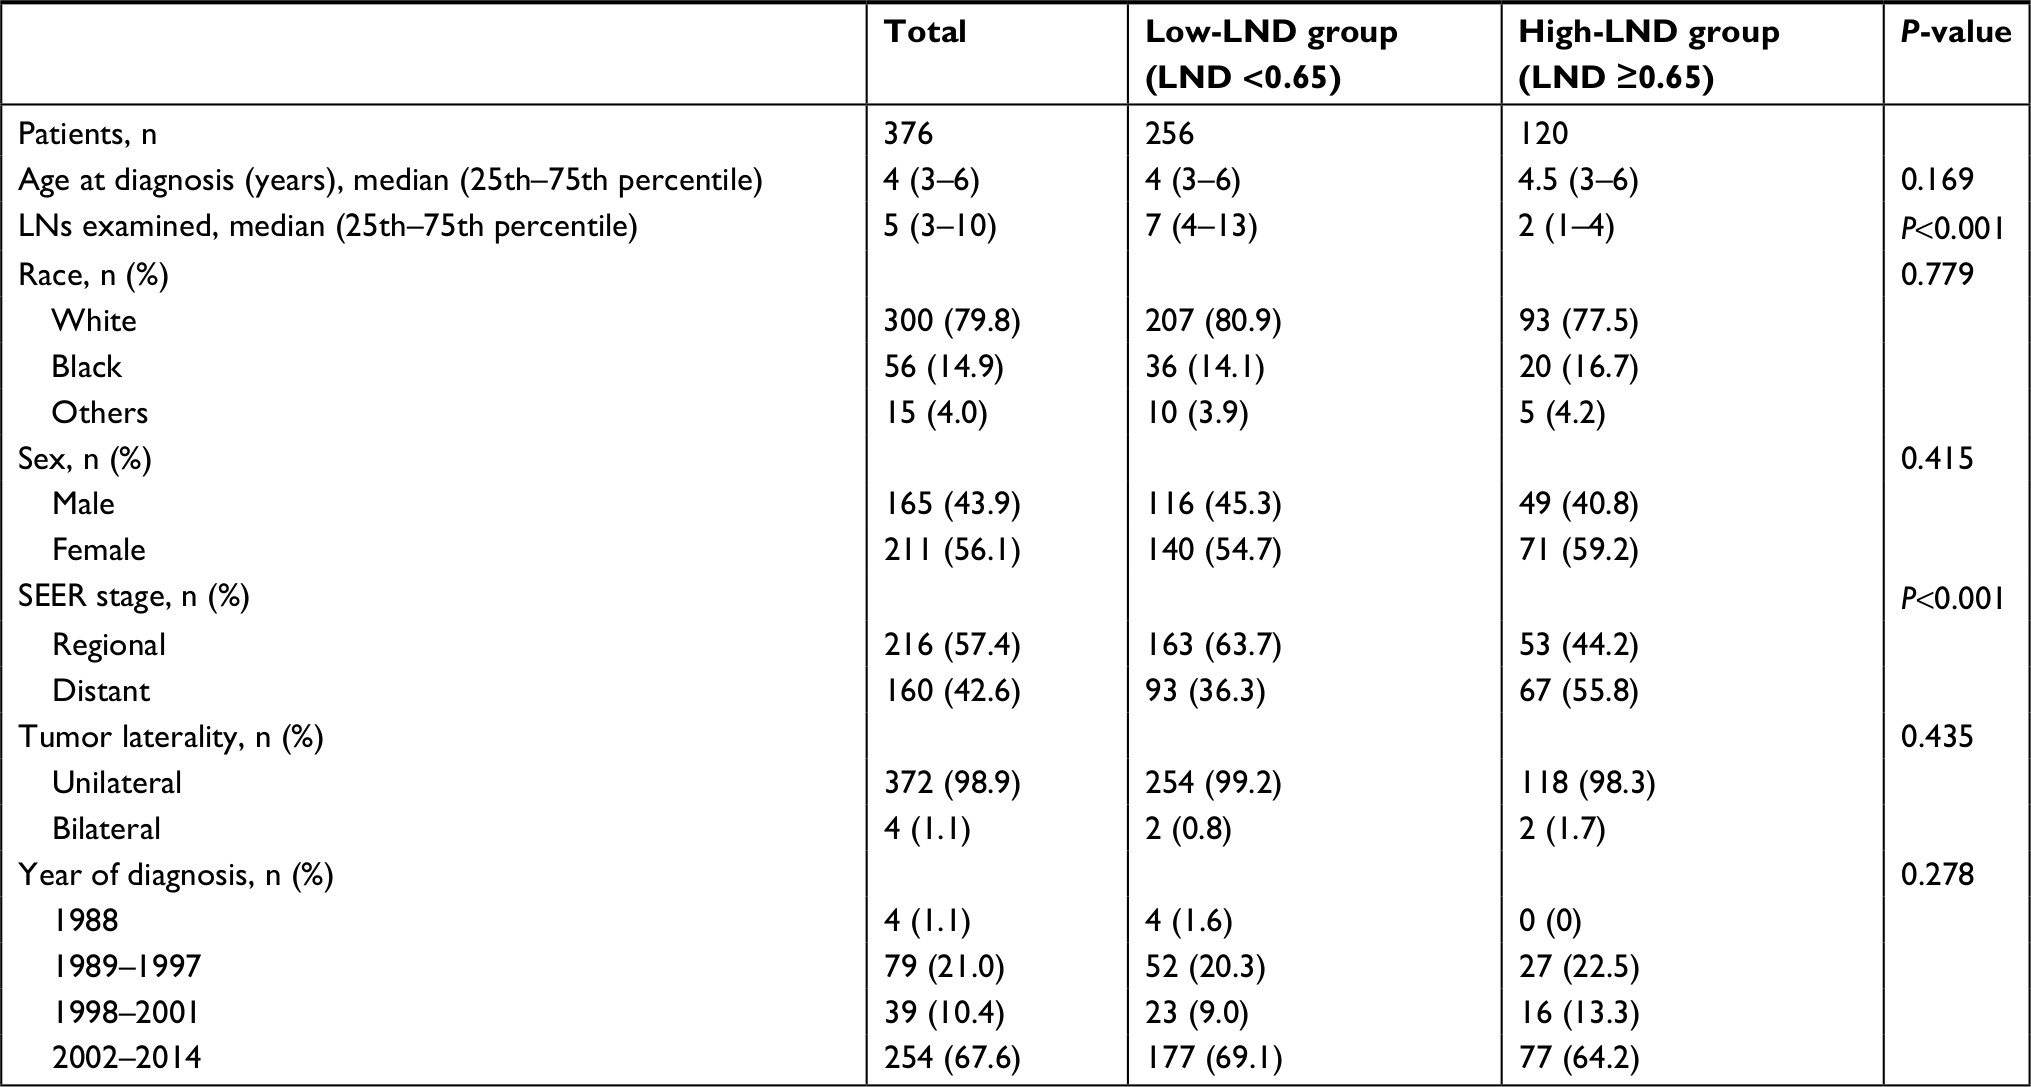 | Table 1 Characteristics of patients Abbreviations: LND, lymph node density; LNs, lymph nodes; SEER, Surveillance, Epidemiology, and End Results. |
Identification of the optimal LND cutoff point
The median LND of the 376 patients was 0.44, and so it was the cutoff point based on the median method. The X-tile program and survival-tree algorithm were constructed, both of which produced an LND cutoff point of 0.65. The cutoff point according to the time-dependent ROC curve analysis was 0.64. Figure 1 shows that patients were stratified according to the LND cutoff points, 0.44, 0.65, and 0.64.
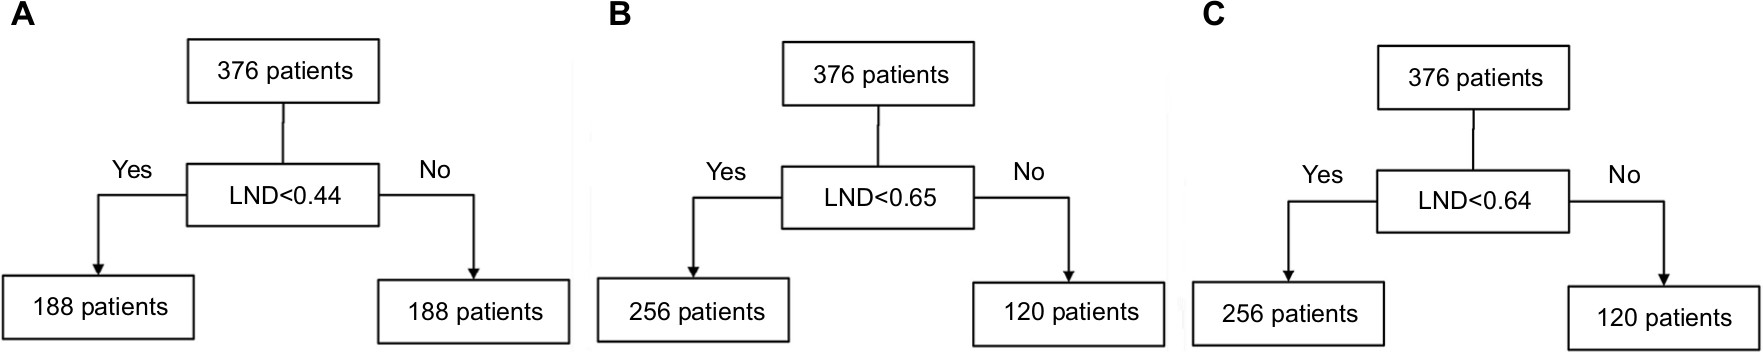 | Figure 1 Stratification of patients according to the LND cutoff points obtained using the median method, the X-tile program, the survival-tree algorithm, and the time-dependent ROC curve analysis. Note: (A) 0.44 as the LND cutoff point, (B) 0.65 as the LND cutoff point, and (C) 0.64 as the LND cutoff point. Abbreviations: LND, lymph node density; ROC, receiver operating characteristic. |
Survival analysis showed that the 5-, 10-, and 20-year overall survival rates were 86.9%, 86.9%, and 84.7%, respectively, in the <0.44 group and 81.3%, 80.3%, and 80.3%, respectively, in the ≥0.44 group. Survival did not differ significantly between the <0.44 and ≥0.44 groups (χ2=0.176, P=0.185) if the median LND of 0.44 was used for the stratification (Figure 2A). The 5-, 10-, and 20-year overall survival rates were 87.8%, 87.8%, and 86.0%, respectively, in the <0.65 group and 76.5%, 75.1%, and 75.1%, respectively, in the ≥0.65 group. The 5-, 10-, and 20-year overall survival rates in the <0.64 and ≥0.64 groups were the same as those in the <0.65 and ≥0.65 groups, respectively. Patients in the high-LND group had a significantly worse survival (χ2=6.416, P=0.011) if an LND of 0.64 or 0.65 was used for the stratification (Figure 2B and C).
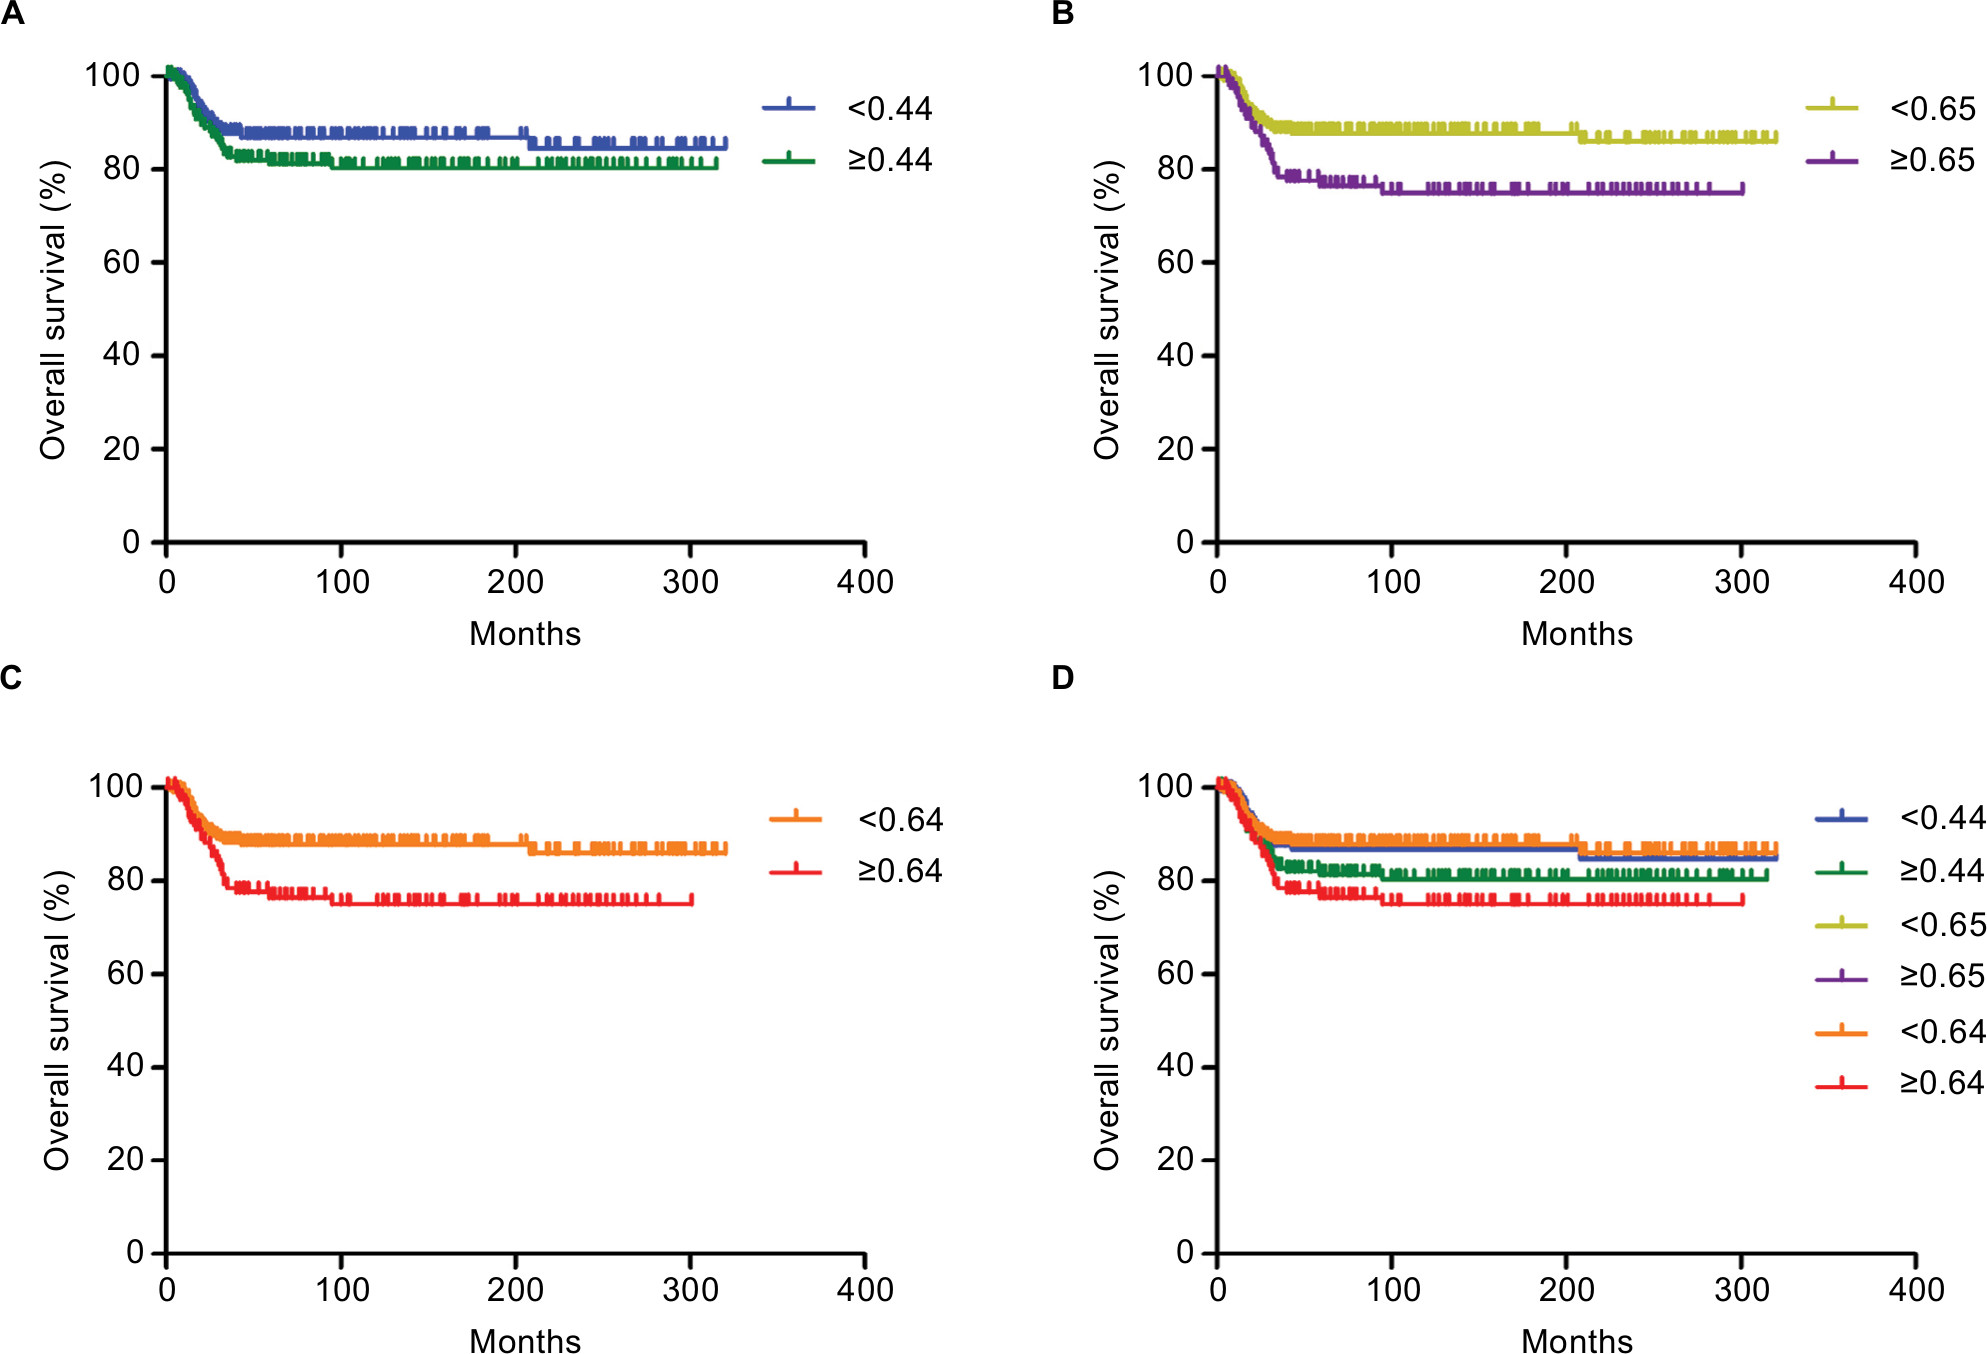 | Figure 2 Kaplan–Meier curve for evaluating the overall survival of children defined by different LND cutoff points. Notes: (A) <0.44 (blue line) vs ≥0.44 (green line), (B) <0.65 (yellow line) vs ≥0.65 (purple line), (C) <0.64 (orange line) vs ≥0.64 (red line), and (D) synthetic diagram of all the survival curves. Abbreviation: LND, lymph node density. |
Figure 2D is a synthetic diagram of all the survival curves and allows comparison of the four methods including the median method, the X-tile program, the survival-tree algorithm, and the time-dependent ROC curve analysis for determining the cutoff point. The results indicated that the optimal LND cutoff point was around 0.65. We therefore finally stratified patients into the low-LND and high-LND groups using 0.65 as the LND cutoff point.
Impact of the LND on overall survival in children with WT
Kaplan–Meier survival curves (Figure 2B) showed that the survival outcome differed significantly between the low-LND (LND <0.65) and high-LND (LND ≥0.65) groups (P=0.011). Because the baselines were not completely balanced in the two groups (Table 1), we used Cox regression analysis to study the impact of the LND on overall survival (Table 2). The analysis showed that overall survival was significantly worse in the high-LND (LND ≥0.65) group than in the low-LND (LND <0.65) group in both univariate analysis (HR =1.965; 95% CI, 1.152–3.352; P=0.013) and multivariate analysis (HR =1.797; 95% CI, 1.043–3.097; P=0.035) (Table 2). In addition, smooth curve fitting after adjusting race, SEER stage, and tumor laterality shows that the risk of mortality tended to be ascending with the increase in LND in general (Figure 3).
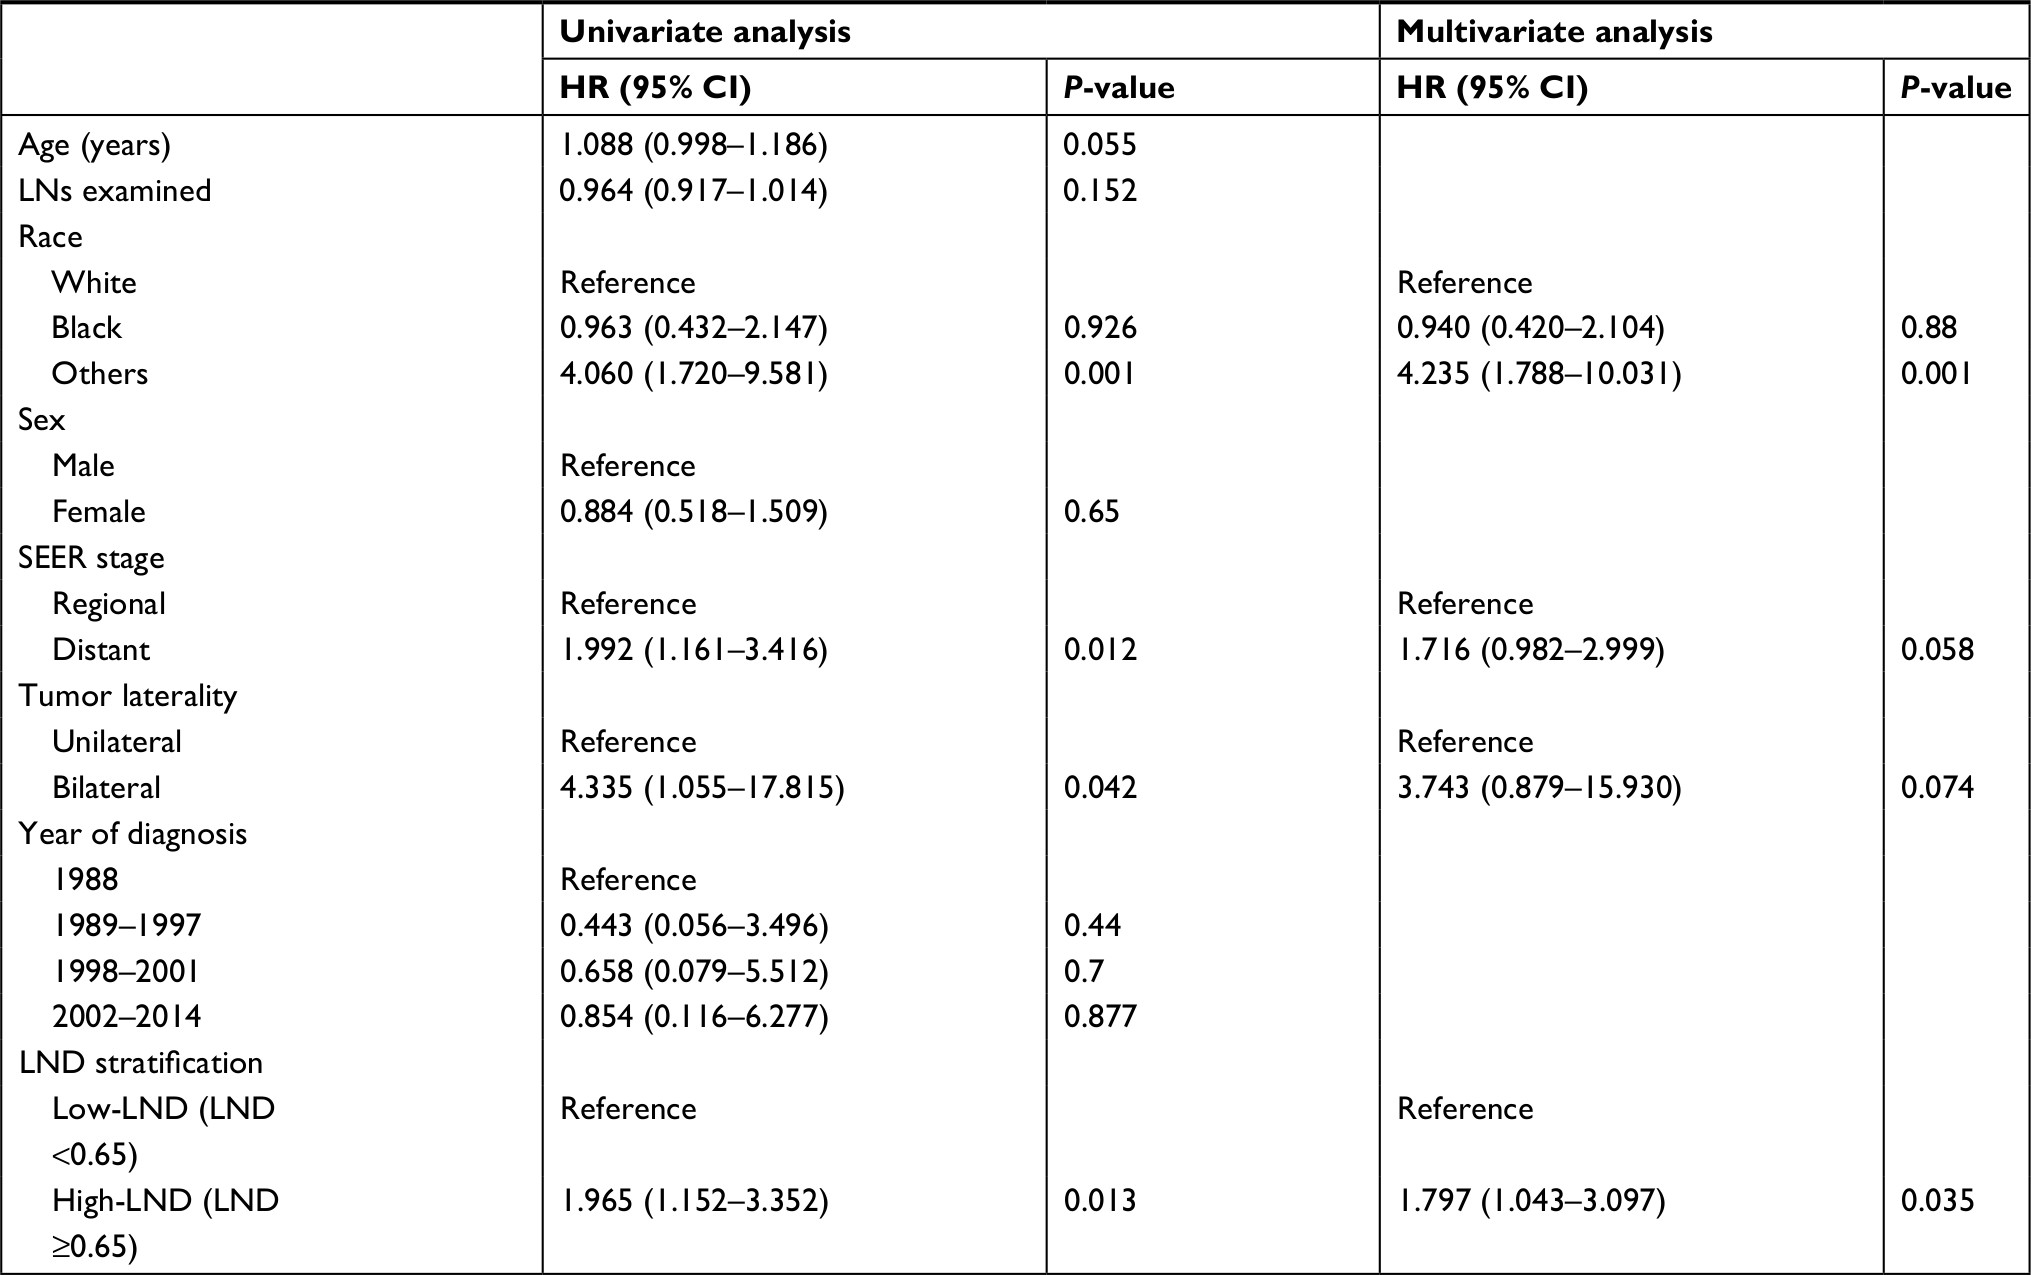 | Table 2 Univariate and multivariate analyses of overall survival Abbreviations: LND, lymph node density; LNs, lymph nodes; SEER, Surveillance, Epidemiology, and End Results. |
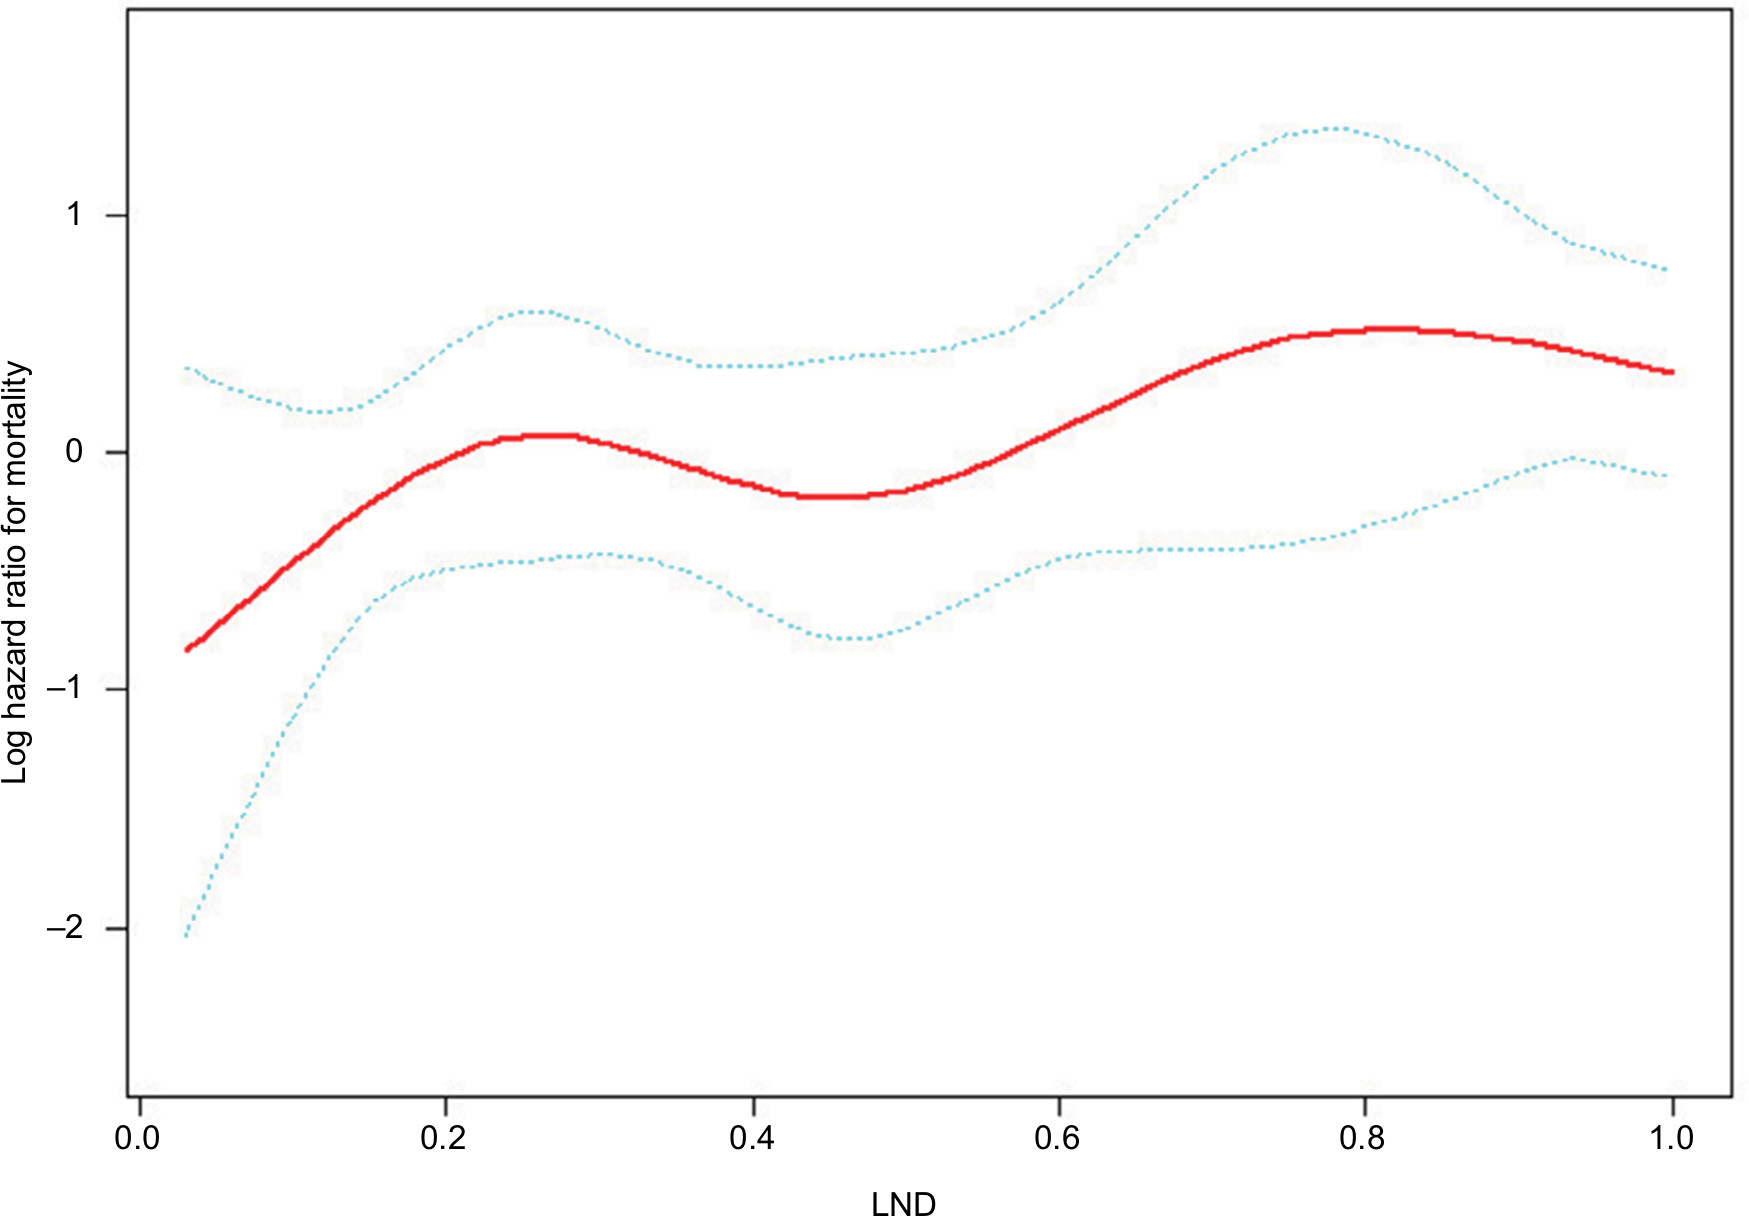 | Figure 3 Smooth curve fitting of the risk of mortality and LND after adjusting variables including race, SEER stage, and tumor laterality. Note: The red line represents the fitting curve, and the blue dotted lines represent the 95% CI. Abbreviation: LND, lymph node density; SEER, Surveillance, Epidemiology, and End Results. |
Discussion
About 90% of the children with WT are expected to survive long-term thanks to the efficacy of current multimodal therapies.3 This has resulted in most of the current research focusing on reducing treatment morbidity while maintaining good clinical outcomes. Effective prognostic factors for stratifying patients need to be identified. Previous studies have suggested that LND can affect the survival of patients with WT.4,5 However, the LND cutoff point has been controversial because the methods used in previous studies to determine this did not consider time-dependent survival data. Moreover, no study has clarified the impact of the LND on survival in children with WT. This study is the first to use the median method, the X-tile program, the survival-tree algorithm, and the time-dependent ROC curve analysis to determine the optimal cutoff point and use this to investigate the impact of the LND on survival in children.
The first method, based on the median, is a very simple method for determining the cutoff point, but it is crude since it does not apply statistical processing to the available data. The second method uses X-tile, which is a free software available from Yale University School of Medicine that can determine a cutoff point for continuous data with a time-dependent outcome.6 Its principle for finding the optimal cutoff point is to select the minimum P-value according to Kaplan–Meier survival curves and the log-rank test. To be specific, when finding the optimal LND cutoff point, the algorithm in the X-tile is like this: 1) an LND cutoff point splits patients into two groups; 2) the Kaplan–Meier survival curves between the two groups were compared by the log-rank test; 3) a P-value can be obtained by the log-rank test; 4) each LND cutoff point corresponds to a P-value by cycling the abovementioned process; and 5) the LND cutoff point with the minimum P-value is the optimal LND cutoff point because the minimum P-value means that the difference between the Kaplan–Meier survival curves of the two groups is the most significant from a statistical point of view. X-tile is often applied to time-dependent data. For example, Xu et al23 used X-tile to seek the optimal cutoff point for the levels of PEBP1 protein and mRNA, whereas Zhang et al24 used X-tile to discover the optimal cutoff points for the levels of 35 miRNAs. The third method, the survival-tree algorithm, is based on recursive partitioning, in which patients are recursively split into two groups according to many LND cutoff points. The LND cutoff point is optimal when two groups have the most different Kaplan–Meier survival curves (the minimum P-value for the log-rank test).10,25–27 So, the survival-tree algorithm and the algorithm in the X-tile are essentially the same. But the X-tile software is more convenient to use than the survival-tree algorithm based on R platform. The fourth method of ROC curves is popular for displaying the sensitivity and specificity of a continuous prognostic variable for a binary variable.28 Sensitivity is the probability that applying an LND cutoff point predicts the positive event (death) correctly. Specificity is the probability that applying an LND cutoff point predicts the negative event (survival) correctly. The Youden index is calculated as sensitivity plus specificity minus 1. The higher the Youden index is, the more accurate the prediction is. Each LND cutoff point corresponds to a sensitivity and specificity. Therefore, each LND point corresponds to a Youden index. The optimal LND cutoff point based on the time-dependent ROC curve analysis was determined as where the Youden index was maximal.13,14,29 The different methods underlying these approaches explain why the X-tile program and the survival-tree algorithm produce the same cutoff point, whereas that obtained from the time-dependent ROC curve analysis is different. As can be seen from the Kaplan–Meier survival curves in Figure 2D, the two cutoff points (0.64 and 0.65) determined in this study indicate that the three methods – the X-tile program, the survival-tree algorithm, and the time-dependent ROC curve analysis – are equivalent in their ability to stratify patients and clearly better than the median method, which yielded a cutoff point of 0.44.
Regarding patient selection, we excluded children with an LND of 0 in this study. According to the WT stage system based on the NWTS and the International Society of Pediatric Oncology,30–32 patients with LN metastases (LND was not 0) have a higher stage than stage II. In the SEER database, a localized tumor is defined as one “limited to the organ in which it began, without evidence of spread”, a regional tumor has “spread beyond the primary site to nearby LNs or organs and tissues”, and a distant tumor has “spread from the primary site to distant organs or distant lymph nodes”.33 The stage of the 376 patients who remained after excluding the patients with an LND of 0 all had regional or distant tumors; that is, none of them had localized tumors. This indicated that patients with an LND of 0 tended to be at a lower stage, whereas patients whose LND was not 0 tended to be at a higher stage. The cutoff point would therefore be biased to being significantly smaller if patients with an LND of 0 were included, resulting in inherently different patients being compared.
Previous studies4,5 found the LND to be associated with the overall survival of patients with WT. However, they did not analyze the subset of children with WT, which is a severe limitation given that WT mainly appears in children, at a median age of 3.5 years.34 Moreover, adult and pediatric patients exhibit significantly different outcomes.35–37 In this study, we therefore aimed to determine the impact of the LND on overall survival in children with WT, and the results from the Kaplan–Meier survival curves and Cox regression analysis showed the LND to be associated with the overall survival of children with WT, which was similar to the findings in previous studies.4,5
Nevertheless, this study inevitably had several shortcomings. First, currently there is no standard mandating the number of LNs to be sampled or defined template for LN dissection. Thus, there could be large variations in the LND, and the denominator in the calculation of LND is different. Second, the optimal LND cutoff point determined in this study was based on 376 children in the SEER database. This database is non-standardized and covers a long interval. So, its reliability and authenticity need to be verified with other larger data sets. Third, this is a retrospective study. Some potential important information such as chemotherapy and radiotherapy regimens could not be obtained from the database. In this study, we used the NWTS-2, -3, -4, and -5 trial publication times to show treatment differences.
Conclusion
This is the first analysis of the SEER database to have applied four methods including the median value, the X-tile program, the survival-tree algorithm, and the time-dependent ROC curve analysis to determine the optimal LND cutoff point and clarify the impact of the LND on overall survival in children with WT. The X-tile program, the survival-tree algorithm, and the time-dependent ROC curve analysis are equivalent in their ability to stratify patients and clearly better than the median method. The optimal LND cutoff point was found to be around 0.65, and LND was significantly associated with overall survival in children with WT. This is helpful for evaluating or predicting the survival of children with WT by LND in future clinical applications.
Acknowledgment
This study was supported by the National Social Science Foundation of China (No. 16BGL183), the Natural Science Foundation of Shaanxi Province (No. 2015JM8415), the Fundamental Research Funds for the Central Universities of China (No. 2011jdhz55), the Clinical Research Award of the First Affiliated Hospital of Xi’an Jiaotong University of China (No. XJTU1AF-CRF-2016-021), the Research Fund of Health Bureau of Xi’an (No. QFO1330), and the Research Fund of Xi’an Children’s Hospital (No. 2018D02).
Disclosure
The authors report no conflicts of interest in this work.
References
Davidoff AM. Wilms’ tumor. Curr Opin Pediatr. 2009;21(3):357–364. | ||
Friedman AD. Wilms tumor. Pediatr Rev. 2013;34(7):328–330; discussion 330. | ||
Cotton CA, Peterson S, Norkool PA, Takashima J, Grigoriev Y, Breslow NE. Early and late mortality after diagnosis of Wilms tumor. J Clin Oncol. 2009;27(8):1304–1309. | ||
You H, Yang J, Liu Q, et al. The impact of the lymph node density on overall survival in patients with Wilms’ tumor: a SEER analysis. Cancer Manag Res. 2018;10:671–677. | ||
Saltzman AF, Carrasco A Jr, Amini A, et al. Patterns of lymph node sampling and the impact of lymph node density in favorable histology Wilms tumor: an analysis of the National cancer database. J Pediatr Urol. 2018;14(2):161.e1–161.e8. | ||
Camp RL, Dolled-Filhart M, Rimm DL. X-tile: a new bio-informatics tool for biomarker assessment and outcome-based cut-point optimization. Clin Cancer Res. 2004;10(21):7252–7259. | ||
Li SQ, Jiang YH, Lin J, et al. Albumin-to-fibrinogen ratio as a promising biomarker to predict clinical outcome of non-small cell lung cancer individuals. Cancer Med. 2018;7(4):1221–1231. | ||
Chen X, Deng Y, Shi Y, et al. Loss of expression rather than cytoplasmic mislocalization of RUNX3 predicts worse outcome in non-small cell lung cancer. Oncol Lett. 2018;15(4):5043–5055. | ||
Pan C, Wang X, Chen W, et al. Reevaluation of glypican-3 as a prognostic marker in HCC using X-tile software. Med Oncol. 2015;32(1):359. | ||
The Comprehensive R Archive Network. An introduction to recursive partitioning using the RPART Routines; 2018. Available from: http://cran.r-project.org/web/packages/rpart/vignettes/longintro.pdf. Accessed February 23, 2018. | ||
Rau CS, Wu SC, Chien PC, et al. Prediction of mortality in patients with isolated traumatic subarachnoid hemorrhage using a decision tree classifier: a retrospective analysis based on a trauma registry system. Int J Environ Res Public Health. 2017;14(11):E1420. | ||
Diallo JS, Aldejmah A, Mouhim AF, et al. Noxa and Puma expression add to clinical markers in predicting biochemical recurrence of prostate cancer patients in a survival tree model. Clin Cancer Res. 2007;13(23):7044–7052. | ||
Heagerty PJ, Lumley T, Pepe MS. Time-dependent ROC curves for censored survival data and a diagnostic marker. Biometrics. 2000;56(2):337–344. | ||
Youden WJ. Index for rating diagnostic tests. Cancer. 1950;3(1):32–35. | ||
Toyokawa T, Kubo N, Tamura T, et al. The pretreatment controlling nutritional status (CONUT) score is an independent prognostic factor in patients with resectable thoracic esophageal squamous cell carcinoma: results from a retrospective study. BMC Cancer. 2016;16(1):722. | ||
Le PH, Lin WR, Kuo CJ, et al. Clinical characteristics of cytomegalovirus colitis: a 15-year experience from a tertiary reference center. Ther Clin Risk Manag. 2017;13:1585–1593. | ||
Duchesne JC, Tatum D, Jones G, et al. Multi-institutional analysis of neutrophil-to-lymphocyte ratio (NLR) in patients with severe hemorrhage: a new mortality predictor value. J Trauma Acute Care Surg. 2017;83(5):888–893. | ||
Surveillance, Epidemiology, and End Results (SEER) Program. SEER*Stat database: incidence–SEER 18 Regs research data+Hurricane Katrina impacted Louisiana cases, Nov 2016 Sub (1973–2014)–linked to county attributes–Total U.S., 1969–2015 counties. National Cancer Institute, DCCPS, Surveillance Research Program, Surveillance Systems Branch, released April 2017, based on the November 2016 submission. Available from: http://www.seer.cancer.gov. Accessed February 28, 2018. | ||
D’Angio GJ, Evans A, Breslow N, et al. The treatment of Wilms’ tumor: results of the Second National Wilms’ tumor Study. Cancer. 1981;47(9):2302–2311. | ||
D’Angio GJ, Breslow N, Beckwith JB, et al. Treatment of Wilms’ tumor. Results of the third National Wilms’ tumor Study. Cancer. 1989;64(2):349–360. | ||
Green DM, Breslow NE, Beckwith JB, et al. Comparison between single-dose and divided-dose administration of dactinomycin and doxorubicin for patients with Wilms’ tumor: a report from the National Wilms’ tumor Study Group. J Clin Oncol. 1998;16(1):237–245. | ||
Green DM, Breslow NE, Beckwith JB, et al. Treatment with nephrectomy only for small, stage I/favorable histology Wilms’ tumor: a report from the National Wilms’ tumor Study Group. J Clin Oncol. 2001;19(17):3719–3724. | ||
Xu YF, Yi Y, Qiu SJ. PEBP1 downregulation is associated to poor prognosis in HCC related to hepatitis B infection. J Hepatol. 2011;53(5):872–879. | ||
Zhang JX, Song W, Chen ZH, et al. Prognostic and predictive value of a microRNA signature in stage II colon cancer: a microRNA expression analysis. Lancet Oncol. 2013;14(13):1295–1306. | ||
Breiman L, Friedman JH, Olshen RA, Stone CJ. Classification and Regression Trees. New York: Chapman & Hall/CRC; 1984. | ||
Ciampi A, Thiffault J, Nakache JP, Asselain B. Stratification by stepwise regression, correspondence analysis and recursive partition: a comparison of three methods of analysis for survival data with covariates. Comput Stat Data Anal. 1986;4(3):185–204. | ||
Segal MR. Regression trees for censored data. Biometrics. 1988;44(1):35–37. | ||
Ma X, Zeng H, Zhang J, Chen L, Jia H. New practical methods to obtain crucial data in performing diagnostic meta-analysis of the published literature. J Evid Based Med. 2018;11(1):56–63. | ||
Perkins NJ, Schisterman EF. The inconsistency of “optimal” cutpoints obtained using two criteria based on the receiver operating characteristic curve. Am J Epidemiol. 2006;163(7):670–675. | ||
Metzger ML, Dome JS. Current therapy for Wilms’ tumor. Oncologist. 2005;10(10):815–826. | ||
Vujanic´ GM, Sandstedt B, Harms D, et al; SIOP Nephroblastoma Scientific Committee. Revised International Society of Paediatric Oncology (SIOP) Working classification of renal tumors of childhood. Med Pediatr Oncol. 2002;38(2):79–82. | ||
Kalapurakal JA, Dome JS, Perlman EJ, et al. Management of Wilms’ tumour: current practice and future goals. Lancet Oncol. 2004;5(1):37–46. | ||
National Cancer Institute [homepage on the Internet]. Surveillance, epidemiology and end results (SEER) program; 2018. Available from: http://www.seer.cancer.gov. Accessed February 28, 2018. | ||
Breslow N, Olshan A, Beckwith JB, Green DM. Epidemiology of Wilms tumor. Med Pediatr Oncol. 1993;21(3):172–181. | ||
Mitry E, Ciccolallo L, Coleman MP, Gatta G, Pritchard-Jones K; EUROCARE Working Group. Incidence of and survival from Wilms’ tumour in adults in Europe: data from the EUROCARE study. Eur J Cancer. 2006;42(14):2363–2368. | ||
Terenziani M, Spreafico F, Collini P, et al. Adult Wilms’ tumor: a monoinstitutional experience and a review of the literature. Cancer. 2004;101(2):289–293. | ||
Ali AN, Diaz R, Shu HK, Paulino AC, Esiashvili N. A surveillance, epidemiology and end results (SEER) program comparison of adult and pediatric Wilms’ tumor. Cancer. 2012;118(9):2541–2551. |
 © 2019 The Author(s). This work is published and licensed by Dove Medical Press Limited. The
full terms of this license are available at https://www.dovepress.com/terms
and incorporate the Creative Commons Attribution
- Non Commercial (unported, 3.0) License.
By accessing the work you hereby accept the Terms. Non-commercial uses of the work are permitted
without any further permission from Dove Medical Press Limited, provided the work is properly
attributed. For permission for commercial use of this work, please see paragraphs 4.2 and 5 of our Terms.
© 2019 The Author(s). This work is published and licensed by Dove Medical Press Limited. The
full terms of this license are available at https://www.dovepress.com/terms
and incorporate the Creative Commons Attribution
- Non Commercial (unported, 3.0) License.
By accessing the work you hereby accept the Terms. Non-commercial uses of the work are permitted
without any further permission from Dove Medical Press Limited, provided the work is properly
attributed. For permission for commercial use of this work, please see paragraphs 4.2 and 5 of our Terms.