Back to Journals » International Journal of General Medicine » Volume 11
Determining 30-day readmission risk for heart failure patients: the Readmission After Heart Failure scale
Authors Chamberlain RS, Sond J, Mahendraraj K, Lau CSM, Siracuse BL ![]()
Received 2 September 2017
Accepted for publication 30 November 2017
Published 9 April 2018 Volume 2018:11 Pages 127—141
DOI https://doi.org/10.2147/IJGM.S150676
Checked for plagiarism Yes
Review by Single anonymous peer review
Peer reviewer comments 3
Editor who approved publication: Dr Scott Fraser
Ronald S Chamberlain,1–5 Jaswinder Sond,1 Krishnaraj Mahendraraj,1 Christine SM Lau,1,3 Brianna L Siracuse1
1Department of Surgery, Saint Barnabas Medical Center, Livingston, 2Department of Surgery, Rutgers New Jersey Medical School, Rutgers University, Newark, NJ, USA; 3St. George’s University School of Medicine, Grenada, West Indies; 4Department of Surgery, Banner MD Anderson Cancer Center, Gilbert, AZ, USA; 5Department of Surgery, Valley Cancer Surgical Specialists, Phoenix, AZ, USA
Background: Chronic heart failure (CHF), which affects >5 million Americans, accounts for >1 million hospitalizations annually. As a part of the Hospital Readmission Reduction Program, the Affordable Care Act requires that the Centers for Medicare and Medicaid Services reduce payments to hospitals with excess readmissions. This study sought to develop a scale that reliably predicts readmission rates among patients with CHF.
Methods: The State Inpatient Database (2006–2011) was utilized, and discharge data including demographic and clinical characteristics on 642,448 patients with CHF from California and New York (derivation cohort) and 365,359 patients with CHF from Florida and Washington (validation cohort) were extracted. The Readmission After Heart Failure (RAHF) scale was developed to predict readmission risk.
Results: The 30-day readmission rates were 9.42 and 9.17% (derivation and validation cohorts, respectively). Age <65 years, male gender, first income quartile, African American race, race other than African American or Caucasian, Medicare, Medicaid, self-pay/no insurance, drug abuse, renal failure, chronic pulmonary disorder, diabetes, depression, and fluid and electrolyte disorder were associated with higher readmission risk after hospitalization for CHF. The RAHF scale was created and explained the 95% of readmission variability within the validation cohort. The RAHF scale was then used to define the following three levels of risk for readmission: low (RAHF score <12; 7.58% readmission rate), moderate (RAHF score 12–15; 9.78% readmission rate), and high (RAHF score >15; 12.04% readmission rate). The relative risk of readmission was 1.67 for the high-risk group compared with the low-risk group.
Conclusion: The RAHF scale reliably predicts a patient’s 30-day CHF readmission risk based on demographic and clinical factors present upon initial admission. By risk-stratifying patients, using models such as the RAHF scale, strategies tailored to each patient can be implemented to improve patient outcomes and reduce health care costs.
Keywords: heart failure, readmission, risk factors, risk assessment, RAHF scale, hospital readmission reduction program, HRRP, SID database
Introduction
Chronic heart failure (CHF) is the most common cause of readmission for Medicare patients in the USA. The Heart Disease and Stroke Statistics Report (2016) from the American Heart Association estimated that the prevalence of heart failure is ~5.7 million, and an estimated 1 million hospital stays were attributable to CHF.1 The discharge rate for patients with CHF increased from 400,000 in 1979 to 1,084,000 in 2005.2 As of 2010, hospitalization rates remained consistently >1 million.1 In 2014, US health care costs accounted for 17.5% of the gross domestic product (GDP) (~$3.0 trillion) compared to 9.18% of the GDP ($260 billion) in 1980.3 At this current rate, by 2040, the cost of health care could reach 30% of the GDP.4 In 2014, Medicare paid $173 billion on outpatient and inpatient services to 4,700 hospitals, a 4% increase from the year before.5 The American Heart Association estimates that the total direct costs (defined as medical spending) for treating CHF will rise to $53 billion in 2030, more than double the $21 billion in 2012.6 Hospital readmissions consume significant resources and are a financial burden on the US health care system. In 2005, Medicare 7-day hospital readmission rates were 6.2% and 30-day readmission rates were 17.6%. A majority of these 7- and 30-day readmissions were considered preventable (84 and 76%, respectively).7 The 15-day CHF readmission rates were 12.5%, costing ~$600 million.7 As a result of increased spending on Medicare reimbursements, the Medicare Payment Advisory Commission (MedPAC) predicted higher health care premiums and taxes.7 To address the burgeoning cost of hospital readmissions, the Affordable Care Act (ACA) was established and signed into law in March 2010 by President Barack Obama.8 The ACA created the Hospital Readmissions Reduction Program (HRRP), which required the Centers for Medicare and Medicaid Services (CMS) to penalize hospitals with high rates of readmissions by reducing hospital reimbursements effective October 2012.7,9 According to the CMS, a “readmission” was defined as an admission to a hospital within 30 days of a discharge from the same or another hospital.7 At the initiation of the HRRP in October 2012, CMS predicted that >2/3 of hospitals would be receiving fines, accounting for up to 1% of their Medicare reimbursement.9 It was also predicted that these penalties would increase to 3% by 2015, affecting 2,217 hospitals, and ~$280 million loss in Medicare funds.9 This program provided significant incentives for both health care professionals and hospitals to reduce readmissions and improve patient outcomes. The Healthcare Cost and Utilization Project (HCUP) (2015) reported a decline in all-cause 30-day readmission rates among patients with CHF from 25.1% in 2009 to 23.5% in 2013, with an estimated $200 million cost saving.10 Furthermore, in 2016, MedPAC reported a decline in preventable readmissions from 19.5% in 2010 to 17.0% in 2014 among CHF patients.5 Given the high prevalence of CHF, and the penalties associated with high readmission rates, it is crucial to understand factors associated with increased readmission risk and develop strategies at reducing readmission risk among high-risk groups. This study examined a large cohort of patients with CHF in an effort to identify specific factors associated with readmissions and to develop a predictive readmission nomogram that could reliably predict 30-day readmission risk. This scale can then be used by physicians to risk stratify patients with CHF and identify high-risk patients at index admission, so that their conditions can be optimized and interventions can be implemented to avoid these readmissions.
Methods
The State Inpatient Database (SID), a part of the HCUP of the Agency for Healthcare Research and Quality, was utilized for this study. The HCUP SID consists of individual discharge data files from data organizations in 47 participating states. In general, the SID is composed of annual, state-specific files that share common data elements and encompass ~90% of that state’s hospital inpatient discharge records. Data from 2006 and 2011 were extracted from four states (California, New York, Washington, and Florida). There were 642,448 patients from California and New York (derivation cohort) and 365,359 patients from Florida and Washington (validation cohort) with index admissions meeting the criteria for CHF with International Classification of Disease (ICD)-9 codes 428.0, 428.1, 428.20, 428.21, 428.22, 428.23, 428.30, 428.31, 428.32, 428.33, 428.40, 428.41, 428.42, 428.43, and 428.9 that were identified. Demographic and clinical data extracted included age, gender, race, median income quartile, insurance/primary payer, length of stay, discharge location, the presence of noncardiac comorbidities, and CHF readmission. Readmission time for CHF was limited to 30 days, and readmissions for reasons other than CHF were excluded (Figure 1). Lengths of initial hospitalizations were calculated, and 30-day CHF readmission and overall inpatient mortality were examined. All patient data were de-identified, and no personal patient identifying information has been included. Approval to conduct this study was obtained from the Institutional Review Board (IRB) at Saint Barnabas Medical Center (IRB # 13-55).
 | Figure 1 Flowchart of data exclusions used to create the Readmission After Heart Failure risk scale. Note: *ICD-9 codes for heart failure: 428.0, 428.1, 428.20, 428.21, 428.22, 428.23, 428.30, 428.31, 428.32, 428.33, 428.40, 428.41, 428.42, 428.43, and 428.9. Abbreviation: ICD, International Classification of Disease. |
Statistical analysis was performed using Chi-square tests, and univariate analysis was conducted with binary logistic regression. Statistical significance was accepted at P<0.01. Factors that were statistically significant in the univariate analysis were included in the multivariate analysis. To determine the strength of association, odds ratios (OR) and 95% confidence intervals (CI) were calculated. SAS statistical software, Version 9.3 (SAS Institute, Inc., Cary, NC, USA), was utilized for all data analysis, and values <10 were not reported, as per SID reporting guidelines.
Variables determined to be significantly associated with Readmission After Heart Failure (RAHF) (P<0.01) for the derivation cohort (New York and California) were used to construct the RAHF scale. To prevent giving too much weight to any factors, these threshold cutoffs were chosen a priori. The following formula was used to calculate the scores for each variable:
|

To ensure scale accuracy, the scale was validated against a separate cohort of patients from Washington and Florida. RAHF scores were generated for patients, and logistic regression and residual plots were performed to determine the fit of the RAHF scale. Individuals with missing data for variables were excluded, and the RAHF scale was only applied to people without missing data.
Results
Demographics and clinicopathological data
A total of 642,448 patients from New York and California (derivation cohort) and 365,359 patients from Washington and Florida (validation cohort) were identified as having been admitted for CHF from the SID (2006–2011). Demographic and clinicopathological distributions for both derivation and validation cohorts were similar (Tables 1 and 2, respectively). Most patients were Caucasian (derivation cohort: 62.4%; validation cohort: 72.3%) and aged 65–84 years (derivation cohort: 48.7%; validation cohort: 50.8%). Male-to-female ratio was similar among both cohorts (derivation cohort: 0.98:1; validation cohort: 1.07:1). The most common comorbidities were hypertension (derivation cohort: 71.54%; validation cohort: 73.14%), diabetes mellitus (derivation cohort: 42.80%; validation cohort: 42.66%), renal failure (derivation cohort: 34.08%; validation cohort: 34.01%), and chronic pulmonary disease (derivation cohort: 33.77%; validation cohort: 38.76%). Index admission mortality rates were also similar (derivation cohort: 3.7%; validation cohort: 2.90%).
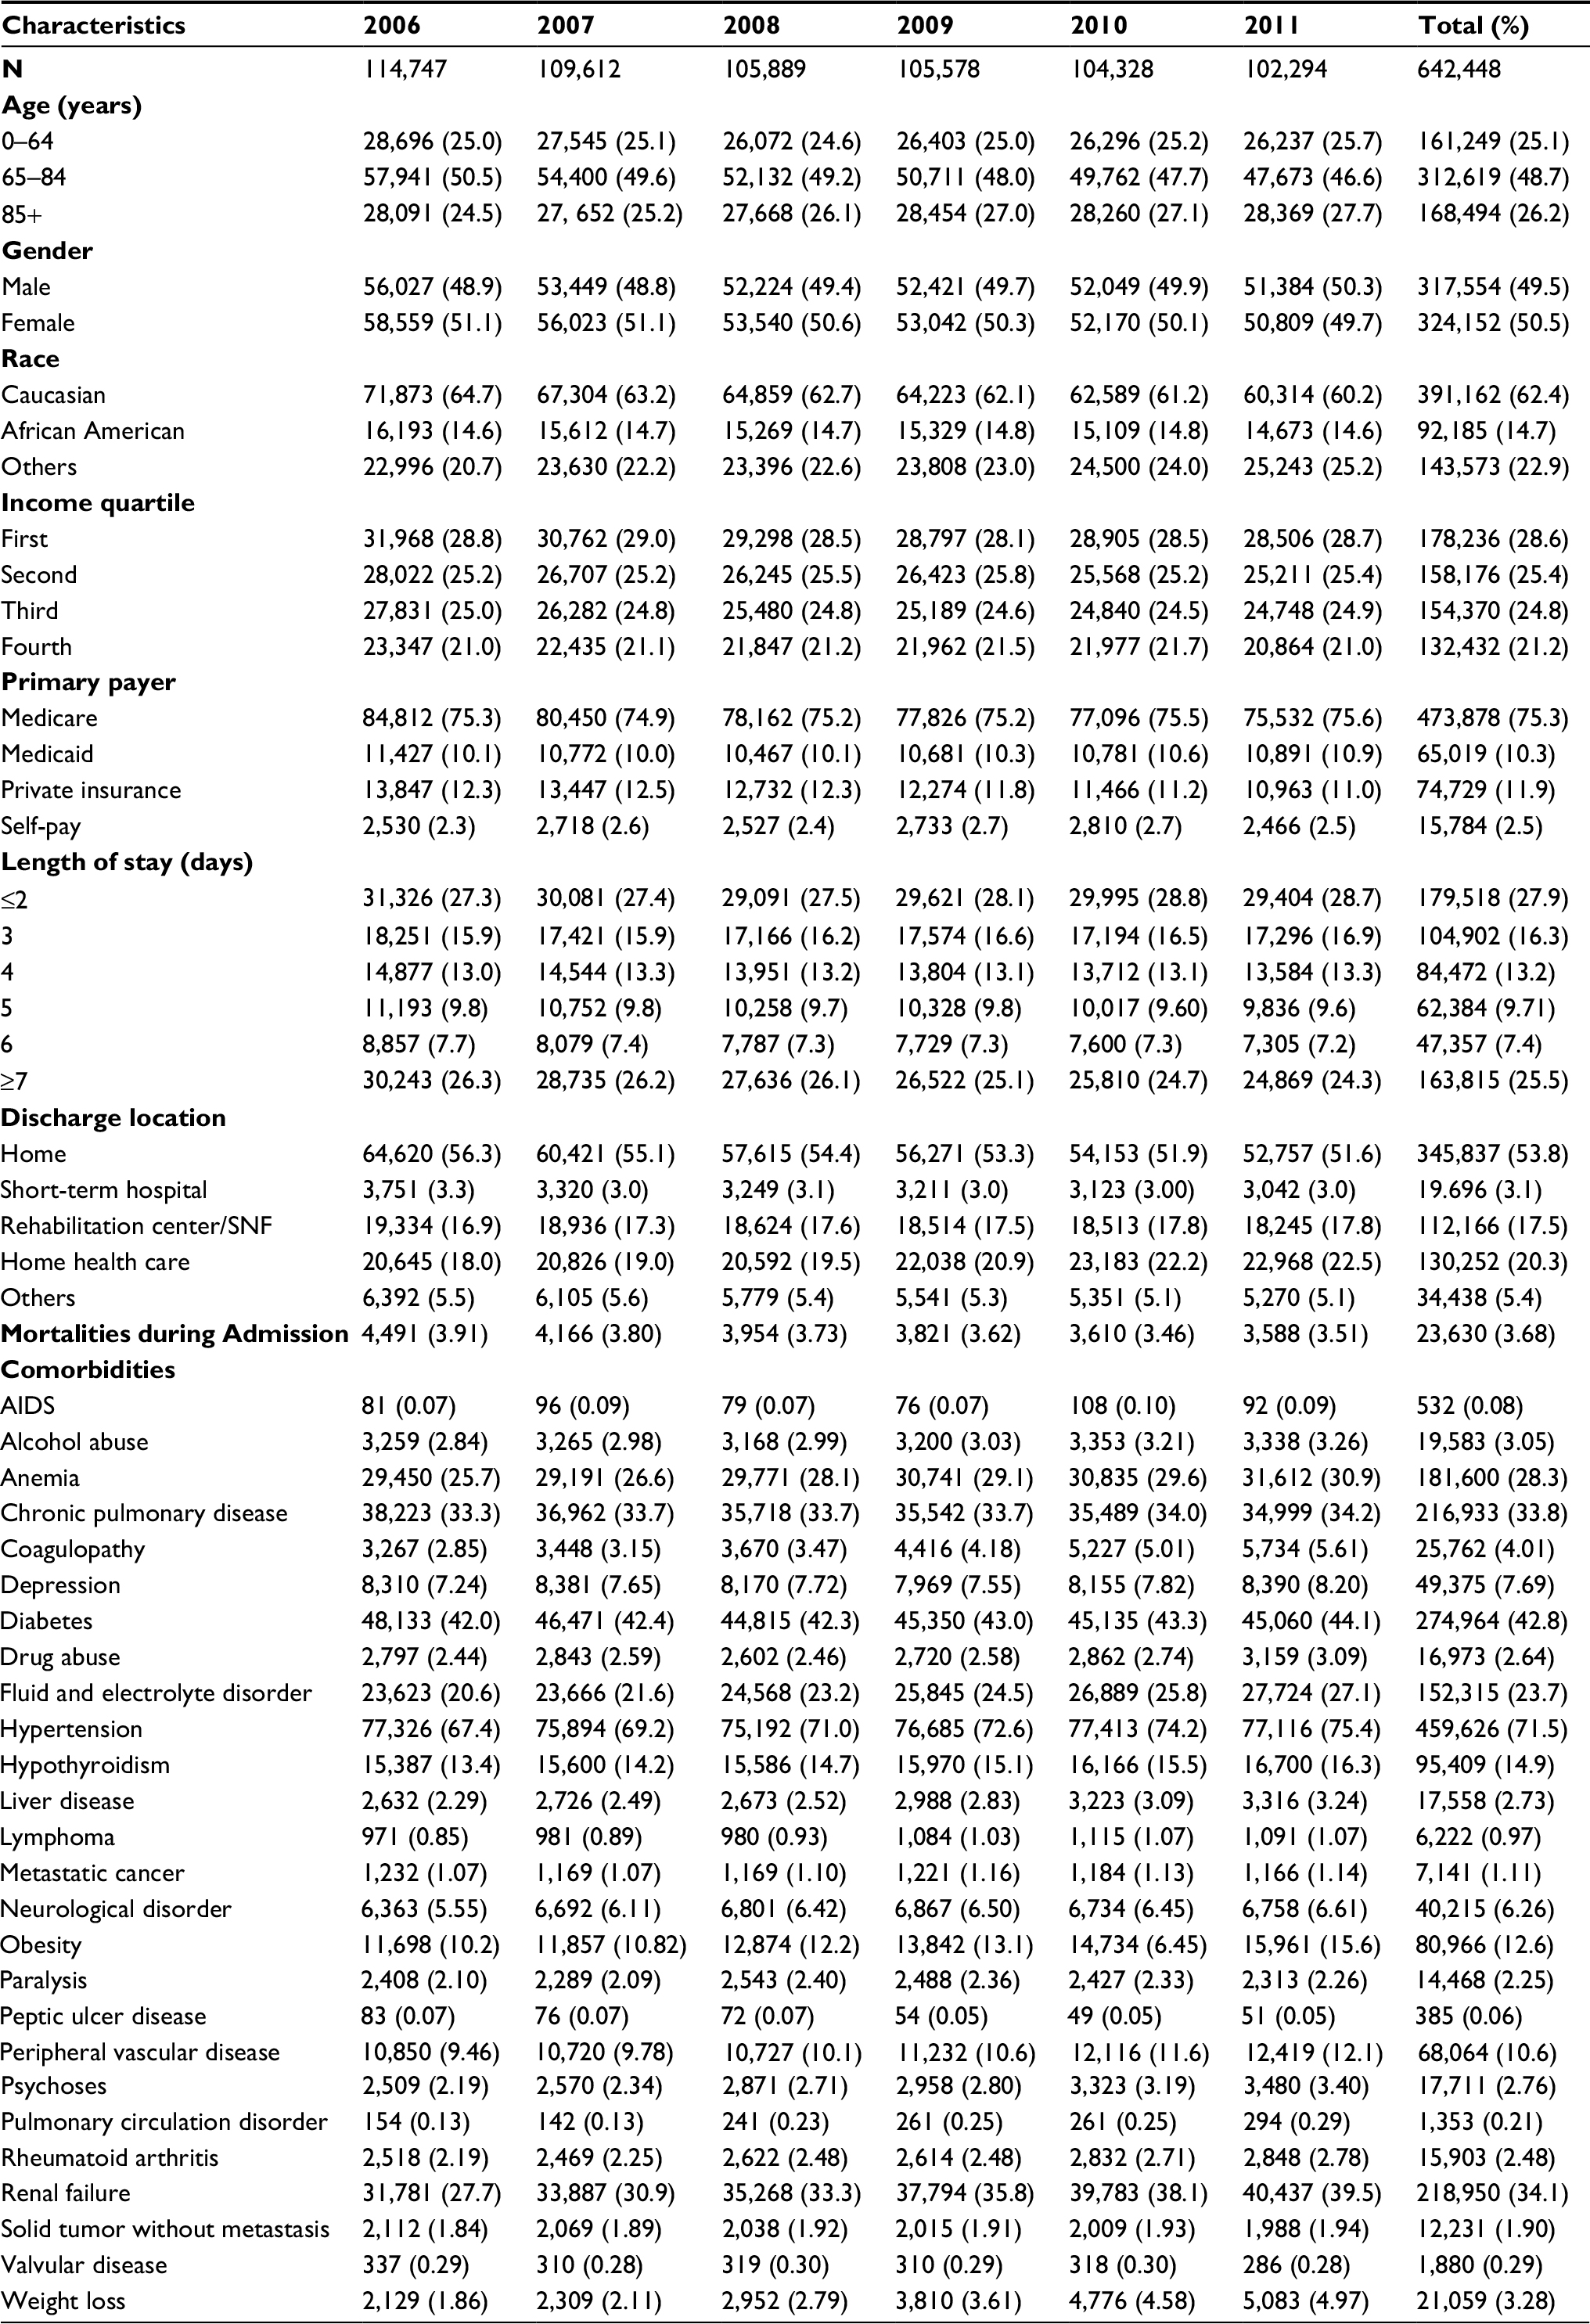 | Table 1 Demographic and comorbidities data involving 642,448 heart failure patients of derivation cohort Notes: Anemia combines chronic blood loss anemia and iron deficiency anemia. Diabetes combines complicated and uncomplicated diabetes. N, number of patients. Data presented as N (%). Abbreviations: AIDS, acquired immunodeficiency syndrome; SNF, skilled nursing facility. |
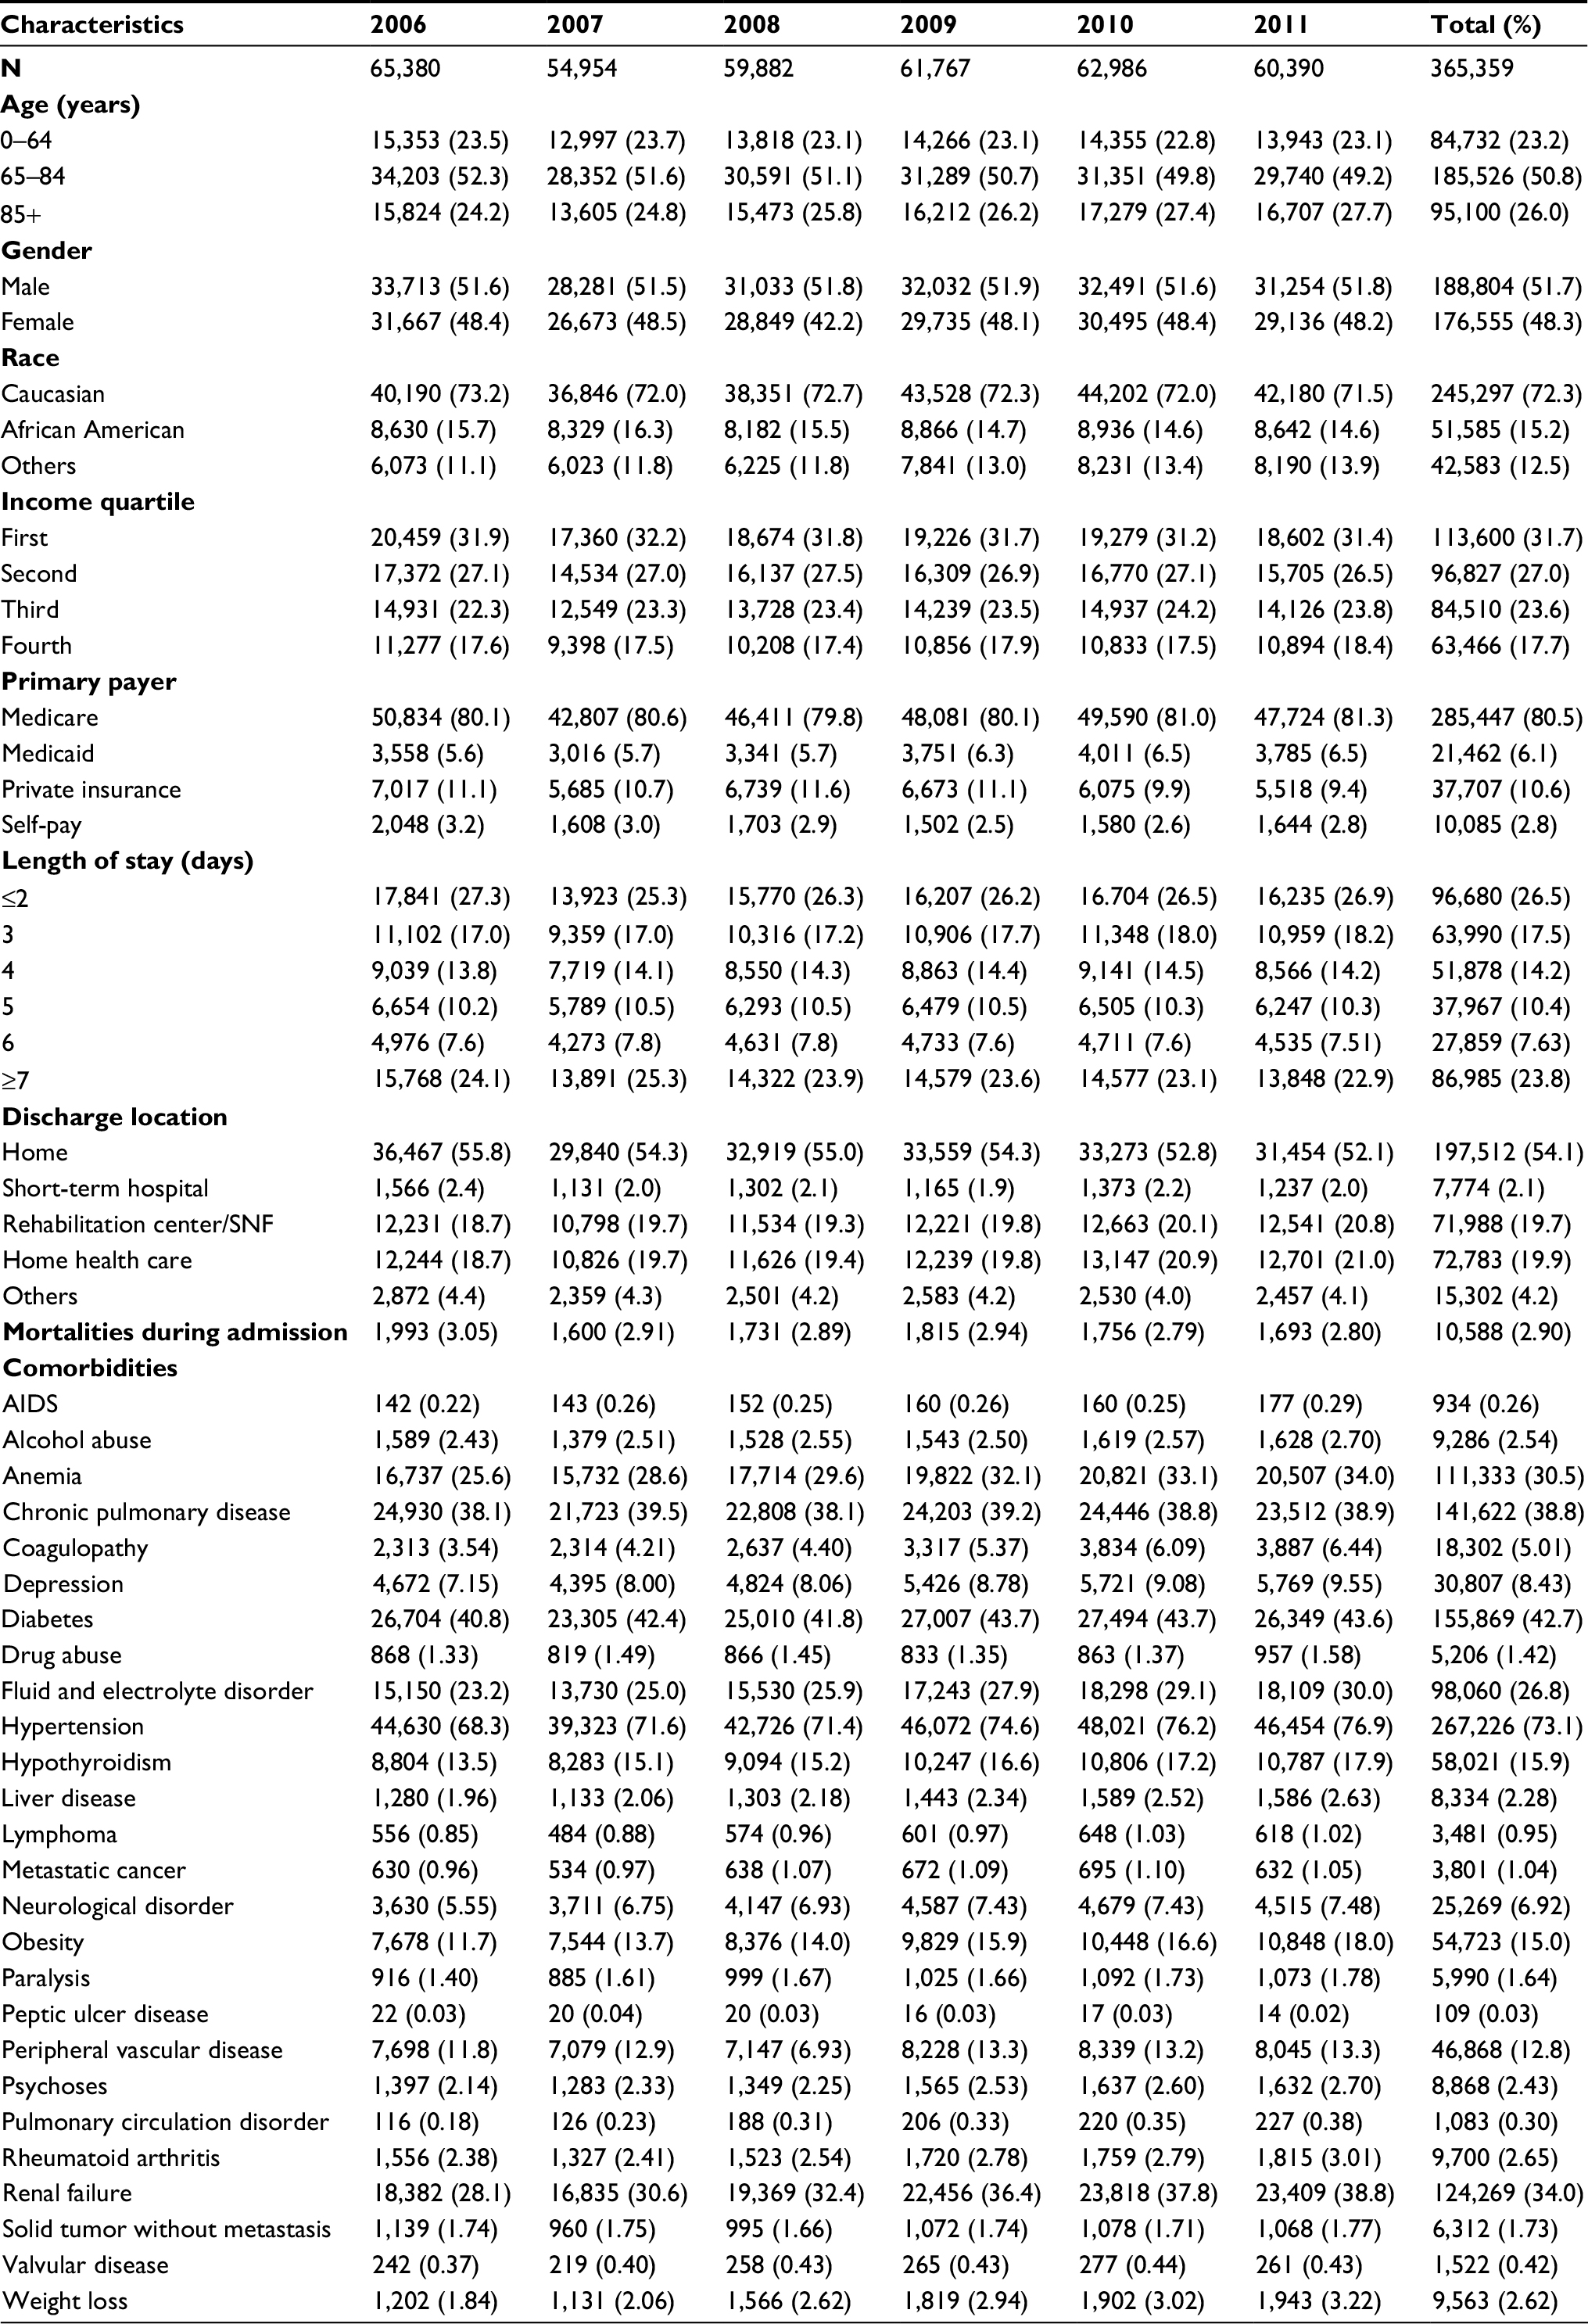 | Table 2 Demographic and comorbidities data involving 365,359 heart failure patients of validation cohort Notes: Anemia combines chronic blood loss anemia and iron deficiency anemia. Diabetes combines complicated and uncomplicated diabetes. N, number of patients. Data presented as N (%). Abbreviations: AIDS, acquired immunodeficiency syndrome; SNF, skilled nursing facility. |
Readmissions
The overall readmission rate in the derivation cohort was 9.42%, with highest readmission rates among African Americans (12.57%), patients aged <65 years (11.06%), and patients with a history of drug abuse (16.89%) and renal failure (11.45%) (Figure 2). Similarly, the overall readmission rate in the validation cohort was 9.17%, with highest readmission rates among African Americans (12.4%), patients aged <65 years (10.74%), and patients with a history of drug abuse (16.33%), acquired immunodeficiency syndrome (AIDS) (14.99%), and renal failure (11.29%) (Figure 3).
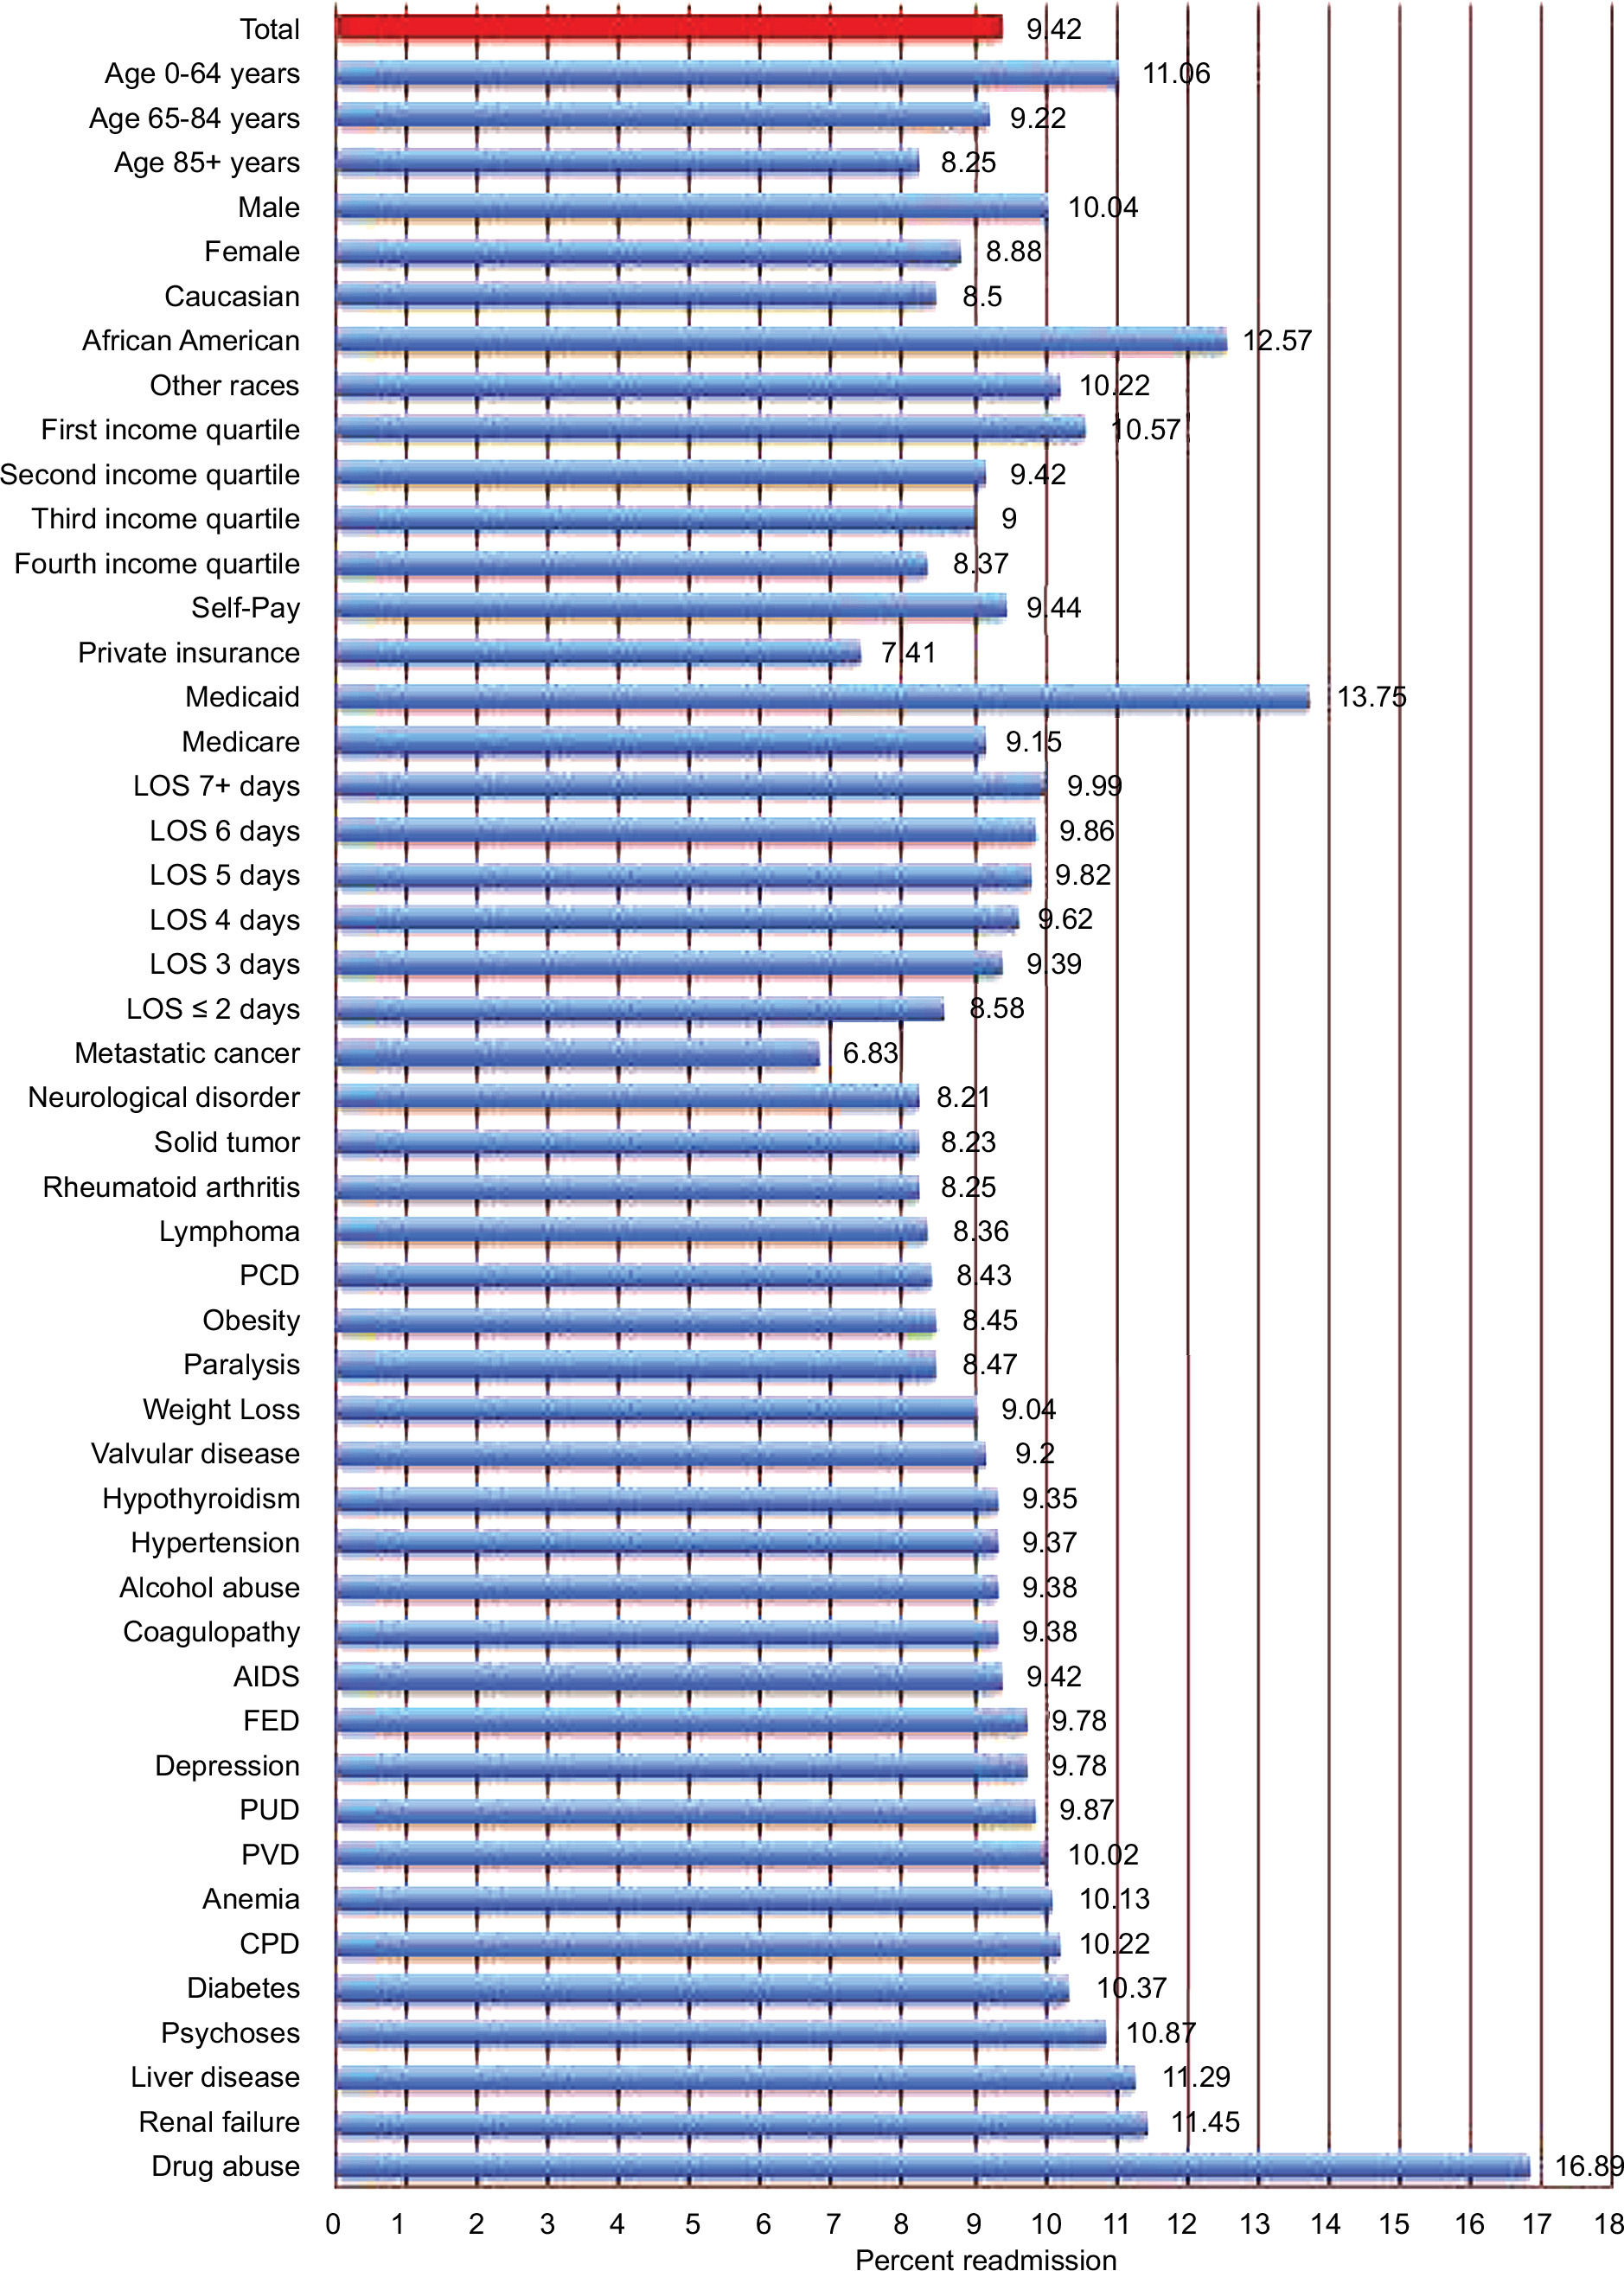 | Figure 2 Readmission rates by demographic and clinicopathological characteristics among heart failure patients of the derivation cohort. Notes: Anemia combines chronic blood loss anemia and iron deficiency anemia. Diabetes combines complicated and uncomplicated diabetes. Abbreviations: AIDS, acquired immunodeficiency syndrome; CPD, chronic pulmonary disease; FED, fluid and electrolyte disorder; LOS, length of stay; PCD, pulmonary circulation disorder; PUD, peptic ulcer disease; PVD, peripheral vascular disease. |
 | Figure 3 Readmission rates by demographic and clinicopathological characteristics among heart failure patients of the validation cohort. Notes: Anemia combines chronic blood loss anemia and iron deficiency anemia. Diabetes combines complicated and uncomplicated diabetes. Abbreviations: AIDS, acquired immunodeficiency syndrome; CPD, chronic pulmonary disease; FED, fluid and electrolyte disorder; LOS, length of stay; PCD, pulmonary circulation disorder; PUD, peptic ulcer disease; PVD, peripheral vascular disease. |
Univariate analysis
On univariate analysis of the derivation cohort, factors identified as significantly affecting readmission rates included age, race, income quartile, primary payer, AIDS, alcohol abuse, anemia, chronic pulmonary disease, depression, diabetes, drug abuse, fluid and electrolyte disorder, liver disease, peripheral vascular disease, psychoses, and renal failure; P<0.01 (Table 3). Similarly, in the validation cohort, all of these variables except for second income quartile, alcohol abuse, and liver disease were found to significantly affect readmission rates; P<0.01 (Table 4).
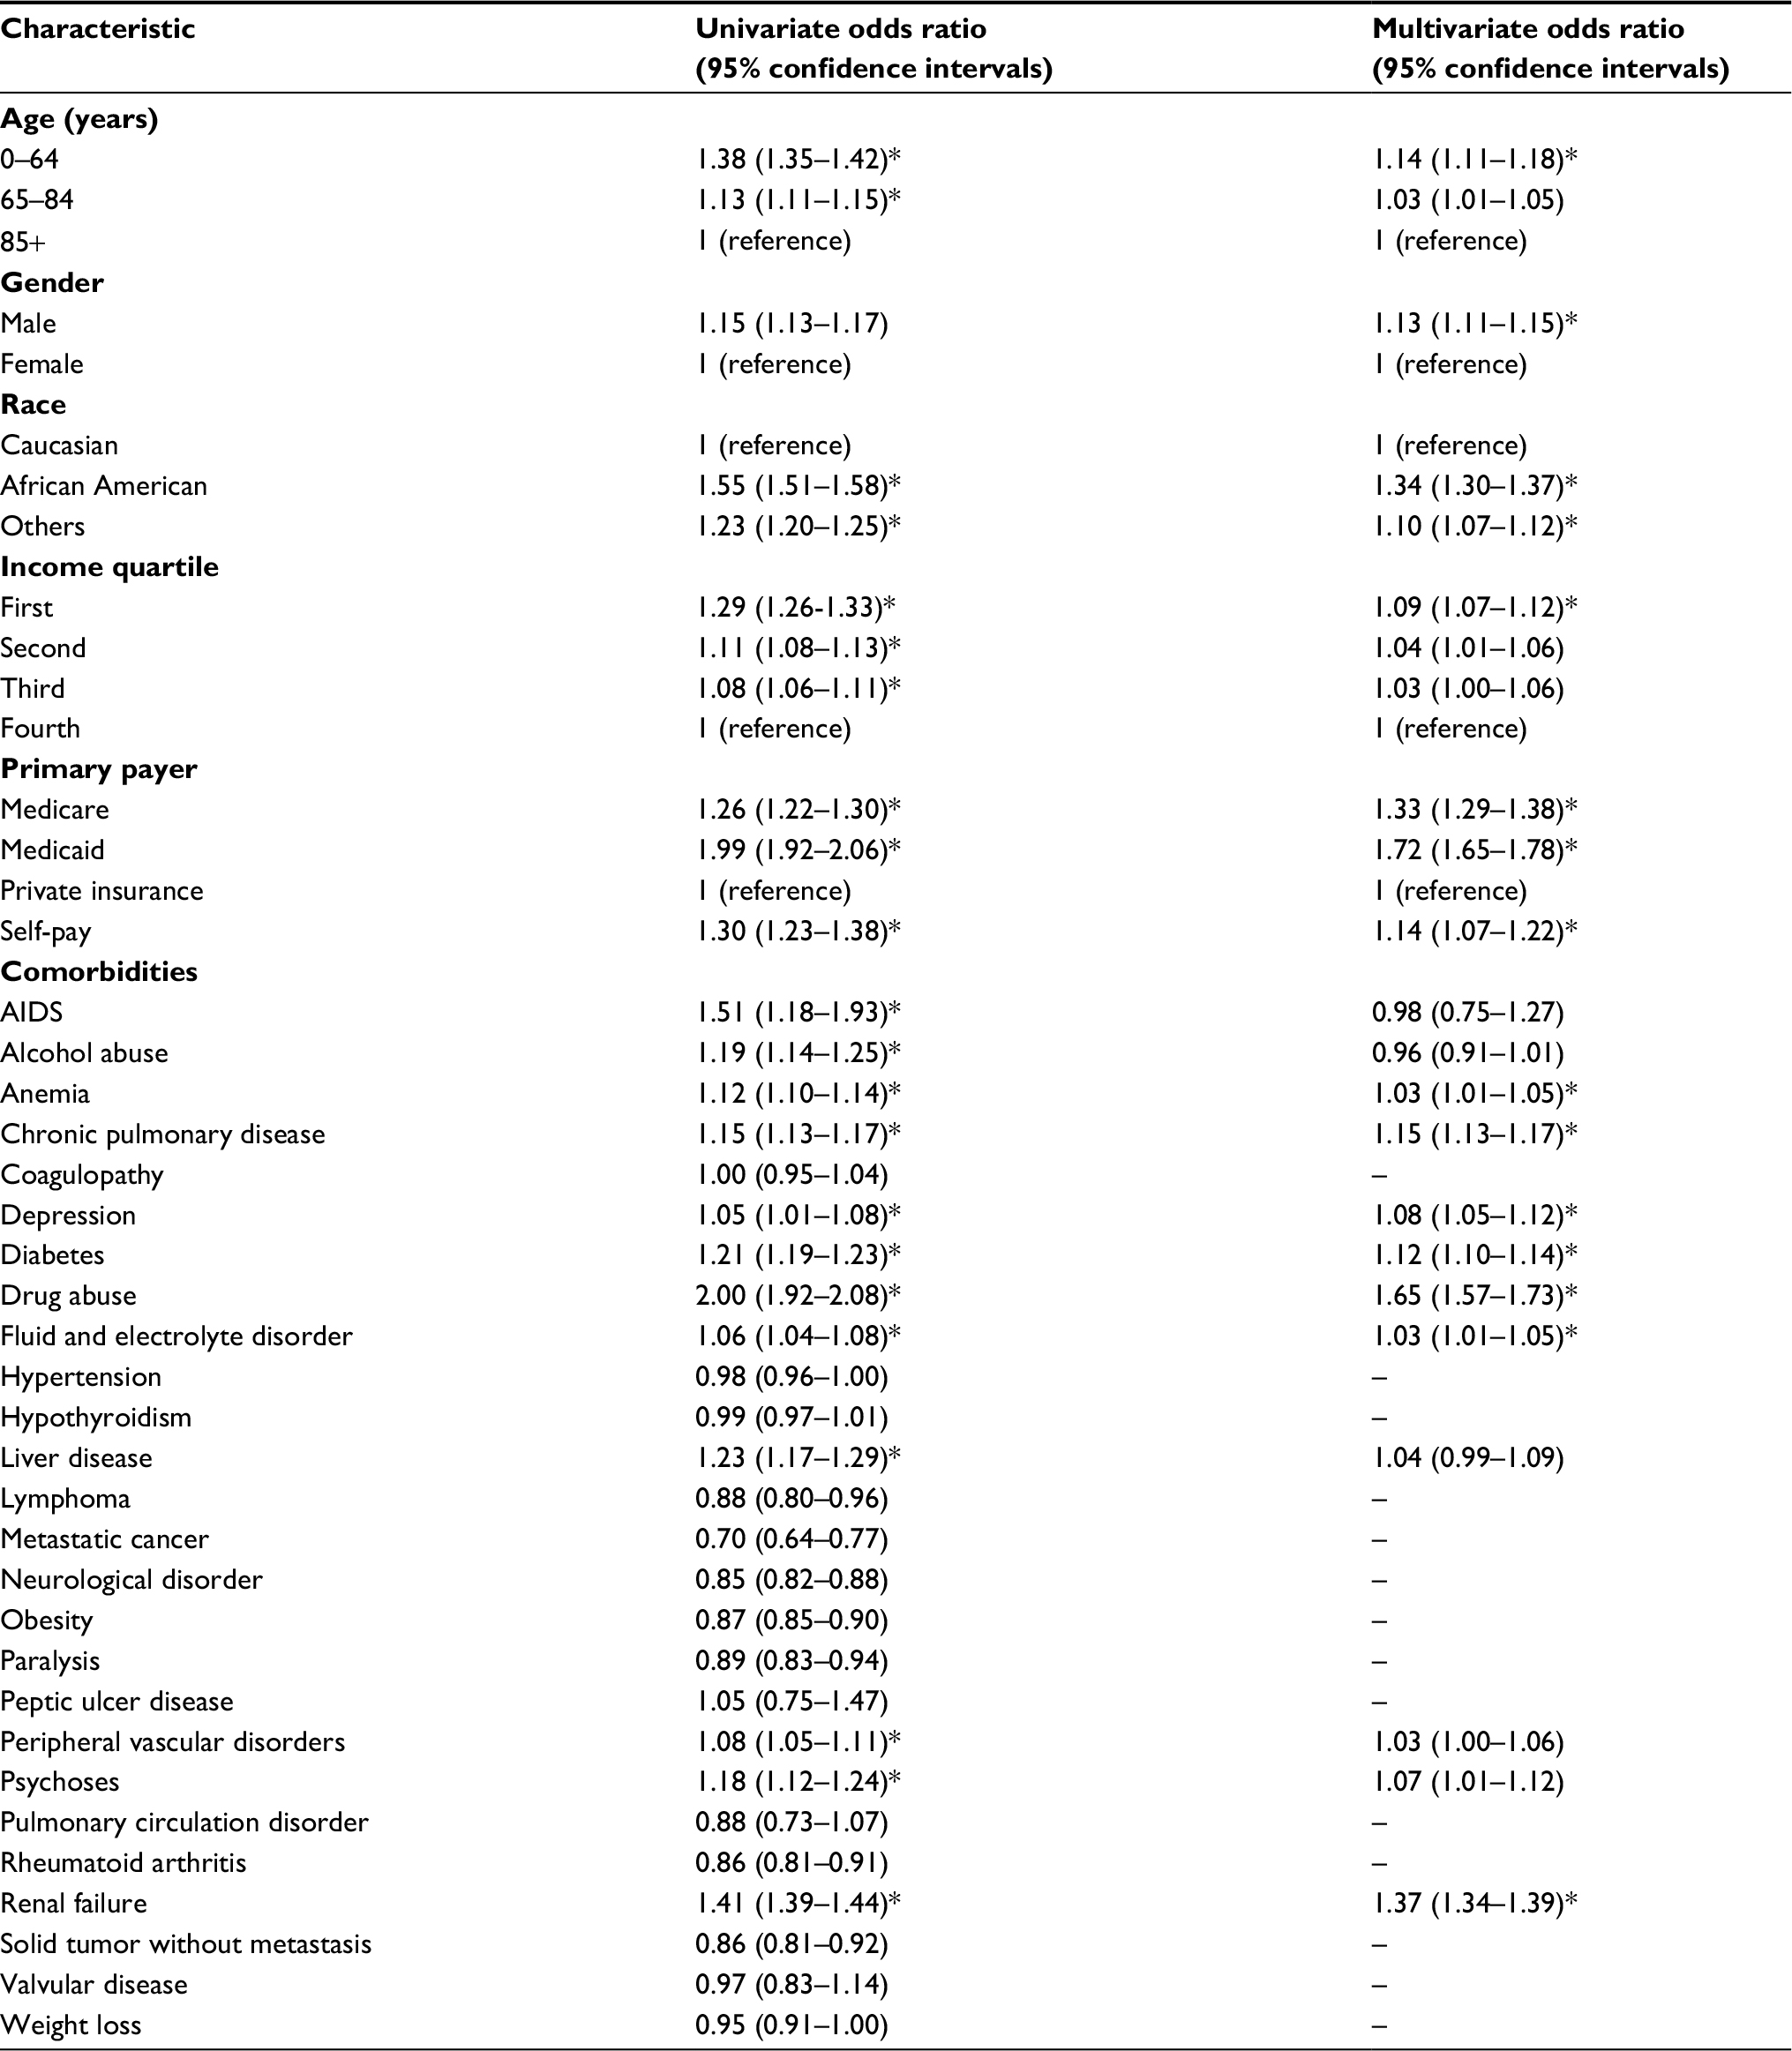 | Table 3 Univariate and multivariate analyses of factors predicting readmission for heart failure patients of the derivation cohort Notes: Anemia combines chronic blood loss anemia and iron deficiency anemia. Diabetes combines complicated and uncomplicated diabetes. *Statistically significant at P-value <0.01. |
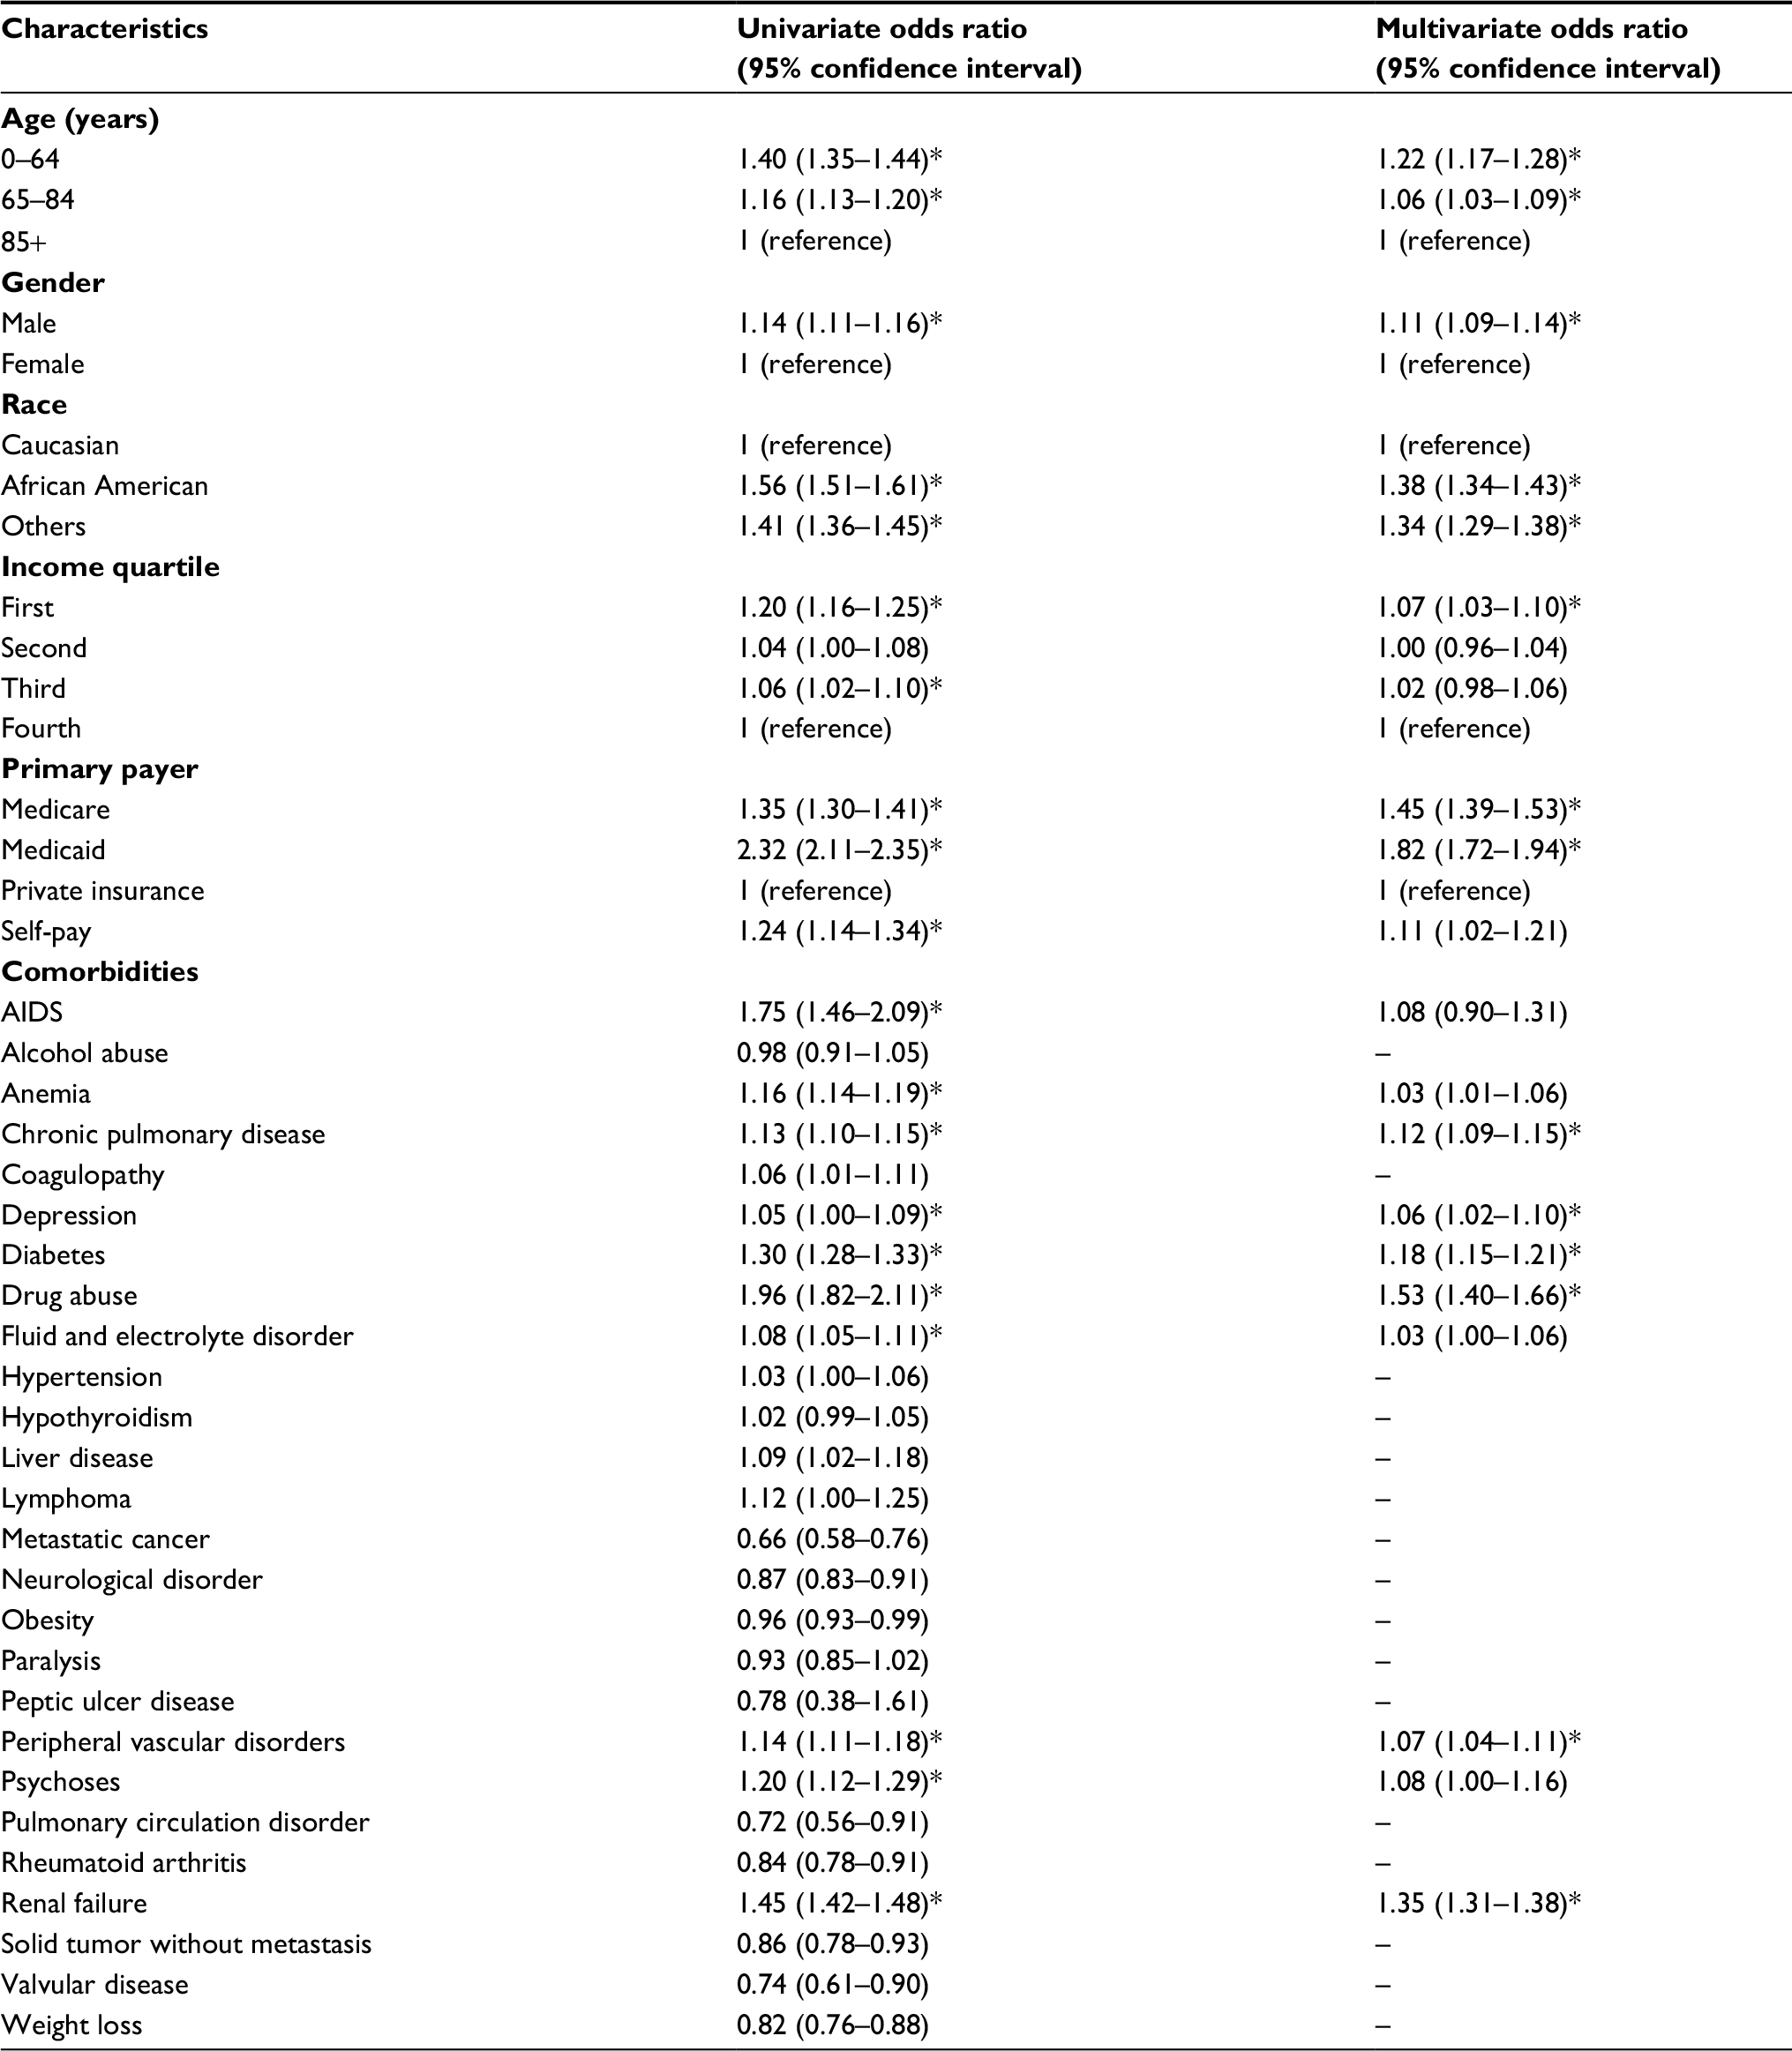 | Table 4 Univariate and multivariate analyses of factors predicting readmission for heart failure patients of the validation cohort Notes: Anemia combines chronic blood loss anemia and iron deficiency anemia. Diabetes combines complicated and uncomplicated diabetes. *Statistically significant at P-value <0.01. Abbreviation: AIDS, acquired immunodeficiency syndrome. |
Multivariate analysis
On multivariate analysis of the derivation cohort, factors determined to be independently associated with increased readmission rates included age <65 years (OR 1.14; 95% CI, 1.11–1.18), male gender (OR 1.13; 95% CI, 1.11–1.15), African American (OR 1.34; 95% CI, 1.30–1.37), race other than Caucasian and African American (OR 1.10; 95% CI, 1.07–1.12), first income quartile (OR 1.09; 95% CI, 1.07–1.12), Medicare (OR 1.33; 95% CI, 1.29–1.38), Medicaid (OR 1.72; 95% CI, 1.65–1.78), self-pay (OR 1.14; 95% CI, 1.07–1.22), chronic pulmonary disease (OR 1.15; 95% CI, 1.13–1.17), depression (OR 1.08; 95% CI, 1.05–1.12), diabetes (OR 1.12; 95% CI, 1.10–1.14), drug abuse (OR 1.65; 95% CI, 1.57–1.73), fluid and electrolyte disorder (OR 1.03; 95% CI, 1.01–1.05), and renal failure (OR 1.37; 95% CI, 1.34–1.39); P<0.01 (Table 3).
Similarly, in the validation cohort multivariate analysis, factors determined to be independently associated with increased readmission rates were age <65 years (OR 1.22; 95% CI, 1.17–1.28), age 65–84 years (OR 1.06; 95% CI, 1.03–1.09), male gender (OR 1.11; 95% CI, 1.09–1.14), African American (OR 1.38; 95% CI, 1.34–1.43), race other than Caucasian and African American (OR 1.34; 95% CI, 1.29–1.38), first income quartile (OR 1.07; 95% CI, 1.03–1.10), Medicare (OR 1.45; 95% CI, 1.39–1.53), Medicaid (OR 1.82; 95% CI, 1.72–1.94), chronic pulmonary disease (OR 1.12; 95% CI, 1.09–1.15), depression (OR 1.06; 95% CI, 1.02–1.10), diabetes (OR 1.18; 95% CI, 1.15–1.21), drug abuse (OR 1.53; 95% CI, 1.40–1.66), peripheral vascular disorder (OR 1.07; 95% CI, 1.04–1.11), and renal failure (OR 1.35; 95% CI, 1.31–1.38); P<0.01 (Table 4).
RAHF scale
Factors associated with an increased 30-day CHF readmission risk from the multivariate analysis were included in the creation of the RAHF scale. Each variable was assigned a score based on its OR (Table 5). The RAHF scale was then used to predict a patient’s readmission risk for the New York and California states (derivation cohort). The percentage of patients readmitted for each score was plotted, and logistic regression with residual plots was performed (Figure 4A and B). An R2 of 0.9845 was calculated, meaning that the RAHF score could explain 98.45% of readmission variability.
 | Table 5 Values for components of Readmission After Heart Failure risk scale Note: Diabetes combines complicated and uncomplicated diabetes. |
 | Figure 4 Derivation cohort. Notes: (A) Percent readmission vs RAHF risk score for the derivation cohort. (B) Plot of residuals for observed vs expected RAHF risk scores for the derivation cohort. Abbreviation: RAHF, Readmission After Heart Failure. |
To assess the accuracy of the RAHF scale, a validation cohort with two different states was used. Logistic regression with residual plots was performed, and an R2 value of 0.9588 was calculated, meaning that the RAHF scale could explain 95.88% of readmission variability (Figure 5A and B).
 | Figure 5 Validation cohort. Notes: (A) Percent readmission vs RAHF risk score for the validation cohort. (B) Plot of residuals for observed vs expected RAHF risk scores for the validation cohort. Abbreviation: RAHF, Readmission After Heart Failure. |
Determining cutoff points for risk groups
The average RAHF score was 12.08 (standard deviation [SD], 8.01) for patients who were not readmitted and 14.25 (SD, 8.69) for patients who were readmitted. Therefore, we set our cutoff points for the RAHF score at <12 for a low risk of readmission, 12–15 for moderate risk, and >15 for high risk. The readmission rates were 7.58, 9.78, and 12.0% in the low-, moderate-, and high-risk groups, respectively (P<0.01). The relative risk of readmission was 1.67 (95% CI, 1.65–1.69) in the high-risk group compared to the low-risk group.
Discussion
CHF affects >5 million Americans and accounts for over a million hospitalizations each year.1 CHF has a high rate of readmission within the USA, with 30-day readmission rates >10% and 6-month readmission rates at ~50%.7 Many of these readmissions are considered preventable readmissions.7,11 Viewed as a national quality improvement initiative and a major means to curtail preventable excesses in federal expenditure, the ACA requires that the CMS reduce payments to hospitals with excessive preventable readmissions for illnesses, including CHF, to save an estimated $132 billion over 10 years.7,12 With 2/3 of hospitals penalized by the start of 2014 for having excess readmission rates, identifying patients with the highest readmission risk has become a major priority for many hospitals and health centers to permit early risk stratification and preventative intervention.9
Concurrent with other reports on CHF readmission rates among Medicare beneficiaries, this study identified highest 30-day CHF readmission rates among African Americans, patients aged <65 years, patients from lower income households, and those with multiple comorbidities. Aranda et al conducted a retrospective study involving 28,919 Medicare patients with CHF and reported that patients aged <65 years had significantly higher odds of readmission (OR 1.0) than patients aged 65–85 years (OR 0.83) or >85 years (OR 0.94), P<0.05. African Americans (OR 1.05) and patients with hospitalizations for heart failure in the previous calendar year (OR 1.58) and hospitalizations in the last 6–9 months (OR 1.67) and index hospital length of stay >7 days (OR 1.52) were associated with increased readmission rates, P<0.05. Comorbidities including diabetes (OR 1.13), peripheral vascular disease (OR 1.17), and stroke (OR 1.17) were also associated with an increased readmission risk; P<0.05.13 Patients on Medicare have also been shown to have higher readmission rates compared to Medicaid and private insurance. Medicare patients have been reported to experience the highest readmission rates, with studies reporting 6-month all cause readmission rates as high as 44%, 18% of which were attributable to CHF.14 Allen et al (2012)15 conducted a retrospective study involving 4,584 patients from the Medicaid Administrative Claims Database and reported higher 30-day all-cause readmission rates (17.4 vs 11.8%) and 30-day CHF readmission rates (6.7 vs 4.0%) among Medicaid patients compared to patients with commercial insurance. In an analysis of administrative discharge data on 41,776 patients from 236 hospitals in New York State, Philbin and DiSalvo16 also showed a decreasing trend in CHF readmission rates from lowest income quartile to highest and found that lower income was a statistically significant predictor of CHF readmission risk (OR 1.18, P<0.001).
Studies have documented various factors contributing to hospital readmissions, including complications from in-hospital treatment, inadequate coordination of care and quality of care or care coordination, and insufficient patient education and follow-up.17,18 The most beneficial strategy to reduce readmissions appears to be coordinated care.19–21 Coordination of care among physicians and patient-centered approaches were more successful than single physician approaches with disease-centered management, at reducing readmissions.19 Dharmarajan et al20 reported that most readmissions among patients with CHF, pneumonia, and acute myocardial infarction were not attributed to the initial diagnosis. Although the main reason for 30-day readmission after CHF hospitalization was due to CHF, this accounted for only 35.2%, followed by renal disorders (8.11%), pneumonia (4.98%), arrhythmias and conduction disorders (4.04%), and septicemia and shock (3.55%).20 Effective strategies for preventing CHF readmissions should include interventions across a full continuum of care from hospital to outpatient clinic and home. Enhancing initial risk stratification to safely increase emergency department discharges, or transitioning low-risk patients to alternative treatment pathways and avoiding hospitalizations, is crucial to conserving health care resources. Risk stratification models have been created in the past and employed with varying rates of effectiveness.22–27 Basoor et al22 conducted a prospective randomized controlled trial involving 96 inpatients with CHF, of whom 48 patients were provided with a checklist at discharge that included relevant counseling, medication and dose information, as well as follow-up instructions, while the other 48 patients were discharged without this checklist. Patients who received the CHF discharge checklist had higher rates of outpatient and medication compliance, as well as reduced 30-day (6 vs 19%, P>0.05) and 6-month (23 vs 46%, P=0.045) CHF readmission rates, compared to those who did not receive the checklist.22 Phillips et al24 conducted a review including 18 studies and 3,304 inpatients with CHF, evaluating the use of comprehensive discharge planning and support, which included education and periodic follow-up visits. After a mean observation time of 8 months, the use of comprehensive discharge planning was associated with a significant reduction in readmission rates (relative risk [RR] 0.75; CI, 0.64–0.88) and a trend toward a reduction in all-cause mortality (RR 0.87; CI, 0.73–1.03), with no significant difference in the length of stay (8.4 vs 8.5 days, P=0.60) or costs (−$359, P=0.10 for non-US centers and -$536, P=0.03 for US centers).24 More patients receiving the comprehensive discharge plan also reported improved quality of life (25.7 vs 13.5%, P=0.01).24
The RAHF scale is intended to be used by clinicians to quickly and accurately risk stratify patients during the initial hospitalization for CHF. A mobile application should allow clinicians to quickly and accurately calculate an individual’s unique risk of 30-day readmission, enabling improved coordination of care between health care professionals and implementation of various strategies to prevent readmissions among high-risk patients. This scale should help physicians make better clinical decisions about duration and aggressiveness of patient treatment and management and help curtail premature discharges for patients with high readmission risk. Inpatient risk stratification and outpatient medical management should be coupled with strong pharmacy, social work, and community health partner support to focus on specific barriers to effective care.28 Shifting appropriate care to outpatient and hospice palliative care during the final phase of decompensated CHF with appropriate advanced care planning could also help with patient care and decrease readmissions for CHF.28
Reducing readmissions not only reduces health care expenditures but also most importantly improves patient outcomes and satisfaction. Readmissions are not only inconvenient and costly to the patient but also come with inherent risks such as hospital-acquired infections, which impact negatively on patient outcomes.
There are several limitations to this study, which are inherent to the retrospective nature of this study. This study did not utilize the exact HRRP guidelines; however, given the changes in the current political climate and health care laws, these guidelines will likely change. Furthermore, since data from four states of the SID were utilized, determining all-cause readmission would limit generalizability to different patient populations around the world. Different patient populations around the world likely have different reasons for readmissions; however, CHF-related readmissions are probably similar. For example, insurance coverage would not play an important role in countries with universal health care coverage, including Canada and Australia. Although the risk factors may vary slightly between countries, overall readmission rates for CHF patients mirror those found in other countries such as Canada, Europe, and Australia. Readmission risk also constantly changes, as it is dependent on numerous factors, including disease progression, and treatment and management received, which are not included in the SID and difficult to measure with any retrospective large database. Furthermore, in addition to patient factors, clinician provider and hospital factors also impact patient outcomes including readmission risk. These factors are all important in the study of patient outcomes and CHF readmission and should be investigated in smaller scale clinical trials. Further limitations include sampling and coding errors, misclassified variables, and the difficulty in accurately obtaining readmission data for all patients. In this study, CHF diagnosis and presence of comorbidities were based on the presence of administrative codes within the SID database and were not clinically confirmed; however, it has been shown that administrative codes are highly specific for cardiovascular risk factors and diagnoses.29 The SID database does not contain outpatient data, and therefore, this study could not assess changes in CHF care in outpatient clinics and emergency departments, leading to an underestimation in overall rates of CHF. There may also be an element of selection bias, since patients with missing data for any studied variables were excluded in the application of this scale. However, this limitation would apply to all groups and should not negate overall findings. The four states used for the derivation and validation cohorts were selected a priori based on the availability of readmission variables. Although there may be similarities between these states, these populations are large and from different geographic locations, which should adequately represent the entire country. Despite these limitations, the SID database provides a large sample size and allows accurate measurement of changing trends in CHF admissions and the factors influencing readmissions. However, further studies are warranted to examine long-term follow up, late complications, and outpatient mortality to further decipher the causes of CHF readmissions. Furthermore, additional validation of this scale should be applied to smaller, unique populations that may not be representative of the entire USA.
Conclusion
More than 5 million Americans suffer from CHF. Medicare reimbursements for inpatient CHF have been disproportionately high, prompting the establishment of the ACA and the development of an HRRP requiring the CMS to penalize hospitals with excess CHF readmissions by reducing reimbursements. As a result, it is crucial to identify patients at high risk of readmission. Given current scrutiny of health care spending, the RAHF scale was created to predict 30-day CHF readmission and to identify high-risk patients with CHF to allow implementation of individualized precautionary and preventive care strategies. By predicting readmission risk based on demographic and clinical factors during index admission, risk stratification models such as the RAHF scale should improve overall patient quality of care and outcomes while reducing overall health care expenditures.
Disclosure
The authors report no conflicts of interest in this work.
References
Mozaffarian D, Benjamin EJ, Go AS, et al. Heart disease and stroke statistics-2016 update: a report from the American Heart Association. Circulation. 2016;133:e38–e360. | ||
Rosamond W, Flegal K, Furie K, et al. Heart disease and stroke statistics – 2008 update: a report from the American Heart Association Statistics Committee and Stroke Statistics Subcommittee. Circulation. 2008;117:e25–e146. | ||
Centers for Medicare and Medicaid Services. National Health Expenditure Data: Historical. 2015. Baltimore, MD, USA. | ||
Fuchs VR. The gross domestic product and health care spending. N Engl J Med. 2013;369:107–109. | ||
Medicare Payment Advisory Commission. March 2016: Report to the Congress: Medicare Payment Policy (Chapter 3: Hospital Inpatient and Outpatient Services). 2016. Washington, DC, USA. | ||
Heidenreich PA, Albert NM, Allen LA, et al. Forecasting the impact of heart failure in the United States: a policy statement from the American Heart Association. Circ Heart Fail. 2013;6(3):606–619. | ||
Medicare Payment Advisory Commission. June 2007 Report to the Congress: Promoting Greater Efficiency in Medicine (Chapter 5: Payment Policy for Inpatient Readmissions). 2007. Washington, DC, USA. | ||
The Patient Protection and Affordable Care Act, HR 3590, 11th Cong (2010); 2010. | ||
Joynt KE, Jha AK. A path forward on Medicare readmissions. N Engl J Med. 2013;368:1175–1177. | ||
Fingar K, Washington R. Trends in Hospital Readmissions for Four High-Volume Conditions, 2009-2013: Statistical Brief #196. 2006. Rockville, MD, USA. | ||
Lee KK, Yang J, Hernandez AF, Steimle AE, Go AS. Post-discharge follow-up characteristics associated with 30-day readmission after heart failure hospitalization. Med Care. 2016;54(4):365–372. | ||
Berenson RA. Implementing health care reform – why Medicare matters. N Engl J Med. 2010;363:101–103. | ||
Aranda JM, Krause-Steinrauf HJ, Greenberg BH, et al. Comparison of the beta blocker bucindolol in younger versus older patients with heart failure. Am J Cardiol. 2002;89:1322–1326. | ||
Krumholz HM, Parent EM, Tu N, et al. Readmission after hospitalization for congestive heart failure among Medicare beneficiaries. Arch Intern Med. 1997;157(1):99–104. | ||
Allen LA, Smoyer Tomic KE, Smith DM, Wilson KL, Agodoa I. Rates and predictors of 30-day readmission among commercially insured and Medicaid-enrolled patients hospitalized with systolic heart failure. Circ Heart Fail. 2012;5(6):672–679. | ||
Philbin EF, DiSalvo TG. Influence of race and gender on care process, resource use, and hospital-based outcomes in congestive heart failure. Am J Cardiol. 1998;82(1):76–81. | ||
Lu N, Huang KC, Johnson JA. Reducing excess readmissions: promising effect of hospital readmissions reduction program in US hospitals. Int J Qual Health Care. 2016;28(1):53–58. | ||
Kocher RP, Adashi EY. Hospital readmissions and the Affordable Care Act: paying for coordinated quality care. JAMA. 2011;306:1794–1795. | ||
Williams MV. A requirement to reduce readmissions: take care of the patient, not just the disease. JAMA. 2013;309:394–396. | ||
Dharmarajan K, Hsieh AF, Lin Z, et al. Diagnoses and timing of 30-day readmissions after hospitalization for heart failure, acute myocardial infarction, or pneumonia. JAMA. 2013;309(4):355–363. | ||
Scott KW, Jha AK. Putting quality on the global health agenda. N Engl J Med. 2014;371:3–5. | ||
Basoor A, Doshi NC, Cotant JF, et al. Decreased readmissions and improved quality of care with the use of an inexpensive checklist in heart failure. Congest Heart Fail. 2013;19(4):200–206. | ||
Collins SP, Pang PS, Fonarow GC, Yancy CW, Bonow RO, Gheorghiade M. Is hospital admission for heart failure really necessary? The role of the emergency department and observation unit in preventing hospitalization and rehospitalization. J Am Coll Cardiol. 2013;61(2):121–126. | ||
Phillips CO, Wright SM, Kern DE, Singa RM, Shepperd S, Rubin HR. Comprehensive discharge planning with postdischarge support for older patients with congestive heart failure: a meta-analysis. JAMA. 2004;291(11):1358–1367. | ||
Hansen LO, Young RS, Hinami K, Leung A, Williams MV. Interventions to reduce 30-day rehospitalization: a systematic review. Ann Intern Med. 2011;155(8):520–528. | ||
Leppin AL, Gionfriddo MR, Kessler M, et al. Preventing 30-day hospital readmissions: a systematic review and meta-analysis of randomized trials. JAMA Intern Med. 2014;174(7):1095–1107. | ||
Kansagara D, Englander H, Salanitro A, et al. Risk prediction models for hospital readmission: a systematic review. JAMA. 2011;306(15):1688–1698. | ||
Desai AS, Stevenson LW. Rehospitalization for heart failure: predict or prevent? Circulation. 2012;126:501–506. | ||
Birman-Deych E, Waterman AD, Yan Y, Nilasena DS, Radford MJ, Gage BF. Accuracy of ICD-9-CM codes for identifying cardiovascular and stroke risk factors. Med Care. 2005;43(5):480–485. |
 © 2018 The Author(s). This work is published and licensed by Dove Medical Press Limited. The
full terms of this license are available at https://www.dovepress.com/terms
and incorporate the Creative Commons Attribution
- Non Commercial (unported, 3.0) License.
By accessing the work you hereby accept the Terms. Non-commercial uses of the work are permitted
without any further permission from Dove Medical Press Limited, provided the work is properly
attributed. For permission for commercial use of this work, please see paragraphs 4.2 and 5 of our Terms.
© 2018 The Author(s). This work is published and licensed by Dove Medical Press Limited. The
full terms of this license are available at https://www.dovepress.com/terms
and incorporate the Creative Commons Attribution
- Non Commercial (unported, 3.0) License.
By accessing the work you hereby accept the Terms. Non-commercial uses of the work are permitted
without any further permission from Dove Medical Press Limited, provided the work is properly
attributed. For permission for commercial use of this work, please see paragraphs 4.2 and 5 of our Terms.