Back to Journals » Clinical Pharmacology: Advances and Applications » Volume 13
Determination of Caffeine and Hydrogen Peroxide Antioxidant Activity of Raw and Roasted Coffee Beans Around Habru Woreda, Ethiopia Using UV-Vis Spectroscopy
Authors Legas Muhammed B ![]() , Hussen Seid M
, Hussen Seid M ![]() , Habte AT
, Habte AT
Received 14 March 2021
Accepted for publication 29 April 2021
Published 24 May 2021 Volume 2021:13 Pages 101—113
DOI https://doi.org/10.2147/CPAA.S311032
Checked for plagiarism Yes
Review by Single anonymous peer review
Peer reviewer comments 2
Editor who approved publication: Professor Arthur E. Frankel
Beshir Legas Muhammed, Mohammed Hussen Seid, Adere Tarekegne Habte
Department of Chemistry, Woldia University, Woldia, Ethiopia
Correspondence: Beshir Legas Muhammed Email [email protected]
Background: Coffee is a well-known beverage that is widely used around the world. Despite the wide use of coffee in Ethiopia, there is a lack of extensive studies addressing the issues related to the caffeine content and hydrogen peroxide antioxidant activity of varieties of coffee types, particularly in Habru woreda, Ethiopia.
Objective: This study aimed to determine the caffeine content and hydrogen peroxide antioxidant activity of raw and roasted coffee beans collected directly from Habru woreda, North Wollo zone of Ethiopia.
Methods: The study was conducted in Bohoro, Girana, and Wurgisa kebeles of Habru woreda, Ethiopia, by collecting 500 g of green beans of Arabica coffee without considering their variety. Then, the collected beans were divided into raw and roasted coffee to perform aqueous and dichloromethane extraction of their caffeine content and hydrogen peroxide antioxidant activity using UV-Vis spectrophotometry.
Results: The amounts of caffeine in aqueous and dichloromethane extraction were in the range of 124.01− 191.27 ppm and 145.15− 200.09 ppm in raw and roasted coffees, respectively. Using the IC50 value, the hydrogen peroxide scavenging activity of the aqueous phase coffee bean extracts in Bohoro raw, Bohoro roasted, Wurgisa raw, Wurgisa roasted, Girana raw, and Girana roasted coffee were 32.17 ppm, 11.69 ppm, 26.14 ppm, 3.12 ppm, 24.83 ppm, and 11.06 ppm, respectively, while that of ascorbic acid was 6.91 ppm.
Conclusion: The study showed that the highest amount of caffeine in both aqueous and dichloromethane solvent extraction was found in Bohoro’s raw and roasted coffee beans. Also, the amounts of caffeine in all coffee bean samples were safe and the antioxidant activity was excellent. In most of the samples, significant variations in the concentration of caffeine in raw and roasted coffee bean samples were observed in the two extraction solvents.
Keywords: caffeine, coffee, hydrogen peroxide scavenging, UV-Vis spectroscopy
Background
Coffee is one of the most popular beverages around the world and is widely used owing to its pleasant flavor, aroma, health benefits, and stimulating properties.1,2 Botanically, it belongs to the genus Coffea, which is grown around Asia, Africa, South America, and the Caribbean region.3,4 More than 80 species of coffee have been identified worldwide, but only two are economically important. Coffea arabica, also known as Arabica coffee, is responsible for about 70% of the world’s coffee market, and Coffea canephora, or Robusta coffee, represents the rest. Arabica coffee usually commands the highest prices on the market.5
Coffee is a complex chemical mixture consisting of several bioactive compounds, such as chlorogenic acid, nicotinic acid, trigonelline, quinolinic acid, tannic acid, pyrogallic acid, and especially caffeine. The chemical composition of coffee depends mainly on the variety of coffee.6,7 It has antioxidant activity and radical scavenging activities.8 It also donates hydrogen and electrons, which provide reducing activity and also act as metal ion pro-oxidant chelators. Research has shown that coffee components can trigger tissue antioxidant gene expression and protect against gastrointestinal oxidative stress.9 Caffeine from brewed coffee and bioactive compounds from coffee have received considerable attention owing to their potential health benefits, such as potentially protecting against chronic degenerative diseases, cancers, and cardiovascular diseases, as well as other illnesses that can be mitigated by antioxidant activity.1,10
Caffeine is a bitter white crystalline natural alkaloid that acts as a mild psychoactive stimulant drug. It is found in varying quantities in the seeds, leaves, or fruits of many plant species such as coffee, cocoa beans, cola nuts, and tea leaves. In humans, caffeine acts as a central nervous system stimulant; hence, it is used both recreationally and medically to reduce physical fatigue and restore mental alertness when unusual weakness or drowsiness occurs. However, the use of caffeine in high doses can cause health concerns, such as gastric acid secretion and a higher risk of miscarriage.3,11 It is considered the most active component in coffee and has a protective role against several chronic diseases, including type 2 diabetes mellitus and Parkinson’s disease.12
Ethiopia is the motherland and center of genetic diversity of Arabica coffee. Coffee grown in lowland, midland, and highland areas of the country exhibits varying characteristics in terms of its physical and chemical composition.13 Arabica coffee is superior quality coffee and sells for a higher price; however, Robusta does not give rise to the highest quality coffee.4 So, Ethiopia produces high-quality Arabica coffee, which it exports for foreign exchange earnings.1 The quality of a cup of coffee depends on the geographical origin, soil type, climatic condition, genetic properties, cultivation system, and postharvest processing and roasting of the coffee beans.14,15 The composition of coffee fruit may be influenced by the method of extraction. Thus, the extraction of caffeine from different parts of the coffee fruit has been investigated in several studies using different solvents, including one-step extraction with a solvent system, such as water, methanol, ethanol, acetone, ethyl acetate, chloroform, or dichloromethane.16–18
The most common analytical techniques used to analyze and quantify the caffeine level in coffee are ultraviolet–visible (UV-Vis) spectroscopy,5,19,20 high-performance liquid chromatography,21 ultra-high-performance liquid chromatography coupled to high-resolution Orbitrap mass spectrometry,22,23 and Fourier-transform infrared.17 Most research activities have been focused on chromatographic methods; however, the UV-Vis spectroscopic method is preferred because of its rapidity, ease of use, low cost, high accuracy, and reproducibility in the determination of the caffeine content in coffee samples.24
In Ethiopia, there are different coffee types, recognized by their origin and quality and used as trade names, including Bebeka, Harar, Jimma, Kaffa, Wollega, Limmu, Sidama, Teppi, and Yirgacheffe. The amount of caffeine in a cup of coffee can vary greatly, depending on both intrinsic factors involving the species and/or its origin and extrinsic factors such as sampling locality and the method of brewing.21 Despite the wide use of coffee in the Amhara region of North Wollo zone, Ethiopia, there is a lack of extensive studies addressing the issues related to the caffeine content of varieties of the coffee type occurring in Habru woreda, Ethiopia. Therefore, this study aimed to determine the caffeine content of raw and roasted coffee beans collected directly from Bohoro, Wurgisa, and Girana kebeles, in Habru woreda of North Wollo zone of Ethiopia, using the UV-Vis spectrophotometric method, and hydrogen peroxide antioxidant activity in aqueous extraction.
Methods
Description of the Study Area
The study was conducted in Habru woreda, which is located in the North Wollo zone of Amhara national regional state of Ethiopia. The woreda is bordered to the south by the Mille River, which separates North Wollo from South Wollo zone, to the west by Gubalafto woreda, to the north by the Alawuha River, which separates Habru from Kobo woreda, and to the east by the Afar region, as shown in the Figure 1. Habra woreda is 491 km from Addis Ababa, which is the capital city of Ethiopia, 385 km from Bahir Dar, the capital city of Amhara national regional state, and 30 km from Woldia city, the capital of North Wollo zone. The administrative center of the woreda is Mersa town. Currently, this woreda has 35 kebeles: five kebeles are included in the town administration whereas 30 kebeles are found in rural areas, with a total area of 1239.79 km2 (1, 23,979 ha).
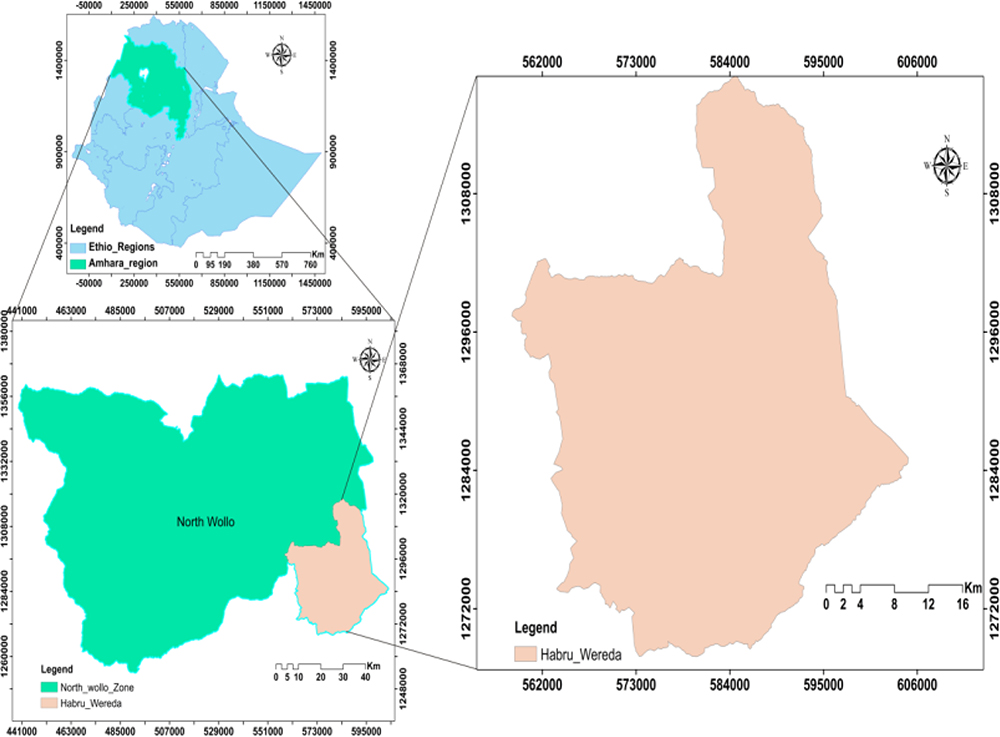 |
Figure 1 Map of the study area. |
The mean annual temperature and rainfall are 21.89°C and 725 mm, respectively.
Materials and Chemicals
The material and instruments used in this experiment were an electronic balance, measuring cylinder, magnetic stirrer, glass filter, funnel, filter paper, different sizes of beakers and volumetric flask, quartz cuvette, separatory funnel, hulling machine, and UV-Vis spectrometer (Lambda 35 Perkin Elmer).
The chemicals and reagents used in this study were of analytical grade, including dichloromethane, distilled water, MgSO4, NaH2PO4.H2O, Na2HPO4, H2O2, ascorbic acid, and caffeine.
Collection of Coffee Sample
The Arabica coffee beans were collected from Bohoro, Girana, and Wurgisa kebeles of Habru woreda rural areas of North Wollo zone of Amhara regional state, Ethiopia, without considering their varieties. They was taken to the analytical chemistry laboratory of Woldia University for the experimental work. The red cherries were picked and sun-dried with proper labeling for the entire sample from each site separately. After 3 weeks of drying, using the hulling machine, the dried pods were hulled, cleaned, and polished. Finally, 500 g of green beans were packed and saved in a polyethylene bag, for use in the experimental analysis of raw and roasted coffee beans.
Preparation of Standard Caffeine Solutions
Before preparation of a solution, all the glassware was soaked overnight with a chromic acid solution, washed thoroughly with water and detergent, then rinsed with distilled water and dried in the oven overnight, and transferred to desiccators before use.10
The standard solution was prepared according to the following procedure.
A 100 ppm stock standard solution of caffeine was prepared by dissolving 0.025 g of caffeine in 250 mL purified dichloromethane (CH2Cl2) or distilled water. After this, the aqueous phase working standard solutions of 1, 2, 3, 4, 5, and 6 ppm were prepared by serial dilution of the stock solution with distilled water in 100 mL volumetric flasks. The organic phase working standard solutions of 4, 8, 12, 16, and 20 ppm were prepared with dichloromethane in 50 mL volumetric flasks. After preparing both solutions, the content of caffeine solutions was thoroughly swirled for 15 min.
The λmax was determined by scanning a single standard solution from the 200–600 nm range of the UV-Vis spectrometer and the absorbance versus wavelength of the standard solution was plotted against the corresponding reagent blank. Then, the calibration curve was analyzed using triplicate analysis to measure standard and sample solutions at a particular λmax. The absorbance values were plotted against a working standard solution to generate a standard calibration curve at the specific λmax of each solvent. Finally, the molar absorption coefficients of caffeine in dichloromethane and in distilled water were obtained. The quantitative amount of caffeine in samples (ppm) was then determined using the standard curve.18,21
Preparation of Coffee Bean Samples
The 500 g of coffee beans was divided equally into raw and roasted coffee beans for each of the three sampling sites individually with their identification code. Then, 250 g portions of each coffee bean were roasted using a local coffee roasting machine. After cooling, the roasted and raw coffee beans were separately ground using a coffee grinder and screened through a 250 µm sieve to achieve a uniform texture. Then, 2.5 g portions of sieved powder of the roasted and raw coffee beans were weighed and transferred into a 100 mL beaker individually. For each beaker, 50 mL of previously boiled distilled water was added and heated gently to 60°C, then covered with a watch glass that had a magnetic stirrer to remove caffeine easily from the solution. The coffee solution was filtered by Whitman’s no. 40 filter paper, the residue was washed twice with 15 mL of boiled distilled water, and the precipitate was pressed. The obtained extracts were combined in a single beaker cooled at room temperature.25
Liquid–Liquid Extraction
The filtrate (sample solution) and dichloromethane (CH2Cl2) were transferred to a separatory funnel (25 mL: 25 mL) and mixed with swirling by inverting the funnel for 10 min. The mixture was allowed to stand and separate into two layers: a dark aqueous top layer and a clear dichloromethane bottom layer. The non-dichloromethane layer was removed to a clean volumetric flask. Another 25 mL portion of dichloromethane was added to the aqueous solution in the separatory funnel; the extraction procedure was repeated twice and the dichloromethane layers were combined. The extract was dried with 1 g of anhydrous magnesium sulfate as a dehydrating agent, added to remove any trace water molecules, and the resulting extract was filtered.18
Then, 5 mL of the filtrate was pipetted into clean 50 mL volumetric flasks and made up to the mark with distilled water or dichloromethane. The standards and the samples were run using UV-Vis spectroscopic techniques. A calibration curve of absorbance versus concentration of the standards was plotted. The caffeine level of the various samples was calculated using the regression equation.
Method Validation
The linearity of the calibration curves was evaluated based on the magnitude of the regression coefficient (R2). The limit of detection (LOD) and limit of quantification (LOQ) of the analytical method were obtained based on the standard deviation of the response and slope of the calibration curve. In this study, the LOD and LOQ of the methods were calculated as
LOD = 3.3 σ/s
LOQ =10 σ/s
where s is the slope of the calibration curve and σ is the standard deviation of the y-intercept of the regression line.1
Hydrogen Peroxide Scavenging Activity
The ability of the aqueous extract to scavenge hydrogen peroxide was determined according to the method given by Manjusha and Merugu,26 with a few modifications. Hydrogen peroxide solution of 40 mM was prepared in phosphate buffer (0.1 M, pH 7.4). A spectrum was produced using the UV-Vis spectrophotometer using phosphate buffer solution as the blank. The aqueous coffee bean extracts and reference compounds were prepared from 20 to 100 ppm. Then, 0.6 mL solution of hydrogen peroxide was added to each aqueous coffee bean sample and the reference compound. The absorbance of hydrogen peroxide at 230 nm was determined after 10 min against a blank solution containing phosphate buffer without hydrogen peroxide and compared with ascorbic acid as the reference compound. The percentage of hydrogen peroxide scavenging of both extracts and the standard compound was calculated:
H2O2 scavenging activity (%) = , where AC is the absorbance of the control and AS is the absorbance of the sample or standard.
Data Analysis
Experimental data were analyzed using Origin 8 software and Microsoft Office Excel 2007. The mean caffeine level in all coffees sampled was compared using paired t-tests, and percentage inhibition using unequal variances of t-test with statistical significance at α=0.05. Correlations and relationships of the caffeine level in all coffee samples were evaluated using Pearson’s correlation coefficient. All analyses were performed in triplicate and data are expressed as mean ± SD (n=3).
Results
Selection of Maximum Wavelength
For the UV-Vis spectroscopic determination of caffeine, the spectrum was recorded in the region of 230–350 nm using a 1 ppm standard caffeine solution, which was prepared by diluting 1 mL stock solution in 100 mL with distilled water. The spectrum gave an absorption band, which was characterized by a single intense peak at λmax=271 nm, as shown in Figure 2.
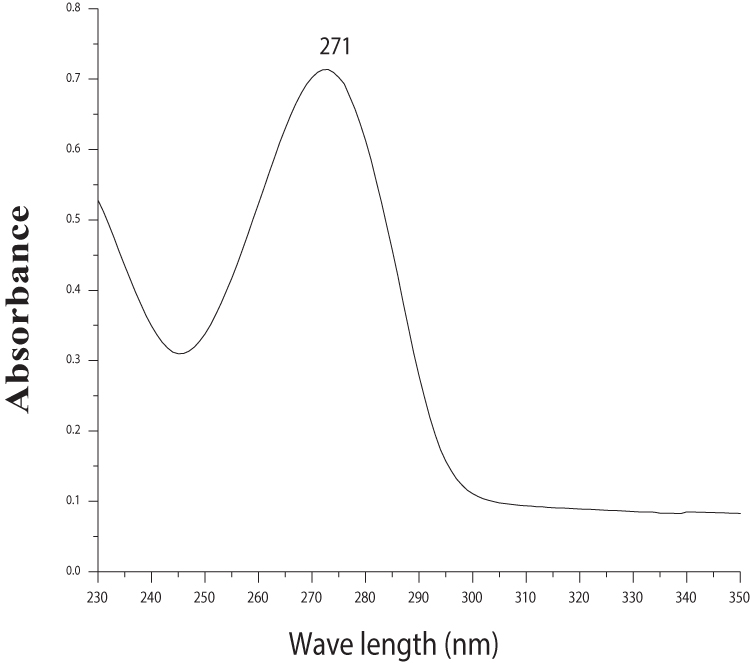 |
Figure 2 Maximum wavelength (λmax) of caffeine in distilled water with the UV-Vis spectroscopic method. |
Similarly, for the selection of the maximum absorbance of caffeine in dichloromethane, absorbance measurement was carried out in the UV-Vis spectroscopic region of 230–350 nm using 4 ppm standard caffeine solution. The results obtained from the spectrum showed that a maximal absorption occurred at λmax=274 nm, as shown in Figure 3.
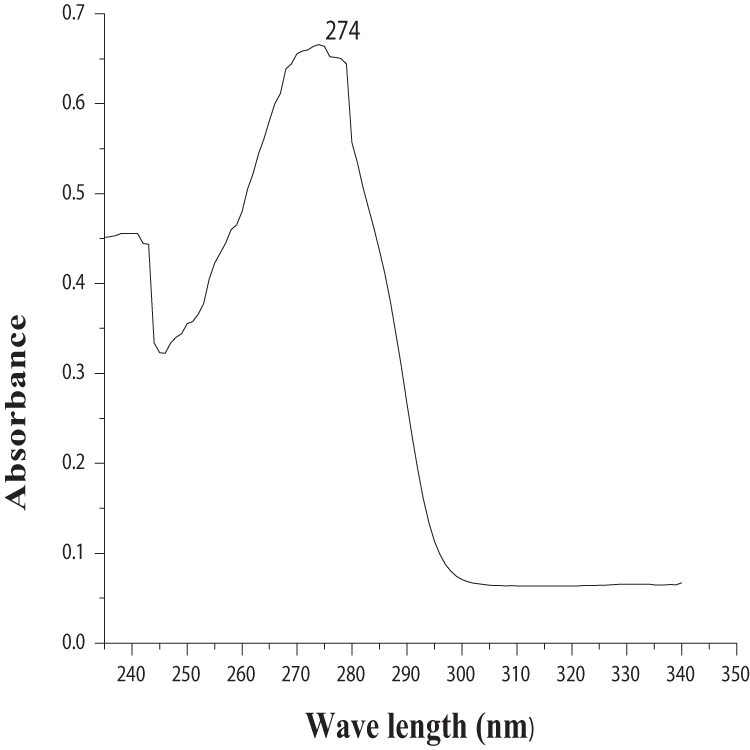 |
Figure 3 Maximum wavelength (λmax) of caffeine in dichloromethane with the UV-Vis spectroscopic method. |
Calibration Curve of Caffeine in the Aqueous Phase
The calibration graph (Figure 4) shows a strong positive correlation between the absorbance and the concentration of the caffeine standards. The linearity studies showed that caffeine content was linear in the concentration range of 1–6 ppm, with an R2 value of 0.9956. This calibration curve was used to determine the caffeine content in various coffee samples. The calibration equation was: y = 0.2789x + 0.117, R2=0.9956, SD=0.0352, N=3, where y is absorbance, x is the concentration of caffeine, N is the number of trials, and R is the linear regression coefficient. The molar absorption coefficient of caffeine in distilled water was 54.16 M−1cm−1. The LOD and LOQ of caffeine in distilled water were 0.42 ppm and 1.26 ppm, respectively.
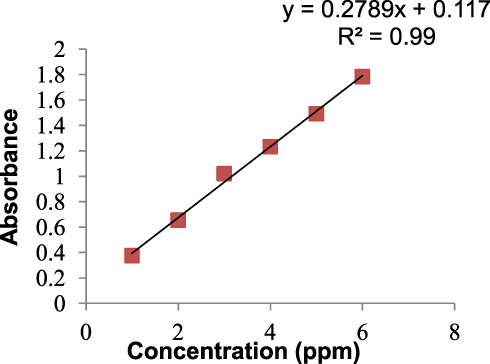 |
Figure 4 Calibration curve of standard caffeine solution in distilled water. |
Amount of Caffeine in Raw and Roasted Coffee Beans of the Aqueous Extract
The results obtained in this work for raw and roasted coffee beans with distilled water used as a solvent are presented in Table 1. The caffeine content in all coffee bean samples was observed to be in the range of 124.01–191.27 ppm.
 |
Table 1 Caffeine Content in the Coffee Samples with Aqueous Phase Extraction |
The highest caffeine concentration in the coffee bean samples was obtained in Bohoro, for both raw and roasted coffee beans, followed by Wurgisa coffee bean and Girana coffee bean samples, respectively. The average caffeine contents in Bohoro coffee samples were 190.82 ppm for raw coffee beans and 160.05 ppm for roasted coffee beans, in Wurgisa samples were 185.38 ppm for raw coffee beans and 134.65 ppm for roasted coffee beans, and in Girana coffee samples were 176.95 ppm for raw coffee beans and 125.51 ppm for roasted coffee beans. The paired t-test comparison of the mean values of caffeine in the aqueous extraction of Bohoro raw and roasted coffee beans (t2=1886.29, r=0.777, p≤0.001), Wurgisa raw and roasted coffee beans (t2=158, r=0.125, p≤0.001), and Girana raw and roasted coffee beans (t2=48.63, r=−0.649, p≤0.001) showed a significante difference in all sampling sites at α=0.05. There was also a positive correlation between the raw and roasted coffee of Bohoro, but a negative correlation for Girana beans, and a very small correlation for Wurgisa raw and roasted coffee beans.
Calibration Curve of Caffeine in Dichloromethane
The absorbance of five working standard solutions of pure caffeine in dichloromethane from 4 to 20 ppm was measured at 274 nm using a UV-Vis spectrophotometer. Validation of the method was carried out using the linearity property of Beer–Lambert’s law from the calibration graph correlating the absorbance intensity with the concentration of the caffeine standards, as shown in Figure 5. From the calibration curve (Figure 5), the calibration equation was: y = 0.1467x − 0.3352, R2=0.9959, SD=0.072, N=3, where y is absorbance, x is the concentration of caffeine, N is the number of trials, and R is the linear regression coefficient. The molar absorption coefficient of caffeine in distilled water was 28.49 M−1cm−1. The LOD and LOQ were 1.63 ppm and 4.94 ppm, respectively.
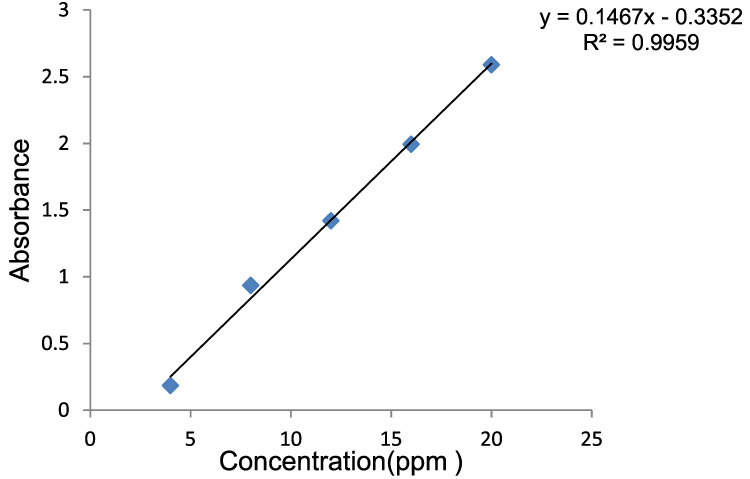 |
Figure 5 Calibration curve of standard caffeine solution in dichloromethane. |
Amount of Caffeine in Coffee Beans with Dichloromethane
Data on the caffeine content of the six coffee bean samples obtained by UV-Vis spectrophotometry are presented in Table 2. The caffeine content in all coffee bean samples was observed to be in the range of 145.15–200.09 ppm.
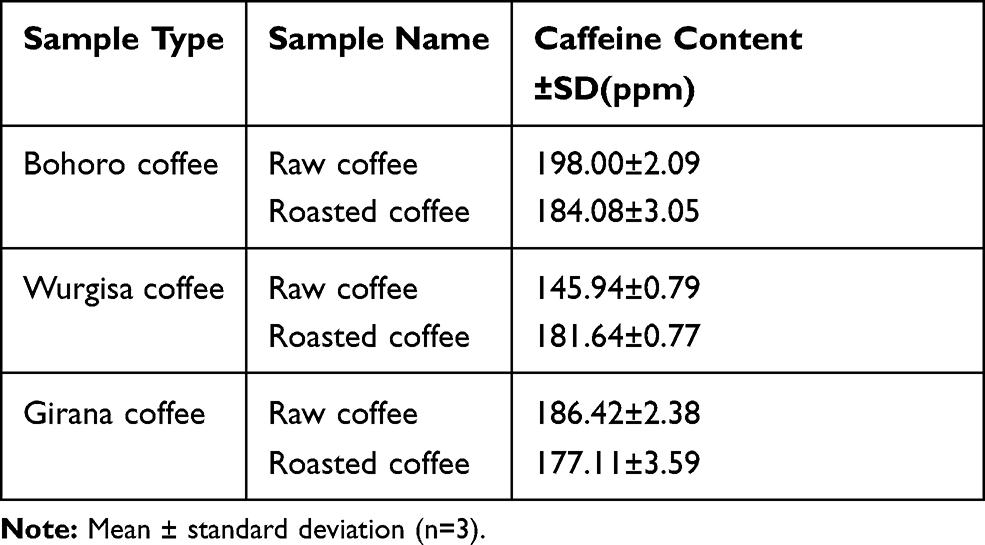 |
Table 2 Caffeine Content in the Coffee Samples with Dichloromethane Extraction |
As shown in Table 2, the highest caffeine content was obtained for both raw and roasted coffee from Bohoro, at 198.00 ppm and 184.08 ppm, respectively; then, moderate values were obtained for raw coffee from Girana coffee and roasted coffee from Wurgisa, at 186.42 ppm and 181.64 ppm, respectively. The lowest caffeine contents in the coffee samples were obtained for raw coffee from Wurgisa and roasted coffee from Girana, at 145.94 ppm and 177.11 ppm, respectively.
The paired t-test comparison of the mean value of caffeine in the dichloromethane extraction of Bohoro raw and roasted coffee beans (t2=5.45, r=−0.465, p=0.032) and Wurgisa raw and roasted coffee beans (t2=515.01, r=0.99, p≤0.001) showed a significant difference, whereas Girana raw and roasted coffee beans (t2=2.96, r=−0.65, p=0.097) did not show a significant difference at α=0.05. There was also a strong positive correlation for the raw and roasted coffees from Wurgisa, but a negative correlation for Girana, and a small negative correlation for Bohoro raw and roasted coffee beans.
Comparison of the Amount of Caffeine in Coffee Beans Extracted by Distilled Water and Dichloromethane
As shown in Figure 6, the caffeine content in roasted coffee beans from all sampling sites (Bohoro, Wurgisa, and Girana) extracted by dichloromethane had higher values than by aqueous extraction. The caffeine content in raw coffee beans from Bohoro and Girana, but not from Wurgisa, also had higher values by dichloromethane than by aqueous extraction (Figure 7). We compared the mean value of caffeine in aqueous and dichloromethane solvents in roasted coffee beans from Bohoro (t2=−15.27, r=0.88, p=0.004), Wurgisa (t2=−77.03, r=−0.962, p≤0.001), and Girana (t2=−40.62, r=−0.96, p≤0.001), and in raw coffee beans from Bohoro (t2=−4.9, r=−0.99, p=0.039), Wurgisa (t2=85.39, r=0.30, p≤0.001), and Girana (t2=−6.94, r=0.14, p=0.02), and found a significant difference at α=0.05. There was a positive correlation between the two solvents for Bohoro roasted coffee beans and a negative correlation for Wurgisa roasted, Girana roasted, and Bohoro raw coffee beans in the study area.
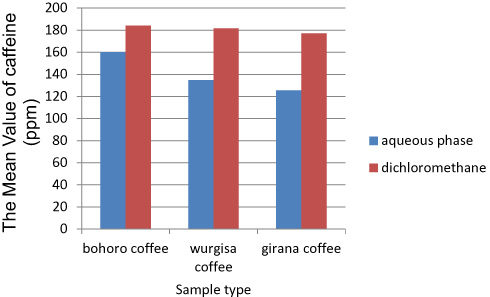 |
Figure 6 Comparison of the caffeine value in roasted coffee beans in the three sampling types. |
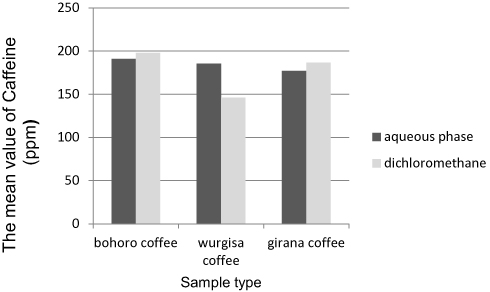 |
Figure 7 Comparison of the amount of caffeine in raw coffee beans in the three sampling types. |
As shown in Tables 1 and 2, the caffeine contents obtained by aqueous and dichloromethane extraction were in the range of 124.01–191.27 ppm (0.50–0.77%) and 145.15−200.09 ppm (0.68–0.80%), respectively.
Hydrogen Peroxide Scavenging Activity
Hydrogen peroxide (H2O2) is a biologically relevant, non-radical, oxidizing species, which may be formed in tissues through oxidative processes.32 It inactivates many enzymes by the oxidation of thiol groups, and since cell membranes show permeability to hydrogen peroxide, it can oxidize cell compounds. Owing to the high reactivity of hydrogen peroxide with metal ions, eg copper and iron, hydroxyl radicals are generated.33
The highest percentage hydrogen peroxide scavenging activity at 20 ppm was obtained in ascorbic acid (52.82±1.25), and the highest values at 40, 60, 80, and 100 ppm were obtained in Wurgisa roasted coffee (72.05±0.71, 75.77±0.45, 78.43±0.38, and 78.43±0.38, respectively) (Table 3). The lowest percentage hydrogen peroxide scavenging activity at 20 ppm was obtained in Girana raw coffee (38.8±1.38), and the lowest values at 40, 60, 80, and 100 ppm were obtained in Bohoro raw coffee (56.41±0.33, 66.61±0.47, 71.58±1.02, and 75.29±0.87, respectively), as shown in Table 3.
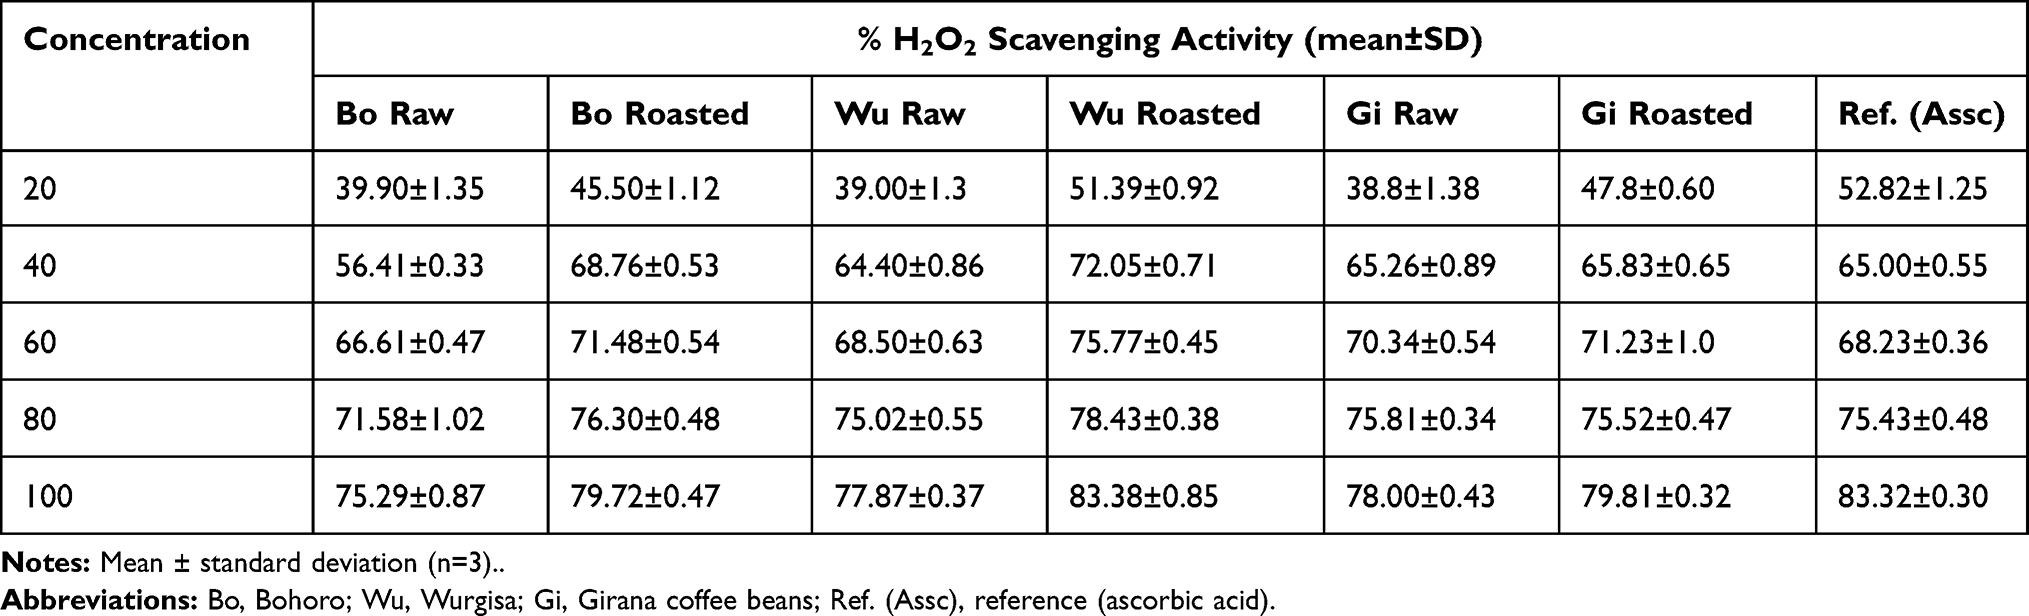 |
Table 3 Mean Percentage of Hydrogen Peroxide Scavenging Activity of an Aqueous Phase Extraction of Coffee Bean Samples, by Sampling Site, and Ascorbic Acid |
The IC50 values of the coffee samples for Bohoro raw, Bohoro roasted, Wurgisa raw, Wurgisa roasted, Girana raw, and Girana roasted beans were 32.17, 11.69, 26.14, 3.12, 24.83, and 11.06 ppm, respectively, while that of ascorbic acid was 6.91 ppm. So, Wurgisa roasted coffee had a higher hydrogen peroxide scavenging activity than the other coffee samples and ascorbic acid, which is used as a reference compound, as shown in Table 4. There was a strong positive correlation between the percentage inhibition and the concentration of aqueous phase extraction of all coffee samples and ascorbic acid.
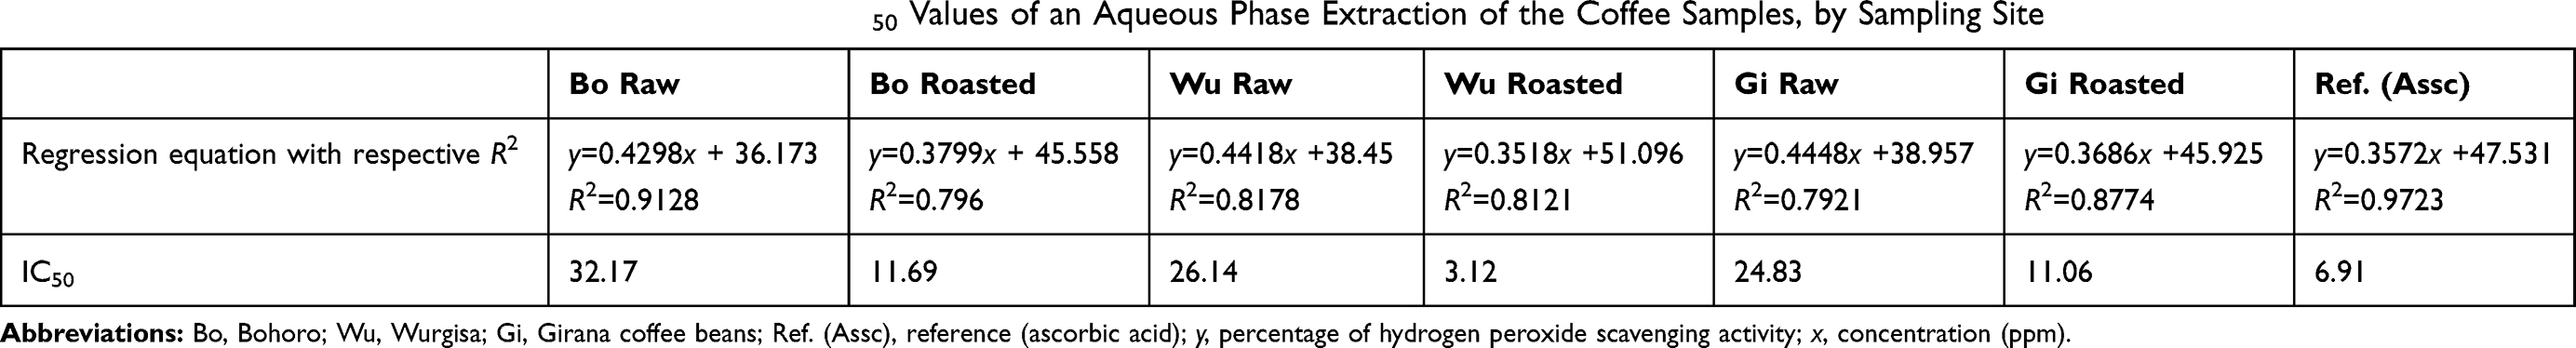 |
Table 4 Calibration Equations, Pearson Correlations, and IC50 Values of an Aqueous Phase Extraction of the Coffee Samples, by Sampling Site |
Comparison of Hydrogen Peroxide Scavenging Activity of Coffee Sample with Ascorbic Acid
As shown in Table 3 and Figure 8, the percentage inhibition of aqueous extraction of both roasted and raw coffee beans increased with an increase in the concentration of extracts and a standard compound. When we compared the scavenging potential of the aqueous extract of both raw and roasted coffee beans with ascorbic acid at 20 ppm, significant differences were found between the mean of ascorbic acid and Bohoro raw (t4=15.39, p≤0.001), Bohoro roasted (t4=10.65, p≤0.001), Wurgisa raw (t4=16.15, p≤0.001), Wurgisa roasted (t4=4.93, p=0.008), Girana raw (t4=15.84, p≤0.001), and Girana roasted beans (t3=9.99, p=0.002) at α=0.05.
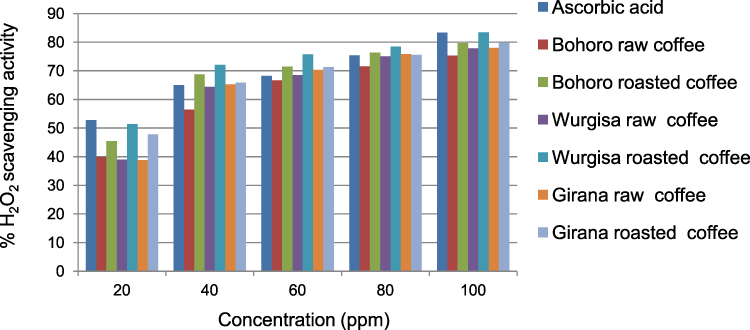 |
Figure 8 Comparison of the hydrogen peroxide scavenging activity of the coffee sample and ascorbic acid. |
At 40 ppm, a comparison of the means of ascorbic acid and the aqueous extracts of coffee samples in Bohoro roasted (t4=−8.89.61, p≤0.001) and Wurgisa roasted beans (t4=−14.05, p≤0.001) showed significant differences, whereas Bohoro raw (t4=−0.61, p=0.57), Wurgisa raw (t3=0.159, p=0.319), Girana raw (t3=−0.31, p=0.775), and Girana roasted beans (t3=−1.611, p=0.182) did not show significant differences at α=0.05.
At 60 ppm, the means of ascorbic acid and the aqueous extract of Bohoro roasted (t3=−8.58, p=0.003), Wurgisa roasted (t4=−22.39, p≤0.001), Girana raw (t3=−5.6, p=0.011), and Girana roasted beans (t3=−4.97, p=0.015) showed significant differences at α=0.05. But the means of ascorbic acid and aqueous extract of Bohoro raw coffee (t4=2.20, p=0.09) and Wurgisa raw coffee (t3=−0.62, p=0.57) were not significantly different at α=0.05.
At 80 ppm, the means of ascorbic acid and the coffee extracts from Bohoro raw (t3=3.73, p=0.03), Wurgisa roasted (t4=−8.55, p≤0.001); and at 100 ppm Bohoro raw (t2=11.32, p=0.01), Bohoro roasted (t3=11.02, p=0.002), Wurgisa raw (t4=19.508, p≤0.001), Girana raw (t4=17.51, p≤0.001), and Girana roasted beans (t4=13.68, p≤0.001) showed significant differences at α=0.05. However, at 60 ppm the means of ascorbic acid and coffee bean extracts of Bohoro roasted (t4=−2.77, p=0.085), Wurgisa raw (t4=0.958, p=0.39), Girana raw (t4=−1.159, p=0.31), and Girana roasted (t4=−0.2315, p=0.828), and at 100 ppm Wurgisa roasted (t3=−0.114, p=0.916) coffees did not show significant differences at α=0.05.
Discussion
The maximum wavelength of dichloromethane reported in previous studies4,27 was 277 nm and 274.7 nm, while in water it occurred at 270 nm and 272 nm, respectively; values which are not very different from the results obtained in the current study. Other authors also found that the maximum wavelength of caffeine in water was 274 nm.28 The differences in the maximum wavelength can be caused by the different conditions used for the analyses. Because the maximum wavelength of caffeine is in the range of 200–400 nm, caffeine can be analyzed using an ultraviolet detector.
In this study, the caffeine content in roasted coffee beans extracted by dichloromethane in all sampling sites, namely, Bohoro, Wurgisa, and Girana, had higher values than by aqueous extraction. Furthermore, the caffeine content in raw coffee beans extracted by dichloromethane, in Bohoro and Girana, but not Wurgisa raw coffee beans, had higher values than by aqueous extraction. This is a result of caffeine having higher solubility and optical transitions in dichloromethane than in distilled water.29
The difference in caffeine levels in the raw coffee beans is mainly due to the difference in their geological location and varieties of species. However, the amount of caffeine in roasted coffee was smaller than in raw coffee from all sampling sites. This reduction in the amount of caffeine in roasted coffee is due to a loss of organic matter resulting from the high solubility of caffeine in the extraction solvents.35,36
There was a positive correlation between the two solvents in roasted coffee beans from Bohoro and a negative correlation in Wurgisa roasted, Girana roasted, and Bohoro raw coffee beans in the study area. Regarding the price of coffee beans in the market of Woldia town, Bohoro’s coffee beans are more expensive than other coffees. This is due to the preference of the consumer for high-quality coffee beans with a high caffeine content, while those with less demand in the market have a lower caffeine content. The variation in caffeine concentrations depends principally on the genus or variety of coffee, soil type, rainfall, the geographical origin (agroecology), and the method used to extract caffeine from the coffee beans.4,30
Compared to coffee grown in other areas of Ethiopia, the caffeine contents of the coffee samples obtained from the study areas of Habru woreda almost lie within the range of caffeine contents extracted by dichloromethane in Hararghe coffee (0.601–0.903%).4 The caffeine content in this study is higher than that extracted by dichloromethane in coffee samples from Abe Dongoro (3.42 ppm), Sasiga (2.638 ppm), Gida Ayana (2.207 ppm), and Sibu Sire (2.986) of Wolega zone,1 whereas it is lower than the caffeine content of Wembera (1.53±0.003%), Goncha (1.41±0.040%), Zegie (1.29±0.033%), and Burie coffee (0.97±0.049%).31
Coffee beans are an important source of dietary antioxidants as a result of the accumulation of polyphenols such as chlorogenic acids, caffeine, mangiferin, trigonelline, and sucrose. They are used traditionally in many coffee-growing regions for the mitigation of several illnesses, including cardiovascular, gastrointestinal, and dermatological disorders, cancer, diabetes, and obesity. Therefore, their utilization as a health beverage should not be ignored.34 The results of the current study suggest that the amounts of caffeine in all of the coffee bean samples are safe and demonstrate bioavailable antioxidant activity.
Conclusion
UV-Vis spectrophotometry was successfully applied for the determination of the caffeine content of raw and roasted coffee beans extracted by dichloromethane and distilled water from Habru woreda, Ethiopia. In our study, the maximum wavelengths in aqueous and dichloromethane solvents were obtained as 271 nm and 274 nm, respectively. The smallest and highest amounts of caffeine in both raw and roasted coffee beans with aqueous extraction were found in beans from Girana (176.95±0.46 and 125.51±1.50 ppm) and Bohoro (190.82±0.45 and 160.05±0.38 ppm), respectively. In dichloromethane extraction, the smallest and highest amounts of caffeine of raw coffee beans were found in beans from Wurgisa (145.94±0.79 ppm) and Bohoro (198.00±2.09 ppm), and those in roasted coffee beans were found in beans from Bohoro (184.08±3.05 ppm) and Girana (177.11±3.59 ppm). Coffee beans are an important source of dietary antioxidants as a result of polyphenol accumulation. The aqueous phase coffee bean extracts also showed hydrogen peroxide scavenging activity, with IC50 values in Bohoro raw, Bohoro roasted, Wurgisa raw, Wurgisa roasted, Girana raw, and Girana roasted coffee samples of 32.17, 11.69, 26.14, 3.12, 24.83, and 11.06 ppm, respectively, while that of ascorbic acid was 6.91 ppm. In most of the samples, a significant variation in the concentration of caffeine in raw and roasted coffee bean samples was observed in the two extraction solvents, at α=0.05%.
Acknowledgment
The authors thank the Chemistry Department of Woldia University for allowing us to use the laboratory facility and all chemistry laboratory technicians involved in this work for their endless support.
Funding
The authors received no financial support for this research work.
Disclosure
The authors declared no conflicts of interest for this work.
References
1. Eticha S, Bedassa T. Determination of caffeine in coffee samples by high performance liquid chromatography and ultra violet-visible spectrophotometry methods from Wollega, Ethiopia.
2. Gemechu FG. Embracing nutritional qualities, biological activities and technological properties of coffee byproducts in functional food formulation. Trends Food Sci Technol. 2020.
3. Asfaw G, Tefera M. Total polyphenol content of green, roasted and cooked Harar and Yirgacheffee Coffee, Ethiopia. J Appl Sci Environ Manage. 2020;24(1):187–192. doi:10.4314/jasem.v24i1.27
4. Demissie EG, Woyessa GW, Abebe A. UV/Vis spectrometer determination of caffeine in green coffee beans from Hararghe, Ethiopia, using beer-lambert’s law and integrated absorption coefficient techniques. Scientific Study & Research. Chem Chem Eng Biotechnol Food Ind. 2016;17(2):109.
5. Caracostea L-M, Sîrbu R, Buşuricu F. Determination of caffeine content in Arabica and Robusta green coffee of indian origin. Eur J Med Nat Sci. 2020;4(3):16–24.
6. Kim J, Lee S, Shim J, et al. Caffeinated coffee, decaffeinated coffee, and the phenolic phytochemical chlorogenic acid up-regulate NQO1 expression and prevent H2O2-induced apoptosis in primary cortical neurons. Neurochem Int. 2012;60(5):466–474. doi:10.1016/j.neuint.2012.02.004
7. Khalid A, Ahmad S, et al. Determination of caffeine in soft and energy drinks available in market by using UV/Visible Spectrophotometer. Family Med Med Sci Res. 2016;5(4):1000206. doi:10.4172/2327-4972.1000206
8. Gafar P, Agustini S. Antioxidant activity of blended of robusta coffee (Coffea canephora L.) with The White Turmeric (Curcuma zedoaria (Berg.) Roscoe) and Wild Ginger (Curcuma xantorrhiza, Roxb.). MS&E. 2020;742(1):012018.
9. Liang N, Kitts DD. Antioxidant property of coffee components: assessment of methods that define mechanisms of action. Molecules. 2014;19(11):19180–19208. doi:10.3390/molecules191119180
10. Amos-Tautua W, Diepreye E. Ultra-violet spectrophotometric determination of caffeine in soft and energy drinks available in Yenagoa, Nigeria. Advan J Food Sci Technol. 2014;6(2):155–158. doi:10.19026/ajfst.6.2
11. Thaiphanit S, Wedprasert W, Srabua A. Conventional and microwave-assisted extraction for bioactive compounds from dried coffee cherry peel by-products and antioxidant activity of the aqueous extracts. SCIENCEASIA. 2020;46:12–18. doi:10.2306/scienceasia1513-1874.2020.S002
12. Wang D, Shi H. An unexpected reaction of isodehydracetic acid with amines in the presence of 1-Ethyl-3-(3-dimethylaminopropyl) carbodiimide hydrochloride yields a new type of β-Enaminones. Molecules. 2020;25(9):2131. doi:10.3390/molecules25092131
13. Girma B, Gure A, Wedajo F. Influence of Altitude on Caffeine, 5-caffeoylquinic acid, and nicotinic acid contents of arabica coffee varieties. J Chem. 2020;2020:1–7. doi:10.1155/2020/3904761
14. Hagos M, Redi-Abshiro M, S. Chandravanshi B, et al. Correlation between caffeine contents of green coffee beans and altitudes of the coffee plants grown in southwest Ethiopia. Bull Chem Soc Ethiop. 2018;32(1):13–25. doi:10.4314/bcse.v32i1.2
15. Zapata AMO, Arango FOD, Rojano BA. Sensorial Profile. content, and antioxidant activity in coffee beverages prepared by direct contact methods; 2020.
16. Alkaltham MS, Salamatullah A, Hayat K. Determination of coffee fruit antioxidants cultivated in Saudi Arabia under different drying conditions. J Food Measurement Characterization. 2020;1–8.
17. Rahmadi A, Istiqomah M, Emmawati A. Observation of bitterness reducing ability of melastomataceae leaf extracts on caffeine and coffee powder. 2019.
18. Talab S. Extraction and determination of caffeine concentrations in coffee, tea and chocolate milk available in saudi markets. Asian J Chem Sci. 2019;1–5. doi:10.9734/ajocs/2019/v6i118986
19. Dado AT, Asresahegn YA, Goroya KG. Comparative study of caffeine content in beans and leaves of Coffea arabica using UV/Vis spectrophotometer. Int J Phys Sci. 2019;14(14):171–176.
20. Wondimkun ZT, et al. The determination of caffeine level of wolaita zone, Ethiopia coffee using UV-visible spectrophotometer. Am J Appl Chem. 2016;4(2):59–63. doi:10.11648/j.ajac.20160402.14
21. Asfew Z, Dekebo A. Determination of caffeine content in Wollega Zones, Ethiopian coffee bean, pulp and leaves by high performance liquid chromatography. Trends Phytochem Res. 2019;3(4):261–274.
22. Castaldo L, Narváez A, Izzo L, et al. In vitro bioaccessibility and antioxidant activity of coffee silverskin polyphenolic extract and characterization of bioactive compounds using UHPLC-Q-Orbitrap HRMS. Molecules. 2020;25(9):2132. doi:10.3390/molecules25092132
23. Izzo L, Castaldo L, Narváez A, et al. Analysis of phenolic compounds in commercial Cannabis sativa L. inflorescences using UHPLC-Q-Orbitrap HRMS. Molecules. 2020;25(3):631. doi:10.3390/molecules25030631
24. Perkampus -H-H. UV-VIS Spectroscopy and Its Applications. Springer Science & Business Media; 2013.
25. Abreu MB, Marcheafave GG, Bruns RE, et al. Spectroscopic and chromatographic fingerprints for discrimination of specialty and traditional coffees by integrated chemometric methods. Food Analytical Methods. 2020;13(12):2204–2212. doi:10.1007/s12161-020-01832-1
26. Manjusha V, Merugu M. Spectrophotometric estimation of antioxidant activity of siegesbeckia orientalis plant extracts by hydrogen peroxide scavenging method. 2017.
27. Belay A, Ture K, Redi M, et al. Measurement of caffeine in coffee beans with UV/vis spectrometer. Food Chem. 2008;108(1):310–315. doi:10.1016/j.foodchem.2007.10.024
28. Saputri FA, Muchtaridi M. Analytical method development and validation for the determination of caffeine in green coffee beans (Coffea arabica l.) from three districts of west java, indonesia by high performance liquid chromatography. Int J App Pharm. 2018;10(6):107–111. doi:10.22159/ijap.2018v10i6.28551
29. Atomssa T, Gholap A. Characterization of caffeine and determination of caffeine in tea leaves using uv-visible spectrometer. Afr J Pure Appli Chem. 2011;5(1):1–8.
30. Shiferaw M, Adane L, Alemayehu I. Determination of caffeine content of Bale coffee using HPLC analysis. Food Sci Qual Manage. 2018;73:23–32.
31. Gebeyehu BT, Bikila SL. Determination of caffeine content and antioxidant activity of coffee. Am J Appl Chem. 2015;3(2):69–76. doi:10.11648/j.ajac.20150302.16
32. Mansouri A, Makris DP, Kefalas P. Determination of hydrogen peroxide scavenging activity of cinnamic and benzoic acids employing a highly sensitive peroxyoxalate chemiluminescence-based assay: structure–activity relationships. J Pharm Biomed Anal. 2005;39(1–2):22–26. doi:10.1016/j.jpba.2005.03.044
33. Dehariya R, Chandrakar J, Dubey S. et al. Scavenging and metal chelating potential of Carthamus tinctorius L. extracts. Current Botany;2020. 43–50. doi:10.25081/cb.2020.v11.6009
34. Figueroa Campos GA, Sagu ST, Saravia Celis P, et al. Comparison of batch and continuous wet-processing of coffee: changes in the main compounds in beans, by-products and wastewater. Foods. 2020;9(8):1135. doi:10.3390/foods9081135
35. Bolka M, Emire S. Effects of coffee roasting technologies on cup quality and bioactive compounds of specialty coffee beans. Food sci nutri. 2020;8(11):6120–6130. doi:10.1002/fsn3.1904
36. Saloko S, et al. The effects of temperature and roasting time on the quality of ground Robusta coffee (Coffea rabusta) using Gene Café roaster. in
 © 2021 The Author(s). This work is published and licensed by Dove Medical Press Limited. The
full terms of this license are available at https://www.dovepress.com/terms
and incorporate the Creative Commons Attribution
- Non Commercial (unported, 3.0) License.
By accessing the work you hereby accept the Terms. Non-commercial uses of the work are permitted
without any further permission from Dove Medical Press Limited, provided the work is properly
attributed. For permission for commercial use of this work, please see paragraphs 4.2 and 5 of our Terms.
© 2021 The Author(s). This work is published and licensed by Dove Medical Press Limited. The
full terms of this license are available at https://www.dovepress.com/terms
and incorporate the Creative Commons Attribution
- Non Commercial (unported, 3.0) License.
By accessing the work you hereby accept the Terms. Non-commercial uses of the work are permitted
without any further permission from Dove Medical Press Limited, provided the work is properly
attributed. For permission for commercial use of this work, please see paragraphs 4.2 and 5 of our Terms.