Back to Journals » OncoTargets and Therapy » Volume 13
Desmoglein 3 and Keratin 14 for Distinguishing Between Lung Adenocarcinoma and Lung Squamous Cell Carcinoma
Authors Dong Y ![]() , Li S, Sun X, Wang Y
, Li S, Sun X, Wang Y ![]() , Lu T, Wo Y
, Lu T, Wo Y ![]() , Leng X, Kong D, Jiao W
, Leng X, Kong D, Jiao W ![]()
Received 10 July 2020
Accepted for publication 8 September 2020
Published 29 October 2020 Volume 2020:13 Pages 11111—11124
DOI https://doi.org/10.2147/OTT.S270398
Checked for plagiarism Yes
Review by Single anonymous peer review
Peer reviewer comments 2
Editor who approved publication: Dr Federico Perche
Yanting Dong, Shicheng Li, Xiao Sun, Yuanyong Wang, Tong Lu, Yang Wo, Xiaoliang Leng, Dezhi Kong, Wenjie Jiao
Department of Thoracic Surgery, Affiliated Hospital of Qingdao University, Qingdao 266003, People’s Republic of China
Correspondence: Wenjie Jiao
Department of Thoracic Surgery, Affiliated Hospital of Qingdao University, No. 16 Jiangsu Road, Shinan District, Qingdao 266003, People’s Republic of China
Tel +8618661806899
Email [email protected]
Background: Lung adenocarcinoma (LUAD) and lung squamous cell carcinoma (LUSC) are the leading major histological phenotypes of all non-small cell lung cancer (NSCLC). In this study, the candidate genes and the potential tumorigenesis distinguishing between LUAD and LUSC were analyzed.
Methods: The present study investigated two microarray datasets (GSE28571 and GSE10245) downloaded from the Gene Expression Omnibus (GEO) database. A protein–protein interaction (PPI) network was applied to screen out the candidate genes. In addition, differently expressed genes (DEGs) between lung adenocarcinoma and lung squamous cell carcinoma of the two datasets were functionally analyzed by Gene Ontology (GO) and the Kyoto Encyclopedia of Genes and Genomes (KEGG) pathway enrichment. R 4.0.2 was used to perform Kaplan–Meier analysis of DSG3 (desmoglein 3) and KRT14 (keratin 14) by analyzing the expression and clinical data from The Cancer Genome Atlas (TCGA) database.
Results: The results revealed that 47 DEGs of the two datasets were ascertained in our study. It was found that the DEGs were mainly involved in pathways related to p63 transcription factor network and validated transcriptional factor targeting TAp63, etc. Based on the analysis, we finally identified DSG3 and KRT14 as potential biomarkers for distinguishing between LUAD and LUSC. These results suggested that DSG3 and KRT14 could have the potential to play an important role in NSCLC patients, as diagnostic markers. At the same time, DSG3 or KRT14 indicated a worse prognosis in LUSC patients, which were associated with pathways relevant to the TRAIL signaling pathway and TNF receptor signaling pathway according to bioinformatic analysis.
Conclusion: The DSG3 and KRT14 have the potential to be used as diagnostic markers, which presented here may facilitate improvements in distinguishing between LUAD and LUSC in advanced NSCLC patients.
Keywords: lung adenocarcinoma, lung squamous cell carcinoma, biomarker, distinguishing
Introduction
In recent decades, lung cancer has been one of the major research subjects due to the most dominant morbidity (11.6% of the entire cases) and the leading element of cancer death (18.4% of the entire cancer death) worldwide, accounting for more than one million deaths every year.1,2 Lung cancer is fundamentally classified into small-cell lung cancer (SCLC) and non-small-cell lung cancer (NSCLC).3 Lung adenocarcinoma (LUAD) and lung squamous cell carcinoma (LUSC) are two major histopathological subtypes of NSCLC.3
With the Human Genome Project done, scientific research has fortunately entered a brand-new post-genome period. Moreover, with the development of biological research of NSCLC and the advancement in high throughput biotechnologies, there have been several studies in the literature reporting the link between a great deal of novel biomarkers and the tumorigenesis of NSCLC.4 By analyzing the gene expression data, tens of thousands of gene features can be masterly obtained from a mere dozen tissue samples. In the course of the last decades, gene microarray and bioinformatic analysis were currently one of the most general methods in cancer research.5–8 Thus, it is commonly acknowledged that different biological informative methods may result in various outcomes in microarray data.
Despite the remarkable development acquired in lung cancer treatment in the recent decades, precise diagnosis of the LUAD and LUSC cancer types is significant for lung cancer treatment. The identification of candidate genes, together with the molecular mechanism of tumorigenesis, has been the main goal among the researchers specializing in lung diseases. Fan et al 9,10 have studied the mRNAsi-related biomarkers as new potential treatment strategies for LUAD and LUSC by The Cancer Genome Atlas (TCGA) databases. Although biomarkers have been extensively used on the cancer research, there has been limited use on separating LUAD from LUSC.11,12 Applicable biomarkers will be useful in increasing the accuracy rate of diagnosis for these chronic malignant cancers and predicting the prognosis of lung cancer patients.
As a result, the objective of the present work paper is to investigate the abilities to extract effective informative genes and to remove irrelevant or superfluous genes, which plays an essential role for specific classification as early as possible. Ultimately, the present research is of great significance and the analysis of microarray data is practicable and extremely valuable. It is critical to identify tumor-associated genes to help provide novel therapeutic targets for specific treatment and validate the diverse molecular mechanism between the LUAD and the LUSC.
This present study was undertaken to manifest the NSCLC target subtype-associated genes by analyzing the microarray data and experiment results. In the first place, two gene microarray datasets, GSE10245 and GSE28571, were obtained from the Gene Expression Omnibus (GEO) database. And 97 differentially expressed genes (DEGs) between LUAD and LUSC were obtained in GSE10245, and 93 DEGs in GSE28571. At the same time, 47 DEGs was detected in overlapping of two datasets. In the second place, the selection of hub genes depended on the protein–protein interaction (PPI) network. In the third place, Gene Ontology (GO) and the Kyoto Encyclopedia of Genes and Genomes (KEGG) pathway enrichment analysis with the Database for Annotation, Visualization and Integrated Discovery (DAVID) were performed to analyze their potential functions. Taken together, these results indicated a role for DSG3 (desmoglein 3) and KRT14 (keratin 14) as latent biomarkers in distinguishing between LUAD and LUSC. There was also a major difference in expression level of DSG3 and KRT14 between LUAD and LUSC tissues. The findings of this study may be of superior merit for identifying target genes and may provide latent biomarkers for distinguishing between LUAD and LUSC. All the results obtained will be beneficial to further lung cancer relevant genes verification, the different molecular mechanism of LUAD and LUSC and the potential prognosis and intervention of lung cancer.
Materials and Methods
Gene Expression Profile of LUAD and LUSC
The two gene expression profiles, GSE10245 and GSE28571, were obtained from the National Center for Biotechnology Information (NCBI) Gene Expression Omnibus database (GEO, http://www.ncbi.nlm.nih.gov/geo/), which were submitted by Ruprecht Kuner and Anders Isaksson, respectively. GSE10245 included 40 LUAD tissue samples and 18 LUSC tissue samples, based on the GPL570 platform. Meanwhile, GSE28571 included 50 LUAD tissue samples and 28 LUSC tissue samples, based on the GPL570 platform. The data were standardized (Figure 1). The expression data as well as the clinical data of DSG3 and KRT14 in NSCLC samples were downloaded from The Cancer Genome Atlas (TCGA, https://tcga-data.nci.nih.gov/tcga/) database.
 |
Figure 1 Tissue samples in GSE10245 and GSE28571. GSE10245 included 40 LUAD tissue samples and 18 LUSC tissue samples, based on the GPL570 platform (A). Meanwhile, GSE28571 included 50 LUAD tissue samples and 28 LUSC tissue samples, based on the GPL570 platform (B). Group A (green) is LUAD tissue samples, group B (purple) is LUSC tissue samples. |
DEG Identification
The two initial microarray datasets were classified into two groups, LUAD and LUSC, respectively. Robust Multichip Averaging was performed to normalize the microarray data.13 The LUAD and LUSC samples were compared by the limma package, a linear regression model.14 Furthermore, the P-value was accessed by the Benjamini-Hochberg method. A P-value of 0.05 and log fold change (FC) of 2 were set as the cut-off criterion.
GO Enrichment and Biological Pathway Enrichment Analysis
Gene Ontology (GO) project (The Gene Ontology Consortium, 2008; http://www.geneontology.org/) was provided for noting genes, gene sequences, and products,15 and GO is used to classify gene function and location.16 GO enrichment analysis consists of cellular composition (CC), molecular function (MF), and biological process (BP). To verify the difference between LUAD and LUSC at the molecular level, we give priority to the biological process, molecular function, as well as pathways. The KEGG was performed to analyze the pathway of DEGs (KEGG, http://www.genome.jp/kegg/).17 Pathway enrichment analysis and GO enrichment analysis were conducted with DAVID (DAVID; https://david.ncifcrf.gov/). A P-value less than 0.05 and a count number larger than 2 were considered as cut-off criteria.
Protein–Protein Interaction (PPI) Network
To evaluate the interacting relationship among target genes, we analyzed the target genes to the STRING database (http://string-db.org), and an interaction with a larger combined score >0.4 was considered as significant. Cytoscape software (version 3.7.1) is an open source bioinformatic software platform to examine the degree of connectivity in networks, obtaining the essential nodes in the PPI networks.18
Patients and Samples
During January 2018 and December 2018, all enrolled 80 pairs of NSCLC samples were gathered from the Thoracic Surgery, the Affiliated Hospital of Qingdao University. No patient received adjuvant therapy before surgery, like chemoradiotherapy, targeted therapy, or immunotherapy. The pathologists in the Affiliated Hospital of Qingdao University were responsible for the pathological diagnosis. Finally, a total of 40 pairs of LUSC and 40 pairs of LUAD tissues were collected and stored at −80°C after saturating the RNAwait (Solarbio Science & Technology Co., Ltd, Beijing, China). All patients involved had signed informed consent.
Total RNA Extraction and Quantitative Real-Time PCR
Using TRIzol reagent (Thermo Fisher Scientific, Inc., Waltham, MA, USA), total RNA was extracted from lung tissues according to the manufacturer’s instructions. After detecting RNA quality by using the NanoDrop 2000 spectrophotometer (Thermo Fisher Scientific, Inc.), the samples with an A260/A280 ratio of 1.8–2.1 were selected. In the same day, total RNA was reversely transcribed to cDNA (Takara Biotechnology Co., Ltd., Dalian, China). RNA expression was quantified by Quantitative-polymerase chain reaction (qPCR) using an Applied Biosystems 7500 Real-Time PCR system (Applied Biosystems; Thermo Fisher Scientific, Inc.) and TB Green® Premix Ex Taq™ II (Tli RNase H Plus) (Takara Biotechnology Co., Ltd.). The primers are shown in Table 1. GAPDH was used as an internal control for target genes. Relative expression levels of DSG3 and KRT14 between LUSC and LUAD tissues were analyzed using the 2−ΔΔCt method.19 The experiments were repeated three times.
 |
Table 1 The Primer Sequence of Related Genes |
Statistical Analysis
SPSS 24.0 software (IBM Corp., Armonk, NY, USA) and GraphPad Prism 8 (GraphPad, USA) software were conducted for statistical analysis. Student’s t-test was conducted to analyze the differences in gene expression. R 4.0.2 was utilized to perform the Kaplan–Meier analysis of DSG3 and KRT14 in LUAD or LUSC, respectively. FDR<0.05 was set as a default threshold to control the significance level. P<0.05 was regarded as a statistical difference.
Results
Identification of DEGs Between LUAD and LUSC
After standardization of the datasets (Figure 1), we identified 97 potential DEGs between LUAD and LUSC in GSE10245 datasets (Figure 2A), and 93 potential DEGs between LUAD and LUSC in GSE28571 datasets (Figure 2B). The overlapping of 47 DEGs of the two datasets is shown in the Venn diagram (Figure 2C).
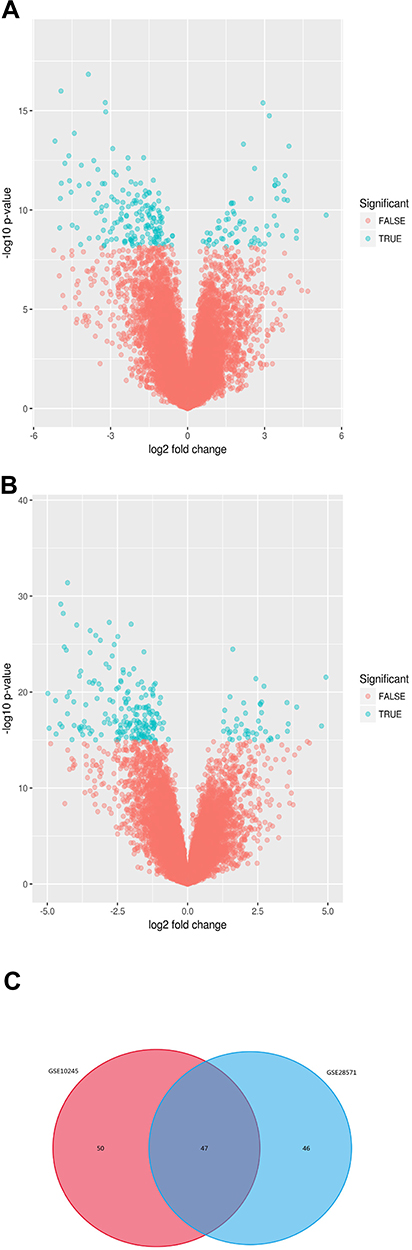 |
Figure 2 Identification of DEGs in LUAD and LUSC from GEO datasets (GSE10245, GSE25871). Ninety-seven potential DEGs between LUAD and LUSC in GSE10245 dataset (A) and 93 potential DEGs between LUAD and LUSC in GSE28571 dataset (B). P-value of 0.05 and log fold change (FC) of 2 were set as the cut-off criterion. Venn diagram showed 47 DEGs distinguishing LUAD and LUSC in both GEO datasets (C). |
Functional and Pathway Enrichment Analysis of DEGs Comparison in GSE10245 and GSE28571, Respectively
To compare the biological characteristics of DEGs in LUAD and LUSC in each GEO dataset, the DEGs were analyzed by GO functional enrichment analysis as well as KEGG pathway enrichment analysis using DAVID. GO analysis demonstrated that the difference in BP of DEGs was cell growth and/or maintenance in both GSE10245 and GSE28571 (Figure 3A, P<0.05). Meanwhile, differences in cellular compartments (CC) of DEGs were plasma membrane and exosomes in both GSE10245 and GSE28571 (Figure 3B, P<0.05). Furthermore, differences in molecular functions (MF) of DEGs were cell adhesion molecule activity and structural molecule activity in GSE10245, while those were transcription factor activity and cell adhesion molecule activity in GSE28571 (Figure 3C, P<0.05). The KEGG pathway analysis for DEGs between LUAD and LUSC included a p63 transcription factor network, validated transcriptional factor targets TAp63, validated transcriptional factor targets DeltaNp63 in GSE10245, while those were p63 transcription factor network, validated transcriptional factor targets TAp63, validated transcriptional factor targets DeltaNp63, and director p53 effectors in GSE28571 (Figure 4, P<0.05).
 |
Figure 3 Comparison of DEGs between LUAD and LUSC in GSE10245 and GSE28571, respectively, by GO analysis. Difference in biological processes (BP) of DEGs was cell growth and/or maintenance in both GSE10245 and GSE28571 (A). Differences in cellular compartments (CC) of DEGs were plasma membrane and exosomes in both GSE10245 and GSE28571 (B). Differences in molecular functions (MF) of DEGs were cell adhesion molecule activity and structural molecule activity in GSE10245, whereas transcription factor activity and cell adhesion molecule activity in GSE28571 (C). GSE10245 is on outer chart, GSE28571 is on inner chart (P<0.05 and a count number >2). |
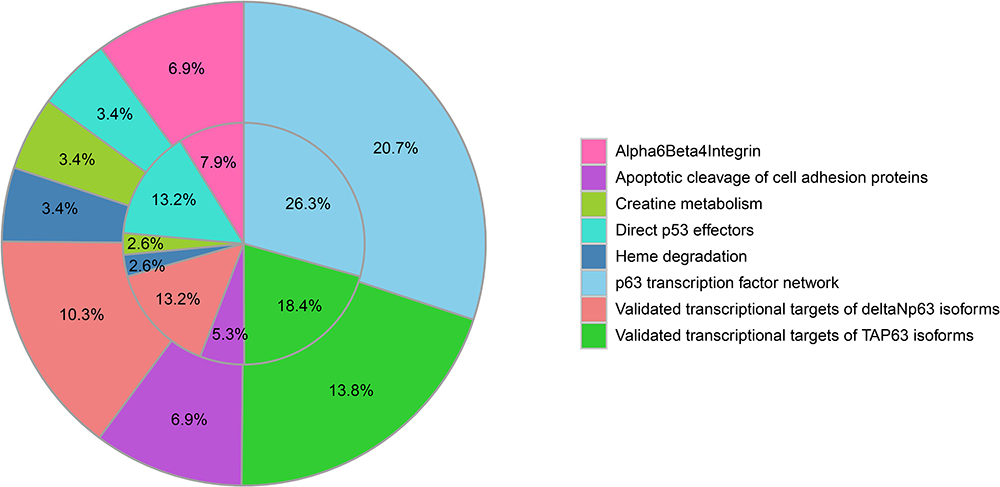 |
Figure 4 Functional enrichment analysis of DEGs in GSE10245 and GSE28571, respectively. The KEGG pathway analysis for DEGs between LUAD and LUSC included p63 transcription factor network, validated transcriptional factor targets TAp63, validated transcriptional factor targets DeltaNp63 in GSE10245, whereas p63 transcription factor network, validated transcriptional factor targets TAp63, validated transcriptional factor targets DeltaNp63 and director p53 effectors in GSE28571. GSE10245 is on outer chart, GSE28571 is on inner chart (P<0.05 and a count number >2). |
Functional and Pathway Enrichment Analysis of 47 DEGs in Both GSE10245 and GSE28571
Then we performed the GO analysis and KEGG analysis of the common 47 DEGs of the two datasets. The enriched GO functions for 47 DEGs included cell growth and/or maintenance in the BP category; plasma membrane and exosomes in CC category; cell adhesion molecule activity, structural molecule activity and auxiliary transport protein activity in MF category (Figure 5A–C, P<0.05). KEGG pathway analysis illustrated that the 47 DEGs were mainly enriched in p63 transcription factor network, validated transcriptional factor targeting TAp63, apoptotic cleavage of cell adhesion proteins, apoptotic cleavage of cellular proteins, apoptotic execution phase and alfa6beta4 integrin (Figure 6, P<0.05).
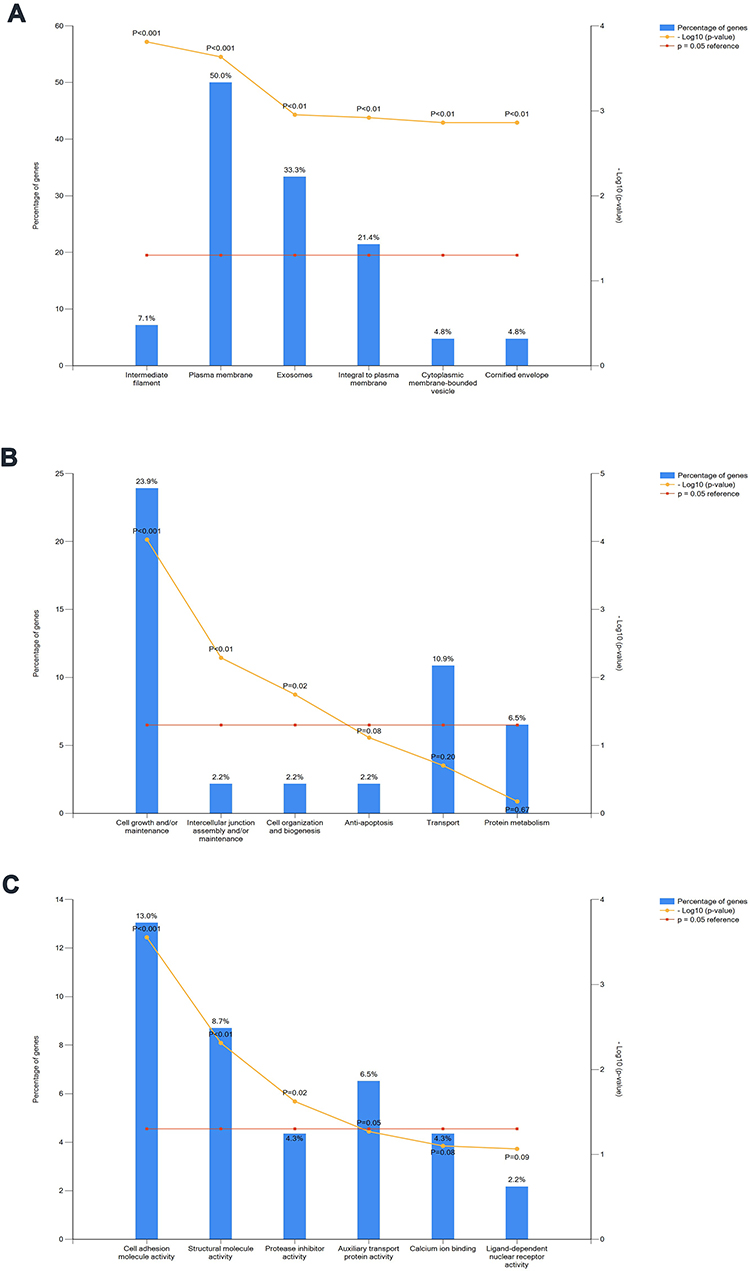 |
Figure 5 Functional analysis of 47 DEGs in both GSE10245 and GSE28571. Cell growth and/or maintenance in the biological processes (BP) category (A); plasma membrane and exosomes in cellular compartments (CC) category (B); and cell adhesion molecule activity, structural molecule activity and auxiliary transport protein activity in molecular functions (MF) category (C). |
 |
Figure 6 Pathway enrichment analysis of 47 DEGs in both GSE10245 and GSE28571. KEGG pathway analysis showed that the DEGs in both GSE10245 and GSE28571 were mainly enriched in p63 transcription factor network, validated transcriptional factor targeting TAp63, apoptotic cleavage of cell adhesion proteins, apoptotic cleavage of cellular proteins, apoptotic execution phase, and alfa6beta4 integrin. |
PPI Network Construction and Key Genes Selection
The PPI network was constructed using the STRING database, which revealed that most of the key genes interacted with each other. Furthermore, the top seven genes with high degrees were DSG3, KRT14, KRT5, NGF, COL17A, TF, and TJP1. Among these genes, DSG3 (desmoglein 3) and KRT14 (keratin 14) showed the highest node degree, indicating that they may play vital roles in identification of LUAD and LUSC (Figure 7A). Subsequently, the subset of the PPI network was performed by Molecular Complex Detection (MCODE), a cluster analyzed in this PPI network. A total of 22 genes were chosen as hub genes, involving DSG3, KRT14, BIRC2, BIRC3, XIAP, CYCS, APAF1, PARP1, KAT2B, CREB1, CREBBP, CITED2, EP300, FKBP10, TP53, CASP3, KRT3, KRT5, KRT6A, KRT6B, PKP1, and PKP3 (Figure 7B).
 |
Figure 7 PPI network construction based on the 47 DEGs and hub genes selection. The PPI network shows the top seven genes with high degrees including DSG3, KRT14, KRT5, NGF, COL17A, TF, and TJP1. DSG3 and KRT14 showed the highest node degree (A). A total of 22 genes were chosen as hub genes, involving DSG3, KRT14, BIRC2, BIRC3, XIAP, CYCS, APAF1, PARP1, KAT2B, CREB1, CREBBP, CITED2, EP300, FKBP10, TP53, CASP3, KRT3, KRT5, KRT6A, KRT6B, PKP1, and PKP3 (B). |
The Relative Expression Level of DSG3 and KRT14 in LUSC is More Than That in LUAD Tissues
What’s more, we analyzed the expression level of DSG3 and KRT14 between the adjacent tissues and NSCLC tissues. The results suggested that there was no significant difference between LUAD tissues and adjacent tissues (Figure 8A and B, P>0.05). However, there was a meaningful difference in LUSC tissues and adjacent tissues (Figure 8C and D, P<0.05). Additionally, there was a significant difference in expression of DSG3 and KRT14 in 40 LUAD samples and 40 LUSC tissues (Figure 8E and F, P<0.05), which was in accordance with the above theoretical observations.
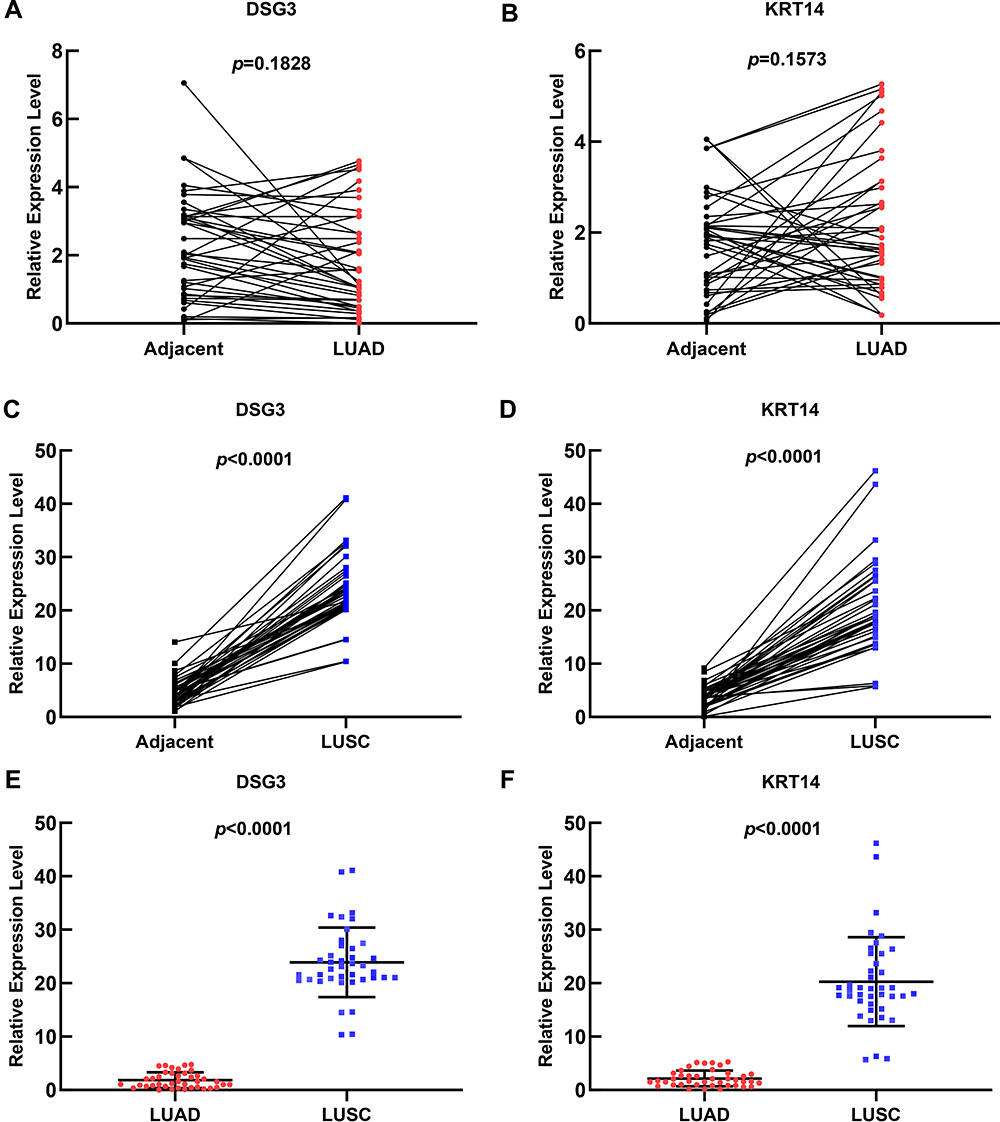 |
Figure 8 The expression of DSG3 and KRT14 in cancer tissues. There was no significant difference in expression of DSG3 (A) and KRT14 (B) in 40 LUAD tissues and adjacent tissues, respectively (P>0.05). There was a significant difference in expression of DSG3 (C) and KRT14 (D) in 40 LUSC tissues and adjacent tissues, respectively (P<0.05). There was a significant difference in expression of DSG3 (E) and KRT14 (F) in 40 LUAD samples and 40 LUSC samples (P<0.05). |
The Function of DSG3 and KRT14 to Predict the Prognosis of the NSCLC Patients Was Analyzed by TCGA Database
In view of the significant difference of expression level and the above results of DSG3 and KRT14 in NSCLC, we further analyzed the overall survival rate of patients and differential gene expression in the TCGA database. We downloaded the DSG3 and KRT14 expression level of 428 LUAD and 502 LUSC samples, as well as the clinical data of these patients. According to their expression level of the DSG3 and KRT14, the samples were divided into two groups equally, the high expression group and the low expression group. Any samples that were missing the expression level data or clinical information were excluded. Then we processed the data and performed Kaplan–Meier analysis by R 4.0.2. The results showed that the higher the expression level of DSG3 in LUSC samples was, the worse prognosis the patients had endured (Figure 9A, P<0.05). The result of KRT14 was consistent with that of DSG3 (Figure 9B, P<0.05). However, the difference of DSG3 or KRT14 between the adjacent tissues and LUAD tissues was meaningless (Supplementary Figure S1, P>0.05). In a word, the higher expression level of DSG3 or KRT14 indicated a worse prognosis in LUSC patients.
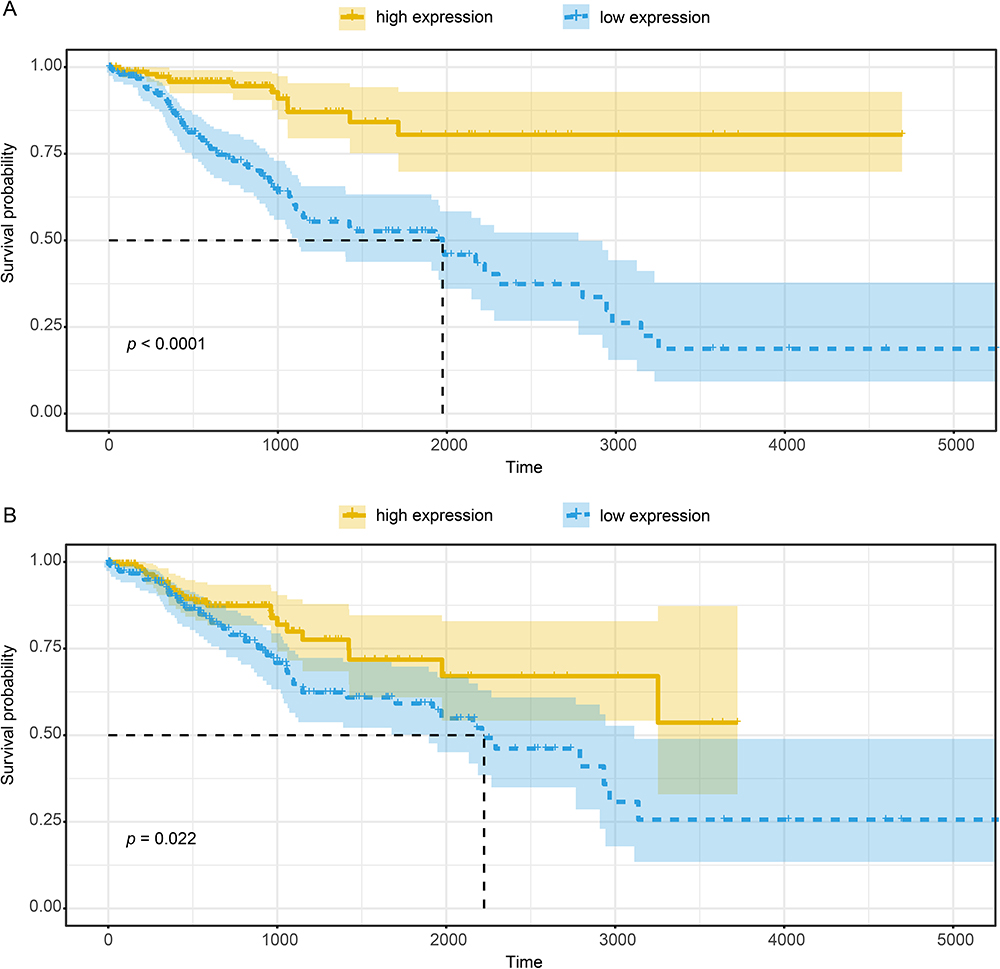 |
Figure 9 Kaplan–Meier analysis of DSG3 (A) and KRT14 (B) in LUSC samples in TCGA database. The high expression level of DSG3 and KRT14 was associated with worse prognosis in LUSC samples (P<0.05). |
Pathway Enrichment Analysis of the Hub Genes
The KEGG pathway analysis for the hub gene network between LUAD and LUSC included the TRAIL signaling pathway and TNF receptor signaling pathway (Figure 10, P<0.05).
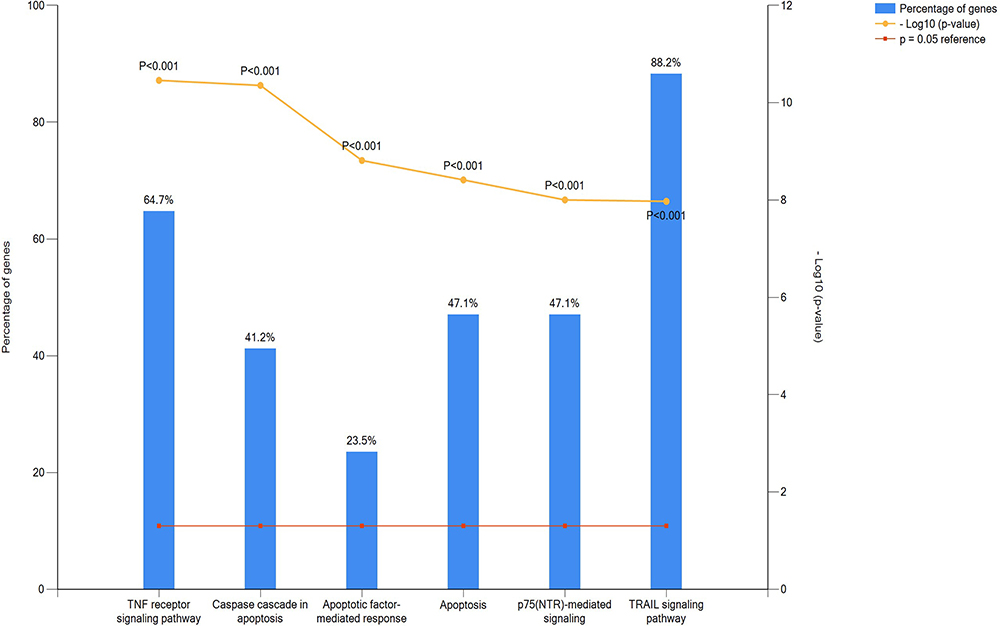 |
Figure 10 Pathway enrichment analysis of the hub genes. The KEGG pathway analysis for hub gene network of hub genes included TRAIL signaling pathway and TNF receptor signaling pathway. |
Discussion
As mentioned in the literature review, lung cancer is the most frequently diagnosed cancer (11.6% of the entire cases) and the leading cause of cancer death (18.4% of the entire cancer deaths) in 185 countries worldwide.1 According to histopathological features, the clinical treatment of LUAD and LUSC is commonly various.20 Nevertheless, there is still an urgent necessity to verify specific treatment of LUAD or LUSC. In the present study, we validated a list of DEGs between LUAD and LUSC at the molecular level through differential expression analysis in NCBI, and demonstrated that DSG3 and KRT14 were potential biomarkers for differentiating LUAD and LUSC.
The research revealed that a total of 97 DEGs were defined between LUAD and LUSC in GSE10245, and 93 DEGs in GSE28571. By means of GO enrichment analysis, we identified that the DEGs were significantly related to cell growth and/or maintenance in BP category in both datasets; plasma membrane and exosome in CC category in both datasets; cell adhesion molecule activity and structural molecule activity in MF category in GSE10245, and cell adhesion molecule activity and transcription factor activity in MF category in GSE28571. Meanwhile, 47 DEGs were founded in both GSE10245 and GSE28571. From the results of GO enrichment analysis of DEGs in BP, CC, and MF category, we identified differences between LUAD and LUSC, including cell growth and/or maintenance, as well as cell adhesion molecule activity and structural molecule activity in both datasets. In accordance with the present results, previous studies have demonstrated that transcription factors may contribute to differential expression of genes in cellular pathways of LUAD and LUSC by increasing cell growth, cell division, and gene transcription.21 However, the findings of the current study are not supported by the previous research. Other studies have concluded that LUAD and LUSC are distinguished by significant changes in DNA repair and metabolism, cell cycle regulation.22
To further study the different molecular mechanism of LUAD and LUSC, we performed KEGG pathway enrichment analysis. For the 97 DEGs in GSE10245 and 93 DEGs in GSE28571 as well as 47 common DEGs in both microarrays, p63 transcription factor network, validated transcriptional factor targeting TAp63 performed a major function in distinguishing between LUAD and LUSC. The findings were in accordance with previous studies. For example, in NSCLC, P63 could be applied as a prognostic marker for lung LUSC.23 Otherwise, almost 80% of NSCLC cases could be sub-typed by TTF-1 and p63.24
The research is essential for distinguishing between LUAD and LUSC. As shown in Figure 7, the PPI network indicated that DSG3 and KRT14 may be the potential biomarkers of identification of these two subtypes. These results suggested that DSG3 and KRT14 might have the potential to be used as diagnostic markers of NSCLC patients. The results were in line with previous studies. Research on a number of hub genes and signaling pathways of tumors have been the targets of cancer studies for over the past three decades. DSG3 might be a appropriate diagnostic marker to distinguish between LUAD and LUSC.25,26 Additionally, the research suggested that KRT14 may differentiate LUAD and LUSC by determining the origin of squamous cell carcinomas in human or mouse.20,21 In the meantime, we suggested that DSG3 and KRT14 were associated with the worse prognosis in LUSC patients, which also can be used as the prognosis indicator.
Additionally, the pathway analysis of DSG3 and KRT14 revealed that the major pathways included TRAIL signaling pathway and TNF receptor signaling pathway. TRAIL is a cytokine produced and secreted by quantities of normal tissue cells. It causes apoptosis initially in tumor tissue cells by binding to certain death receptors. TNF receptor is named after the basement that they seemed to play a significant role in apoptosis. The different expression of DEG3 and KRT14 may result in various outcomes in LUAD or LUSC by interfering the pathway of apoptosis.
Conclusion
This study aimed to determine the potential biomarkers distinguishing LUAD and LUSC. The results of this investigation show that 47 genes are differentially expressed in LUAD and LUSC in both GSE10245 and GSE28571, regulating cell growth and/or maintenance, as well as cell adhesion molecule activity and structural molecule activity. DSG3 and KRT14 are recognized as hub genes in distinguishing between LUAD and LUSC. These results suggest that DSG3 and KRT14 may offer the opportunity to be used as diagnostic markers of NSCLC patients, and prognostic markers of LUSC patients. Our study may be used as a potential clue in the clinical treatment of LUAD and LUSC. In the meantime, it is recommended that additional research can be conducted in carrying out target therapy.
Abbreviations
LUAD, lung adenocarcinoma; LUSC, lung squamous cell carcinoma; NSCLC, non-small cell lung cancer; GEO, Gene Expression Omnibus database; TCGA, The Cancer Genome Atlas; PPI, protein–protein interaction network; GO, Gene Ontology; KEGG, the Kyoto Encyclopedia of Genes and Genomes; DSG3, desmoglein 3; KRT14, keratin 14; DAVID, the Database for Annotation, Visualization and Integrated Discovery; NCBI, the National Center for Biotechnology Information; FC, fold change; BP, biological processes category; CC, cellular compartments category; MF, molecular functions; MCODE, Molecular Complex Detection.
Data Sharing Statement
All data generated or analyzed during this study are included in this published article.
Ethics Approval and Informed Consent
The Affiliated Hospital of Qingdao University has approved the study and the reference number is QYFYKY (2018-10-11-2).
Acknowledgments
We would like to thank The Department of Thoracic Surgery, Affiliated Hospital of Qingdao University for academic support.
Author Contributions
All authors made a significant contribution to the work reported, whether that is in the conception, study design, execution, acquisition of data, analysis and interpretation, or in all these areas; took part in drafting, revising or critically reviewing the article; gave final approval of the version to be published; have agreed on the journal to which the article has been submitted; and agree to be accountable for all aspects of the work.
Funding
This work was supported by Shandong Provincial Natural Science Foundation, China (CN), (No. zr2016hm58).
Disclosure
The authors declare that they have no competing interests.
References
1. Bray F, Ferlay J, Soerjomataram I, Siegel RL, Torre LA, Jemal A. Global cancer statistics 2018: GLOBOCAN estimates of incidence and mortality worldwide for 36 cancers in 185 countries. CA Cancer J Clin. 2018;68(6):394–424.
2. Siegel RL, Miller KD, Jemal A. Cancer statistics, 2020. CA Cancer J Clin. 2020;70(1):7–30.
3. Torre LA, Siegel RL, Jemal A. Lung cancer statistics. Adv Exp Med Biol. 2016;893:1-19.
4. Hu W, Bi ZY, Chen ZL, et al. Emerging landscape of circular RNAs in lung cancer. Cancer Lett. 2018;427:18–27.
5. Wang YW, Zhang W, Ma R. Bioinformatic identification of chemoresistance-associated microRNAs in breast cancer based on microarray data. Oncol Rep. 2018;39(3):1003–1010.
6. Piao J, Sun J, Yang Y, Jin T, Chen L, Lin Z. Target gene screening and evaluation of prognostic values in non-small cell lung cancers by bioinformatics analysis. Gene. 2018;20(647):306–311.
7. Wan L, Zhang L, Fan K, Wang JJ. Diagnostic significance of circulating long noncoding RNA PCAT6 in patients with non-small cell lung cancer. Onco Targets Ther. 2017;10:5695–5702.
8. Wu S, Wu F, Jiang Z. Identification of hub genes, key miRNAs and potential molecular mechanisms of colorectal cancer. Oncol Rep. 2017;38(4):2043–2050.
9. Liao Y, Xiao H, Cheng M, Fan X. Bioinformatics analysis reveals biomarkers with cancer stem cell characteristics in lung squamous cell carcinoma. Front Genet. 2020;11:427.
10. Liao Y, Wang Y, Cheng M, Huang C, Fan X. Weighted gene coexpression network analysis of features that control cancer stem cells reveals prognostic biomarkers in lung adenocarcinoma. Front Genet. 2020;11:311.
11. Li L, Li X, Yin J, et al. The high diagnostic accuracy of combined test of thyroid transcription factor 1 and Napsin A to distinguish between lung adenocarcinoma and squamous cell carcinoma: a meta-analysis. PLoS One. 2014;9(7):e100837.
12. Patnaik S, Mallick R, Kannisto E, et al. MiR-205 and MiR-375 microRNA assays to distinguish squamous cell carcinoma from adenocarcinoma in lung cancer biopsies. J Thorac Oncol. 2015;10(3):446–453.
13. Irizarry RA, Hobbs B, Collin F, et al. Exploration, normalization, and summaries of high density oligonucleotide array probe level data. Biostatistics (Oxford, England). 2003;4(2):249–264.
14. Smyth GK. Linear models and empirical bayes methods for assessing differential expression in microarray experiments. Stat Appl Genet Mol Biol. 2004;3(1):1–25.
15. Ashburner M, Ball CA, Blake JA, et al. Gene ontology: tool for the unification of biology. The gene ontology consortium. Nat Genet. 2000;25(1):25–29.
16. Scagliotti GV, Parikh P, von Pawel J, et al. Phase III study comparing cisplatin plus gemcitabine with cisplatin plus pemetrexed in chemotherapy-naive patients with advanced-stage non-small-cell lung cancer. J Clin Oncol. 2008;26(21):3543–3551.
17. Kanehisa M, Goto S. KEGG: kyoto encyclopedia of genes and genomes. Nucleic Acids Res. 2000;28(1):27–30.
18. Demchak B, Hull T, Reich M, et al. Cytoscape: the network visualization tool for GenomeSpace workflows. F1000Research. 2014;3:151.
19. Livak KJ, Schmittgen TD. Analysis of relative gene expression data using real-time quantitative PCR and the 2(-Delta Delta C(T)) Method. Methods (San Diego, Calif). 2001;25(4):402–408.
20. Bishop JA, Benjamin H, Cholakh H, Chajut A, Clark DP, Westra WH. Accurate classification of non-small cell lung carcinoma using a novel microRNA-based approach. Clin Cancer Res. 2010;16(2):610–619.
21. Liu S, Wang X, Qin W, Genchev GZ, Lu H. Transcription factors contribute to differential expression in cellular pathways in lung adenocarcinoma and lung squamous cell carcinoma. Interdiscip Sci. 2018;10(4):836–847.
22. Daraselia N, Wang Y, Budoff A, et al. Molecular signature and pathway analysis of human primary squamous and adenocarcinoma lung cancers. Am J Cancer Res. 2012;2(1):93–103.
23. Yu H, Li L, Liu D, Li WM. [Expression of TTF-1, NapsinA, P63, CK5/6 in Lung Cancer and Its Diagnostic Values for Histological Classification]. Sichuan Da Xue Xue Bao Yi Xue Ban = J Sichuan Univ Med Sci Ed. 2017;48(3):336–341. Chinese.
24. Sekar A, Gupta N, Rajwanshi A, Chaturvedi R, Singh N, Lal A. The role of the cytopathologist in subtyping and epidermal growth factor receptor testing in non-small cell lung cancer: an institutional experience. Cytopathology. 2017;28(5):371–377.
25. Vachani A, Nebozhyn M, Singhal S, et al. A 10-gene classifier for distinguishing head and neck squamous cell carcinoma and lung squamous cell carcinoma. Clin Cancer Res. 2007;13(10):2905–2915.
26. Zhan C, Yan L, Wang L, et al. Identification of immunohistochemical markers for distinguishing lung adenocarcinoma from squamous cell carcinoma. J Thorac Dis. 2015;7(8):1398–1405.
 © 2020 The Author(s). This work is published and licensed by Dove Medical Press Limited. The
full terms of this license are available at https://www.dovepress.com/terms
and incorporate the Creative Commons Attribution
- Non Commercial (unported, 3.0) License.
By accessing the work you hereby accept the Terms. Non-commercial uses of the work are permitted
without any further permission from Dove Medical Press Limited, provided the work is properly
attributed. For permission for commercial use of this work, please see paragraphs 4.2 and 5 of our Terms.
© 2020 The Author(s). This work is published and licensed by Dove Medical Press Limited. The
full terms of this license are available at https://www.dovepress.com/terms
and incorporate the Creative Commons Attribution
- Non Commercial (unported, 3.0) License.
By accessing the work you hereby accept the Terms. Non-commercial uses of the work are permitted
without any further permission from Dove Medical Press Limited, provided the work is properly
attributed. For permission for commercial use of this work, please see paragraphs 4.2 and 5 of our Terms.