Back to Journals » International Journal of Nanomedicine » Volume 12
Design, synthesis, and evaluation of VEGFR-targeted macromolecular MRI contrast agent based on biotin–avidin-specific binding
Authors Liu YJ, Wu XY, Sun XH, Wang D, Zhong Y, Jiang DD, Wang TQ, Yu DX, Zhang N
Received 7 January 2017
Accepted for publication 3 April 2017
Published 14 July 2017 Volume 2017:12 Pages 5039—5052
DOI https://doi.org/10.2147/IJN.S131878
Checked for plagiarism Yes
Review by Single anonymous peer review
Peer reviewer comments 3
Editor who approved publication: Dr Linlin Sun
Yongjun Liu,1 Xiaoyun Wu,1 Xiaohe Sun,1 Dan Wang,1 Ying Zhong,1 Dandan Jiang,1 Tianqi Wang,1 Dexin Yu,2 Na Zhang1
1School of Pharmaceutical Science, Shandong University, 2Department of Radiology Medicine, Qilu Hospital, Jinan, People’s Republic of China
Abstract: Developing magnetic resonance imaging (MRI) contrast agents with high relaxivity and specificity was essential to increase MRI diagnostic sensitivity and accuracy. In this study, the MRI contrast agent, vascular endothelial growth factor receptor (VEGFR)-targeted poly (l-lysine) (PLL)-diethylene triamine pentacetate acid (DTPA)-gadolinium (Gd) (VEGFR-targeted PLL-DTPA-Gd, VPDG), was designed and prepared to enhance the MRI diagnosis capacity of tumor. Biotin-PLL-DTPA-Gd was synthesized first, then, VEGFR antibody was linked to biotin-PLL-DTPA-Gd using biotin–avidin reaction. In vitro cytotoxicity study results showed that VPDG had low toxicity to MCF-7 cells and HepG2 cells at experimental concentrations. In cell uptake experiments, VPDG could significantly increase the internalization rates (61.75%±5.22%) in VEGFR-positive HepG2 cells compared to PLL-DTPA-Gd (PDG) (25.16%±4.71%, P<0.05). In MRI studies in vitro, significantly higher T1 relaxivity (14.184 mM-1 s-1) was observed compared to Magnevist® (4.9 mM-1 s-1; P<0.01). Furthermore, in vivo MRI study results showed that VPDG could significantly enhance the tumor signal intensity and prolong the diagnostic time (from <1 h to 2.5 h). These results indicated that macromolecular VPDG was a promising MRI contrast agent and held great potential for molecular diagnosis of tumor.
Keywords: MRI, contrast agent, VEGFR, biotin–avidin reaction, relaxivity
Introduction
Magnetic resonance imaging (MRI) is one of the most promising imaging modalities in clinical diagnosis of human disease. It offers several advantages such as high-resolution, non-invasiveness, high-anatomical contrast, and lack of ionizing radiation.1 To increase the differentiation between normal and diseased tissues, two classes of contrast agents, T1 agents (such as Magnevist® and ProHance®) and T2 agents (such as Feridex®), are often injected before or during the diagnosis. T2 agents act by shortening transverse relaxation time which results in signal decrease or signal void. The dark negative contrast provided by T2 agents could be confused with signals from bleeding, calcification, or metal deposits, which greatly restrict their clinical use.2 Compared to T2 agents, T1 agents provide bright images by shortening the longitudinal relaxation time and are widely used in clinical diagnosis, especially for cancer and cardiovascular disease.3
However, for cancer imaging, common clinical T1 contrast agents are small molecules with non-specific biodistribution and fast eliminative rate in vivo, which led to a short imaging time and undesirable contrast in tumor area.4,5 Therefore, recent studies have designed various carriers, such as liposomes,6 polymer conjugates,7 and Gd2O3 nanoparticles8,9 to overcome these drawbacks. Despite the large number and promising results of developed MRI contrast agents, the complicated preparation process still remained challenging.10,11 Furthermore, enduing contrast agents with active targeting properties is another concern for developing the next-generation contrast agents for increasing the sensitivity and accuracy of imaging in target tissues or cells.12 In this article, the novel T1 contrast agents, which have high gadolinium (Gd)-loading and active targeting functions with simple preparation process, were expected to be developed.
For MRI contrast agents, relaxivity is one of the main parameters to evaluate the imaging capability.13 Generally, larger relaxivity led to better contrast between tumor tissue and normal tissue.14,15 For Gd-based contrast agents, the relaxation theory predicts that higher relaxivity is obtained by increasing the exchange rate of protons between the Gd and water molecules or by increasing the molecular weight of agent.16,17 Thus, hydrophilic poly (L-lysine) (PLL), which contained many side-chain amino groups, was employed as the backbone material to conjugate with the imaging agent Gd-diethylene triamine pentacetate acid (DTPA). Since one PLL molecule could link with multiple Gd-DTPA molecules, high-Gd loading of PLL-DTPA-Gd (PDG) was achieved. Furthermore, the molecular weight of PDG was greatly increased and the hydrophilicity of PLL provided more chances for the exchange of water protons with Gd.1,18 Therefore, PDG was expected to considerably enhance the relaxivity.
For active delivery of PDG to tumor tissues, vascular endothelial growth factor receptor (VEGFR) antibodies were selected as the targeting agent. It has been demonstrated that VEGFR was overexpressed at different kinds of tumor areas caused by angiogenesis such as liver, breast, melanoma, and carcinoma cervicis cancers.19 More importantly, recent studies have indicated that VEGFRs were overexpressed not only on tumor neovasculature but also in cancer cells. This is of great important to achieve the “one-double targeting” strategy for target delivery and increase the accumulation of contrast agents in tumor area.20
To link the antibodies to PDG, biotin–avidin reaction was employed in this study. Avidin is a kind of tetrameric glycoprotein with molecular weight of 60 kD. Avidin contains four identical subunits, each of which can bind to biotin (vitamin B7 and vitamin H) with a high degree of affinity and specificity which can be set in any buffer, pH, and temperature. The dissociation constant of avidin is measured to be KD =10–15 M, making it one of the strongest known non-covalent bonds. On the basis of this reaction, three biotinylated PDG molecules and one biotinylated VEGFR antibody were expected to bind to four subunits of the same avidin molecule simultaneously to form the VEGFR-targeted PLL-DTPA-Gd (VPDG, shown in Scheme 1). Compared to traditional chemical reaction, the targeting modification by avidin–biotin reactions had higher specificity and simpler process.21,22 Furthermore, the relaxivity of VEGFR-targeted PLL-DTPA-Gd could be increased by the increased molecular weight after linking of avidin. In the present work, biotinylated PDG was first synthesized and characterized by 1H NMR and Fourier transform infrared spectroscopy (FT-IR). Then, the VPDG was prepared by the incubation of avidin with biotinylated VEGFR antibody and biotinylated PDG. The cytotoxicity and cell uptake of VPDG were evaluated. The relaxivity of VPDG was tested in vitro, and the diagnostic ability of VPDG was investigated in H22 tumor bearing mice. Finally, the hemolysis assay was carried out to preliminary evaluate the administration safety of VPDG.
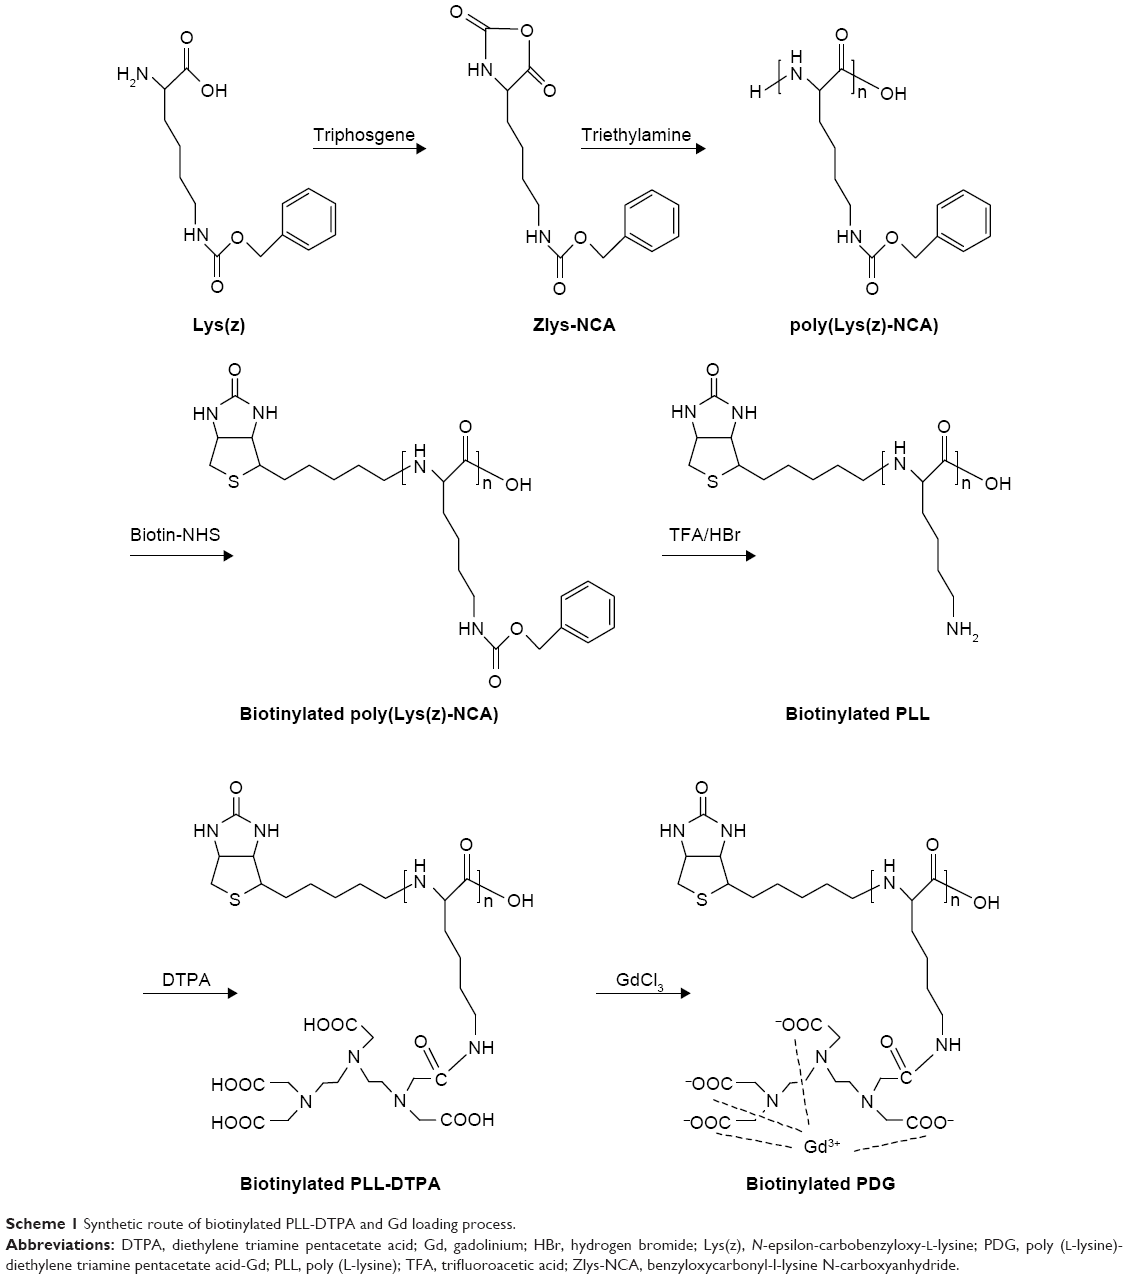 | Scheme 1 Synthetic route of biotinylated PLL-DTPA and Gd loading process. |
Materials and methods
Materials
Avidin (98%), biotin (99%), DTPA (99%), and gadolinium(III) oxide (Gd2O3, 99%) from Sigma-Aldrich (St Louis, MO, USA) were used as received. N-epsilon-carbobenzyloxy-L-lysine (Lys[z], 99%) from Aladdin (Shanghai, People’s Republic of China) was used as received. Hydrogen bromide (pure 33 wt%, solution in glacial acetic acid) was from Acros Organics (Geel, Belgium). Gadopentetic acid dimeglumine salt injection (Magnevist; Schering, Berlin, Germany) was from Qilu Hospital. Biotinylated VEGFR-2 antibody form was used after diluted with PBS (pH =7.4, 1:10 (V:V)). All other materials were obtained from Sigma-Aldrich and were used as received.
Cell lines
Human hepatocellular carcinoma cells (HepG2) and human breast cancer cells (MCF-7) were gifts from the Institute of Immunopharmacology and Immunotherapy, Shandong University (Jinan, People’s Republic of China). Mouse hepatocarcinoma cells (H22) were donated by the Institute of Pharmacochemistry, Shandong University. The use of these cell lines was approved by the review board of the Institute of Pharmacochemistry.
Synthesis and characterization of biotinylated PDG
Synthesis of poly(Lys(z)-NCA)
PLL was synthesized according to a previously described procedure.23 In a first step, Lys(z) was activated to benzyloxycarbonyl-l-lysine N-carboxyanhydride (Zlys-NCA). Briefly, triphosgene (0.5 g; 1.68 mmol) was added to 10 mL Lys(z) (1 g; 3.57 mmol) anhydrous tetrahydrofuran (THF) under vigorous stirring at 60°C in closed environment; 1 h after the solution became clear, Zlys-NCA was purified and collected by recrystallization and dried in vacuum (1.258 g; 92% yield). FT-IR (ATR, cm−1): 3342 (NH/OH), 3062 (phenyl group, C–H), and 1689 (carboxybenzyl, C=O).
In a second step, poly(Lys(z)-NCA) was synthesized. Briefly, triethylamine (TEA, 6.84 μL; 49 μmol) was added to 4 mL Zlys-NCA (600 mg; 1.96 mmol) anhydrous dimethylformamide (DMF) solution at room temperature and under nitrogen. After stirred for 72 h, the DMF solution was added dropwise to a large amount of diethyl ether with vigorous stirring in ice bath. The participation was collected and dried in vacuum to yield a white solid poly(Lys(z)-NCA) (410.6 mg; 68.43% yield). 1H NMR (300 MHz, dimethyl sulphoxide [DMSO]) δ (ppm): 7.31, 7.25 (d, 5H, –C5H5), 4.98, 4.94 (t, 2H, –CH2–), 4.21, 3.83 (d, 1H, –CH–), 2.95 (s, 2H, –CH2–), and 1.65, 1.37, 1.20 (c, 6H, –CH2CH2CH2–). FT-IR (ATR, cm−1): 3303 (NH/OH), 3064 (phenyl group, C–H), and 1654, 1537 (amide I, –CONH–).
Synthesis of biotinylated PLL
Poly(Lys(z)-NCA) (360 mg; 36 μmol) was reacted with biotin–N-hydroxysuccinimide (NHS) (12.4 mg; 36 μmol) in anhydrous DMF (5 mL) at room temperature and under nitrogen for 12 h. DMF was removed by adding excess cold diethyl ether to the reaction solution. The obtained solid was further dried in vacuum to yield a white solid (339.0 mg, 91.25% yield). 1H NMR (300 MHz, DMSO) δ (ppm): 7.31, 7.26 (d, 5H, –C5H5), 6.41, 6.39 (d, biotin, –CH–), 4.98, 4.94 (t, 2H, –CH2–), 4.21, 3.82 (d, 1H, –CH–), 2.94 (s, 2H, –CH2–), and 1.64, 1.61, 1.48, 1.24 (c, 6H, –CH2CH2CH2–). Then, PLL(Z)-biotin (300 mg) was dissolved in trifluoroacetic acid (TFA) in ice-bath. Hydrogen bromide (HBr, pure 33 wt%, solution in glacial acetic acid, 200 μL) was added into the PLL(Z)-biotin solution under stirring. After 2 h, TFA and excess HBr were removed by rotary evaporation, and the residue was added dropwise to cold diethyl ether with vigorous stirring. The precipitated white solid was collected and dried in vacuum to yield a white solid (114.8 mg, 72.99% yield). 1H NMR (300 MHz, DMSO) δ (ppm): 6.42 (s, biotin, –CH–), 4.25 (s, 1H, –CH–), 2.76 (s, 2H, –CH2–), and 1.54, 1.33 (c, 6H, –CH2CH2CH2–).
Synthesis of biotinylated PDG
1-Ethyl-3-(3-dimethylaminopropyl)carbodiimide (EDC) (572 mg; 3 mmol), NHS (344 mg; 3 mmol), and DTPA (589 mg; 1.5 mmol) were dissolved in TEMED buffer (pH =4.7). PLL-biotin (100 mg; LL monomer 0.7 mmol) was added and stirred for 3 days at room temperature under stirring to obtain biotinylated PLL-DTPA. Then, an excess of GdCl3 was added and stirred for 1 h. The reaction solution was dialyzed (molecular weight cutoff =1,000) against deionized water for 48 h to remove the excess DTPA, GdCl3, NHS, and EDC. The product biotinylated PDG obtained by freeze-drying (CHRIST ALPHA 1-4LD PLUS).
Preparation of VEGFR-targeted PLL-DTPA-Gd (VPDG)
The preparation process of VPDG is shown in Scheme 2. Briefly, avidin (10 mg, 0.14 μM) was dissolved in PBS buffer (pH =7.4). Biotinylated-VEGFR antibody (1.2 mg, 0.03 μM) was added dropwise under gentle stirring. After 20 min, biotinylated PDG (50 mg, 0.5 μM) was added and stirred for another 20 min to obtain VPDG. For cell uptake experiments, PDG and VPDG were labeled with fluorescein isothiocyanate (FITC) according to the previous method. Briefly, 5 mg PDG or VPDG was dissolved in PBS buffer (pH =7.4); 0.5 mg FITC (dissolved in 1 mL water) was added to the PDG or VPDG solution under magnetic stirring (600 rpm) at room temperature for 12 h. Then, the obtained suspension was dialyzed against deionized water to remove unreacted FITC for 48 h to form the FITC-labeled PDG or VPDG.
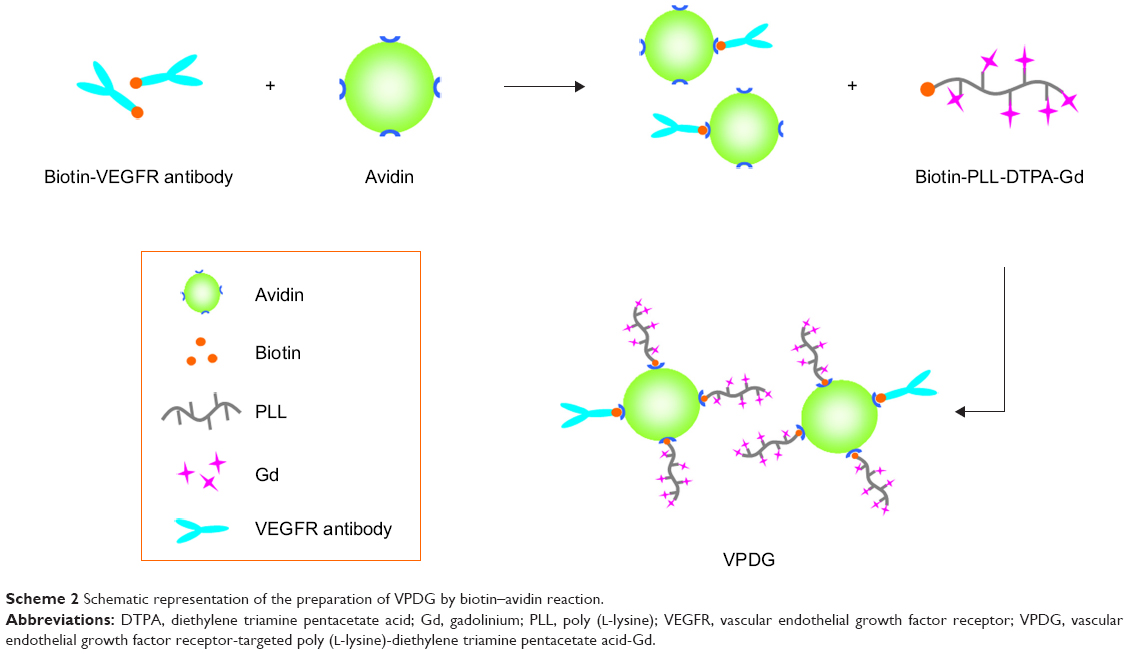 | Scheme 2 Schematic representation of the preparation of VPDG by biotin–avidin reaction. |
Cell culture
Human hepatocellular carcinoma cells (HepG2), human breast cancer cells (MCF-7), and mouse hepatocarcinoma cells (H22), overexpression of VEGFR, were cultured in Roswell Park Memorial Institute (RPMI) 1640 medium supplemented with 10% fetal bovine serum (FBS), streptomycin at 100 mg/mL, and penicillin at 100 U/mL. All cells were cultured in a 37°C incubator with 5% CO2.
Cytotoxicity study
MCF-7 cells and HepG2 cells were seeded, respectively, on 96-well plates at cell density of 1×10⁻⁴ cell/well. After incubation in a 5% CO2 incubator at 37°C for 24 h, the medium was replaced by VPDG at the concentration of 1, 8, and 40 μM, and the cells were cultured for another 24 h. The commercially available contrast agent, Magnevist, was taken as the control at the concentration of 40 μM. The cell viability was then assessed by MTT assay. Briefly, 20 μL 5 mg/mL of MTT in PBS was added to each well, and the plate was incubated for an additional 4 h at 37°C in a 5% CO2 incubator. Then, the MTT-containing medium was removed, and the crystals formed by living cells were dissolved in 100 μL DMSO. The absorbance at 450 nm was determined by a microplate reader (Model 680; Bio-Rad, Hercules, CA, USA). Untreated cells were taken as a control with 100% viability, and cells without addition of MTT were used as a blank to calibrate the spectrophotometer to zero absorbance. The relative cell viability (%) compared to control cells was calculated by (Asample/Acontrol) ×100%. All experiments were repeated in triplicate.
In vitro cell uptake
The in vitro cell uptake of VPGN was visualized and quantified by fluorescence microscope (BX40; Olympus, Tokyo, Japan) and flow cytometry (BD Biosciences, San Jose, CA, USA), respectively. HepG2 cells were seeded into 12-well plates at a density of 1×10⁴ cells/well and then incubated in a 5% CO2 humidified chamber. After 24 h, the culture media were removed, and the cells were treated with fresh serum-free media containing FITC-labeled PDG and FITC-labeled VPDG for 1 h at 37°C with 5% CO2 in an incubator, respectively. Then, the culture media were aspirated, cells were washed twice with cold PBS, and the fixed cells were examined under a fluorescence microscope. To quantify the cellular uptake rates, cells were treated as mentioned above. After incubation with test nanoparticles, cells were detached by 0.025% trypsin/EDTA, and cell suspensions were then transferred to microtubes. Then, cells were washed in cold PBS for three times and determined by flow cytometer.
MRI was also employed to test the in vitro cell uptake property of VPDG. Briefly, HepG2 cells were seeded into 12-well plates at a density of 1×10⁴ cells/well and then incubated in a 5% CO2 humidified chamber. After 24 h, the culture media were removed and the cells were treated with fresh serum-free media containing PDG and VPDG for 1 h at 37°C with 5% CO2 in an incubator, respectively. Then, the culture media were collected for MRI diagnosis.
In vitro MRI and relaxivity measurements
In vitro MRI test was performed at 3.0T on a Sigma scanner (GE, Milwaukee, WI, USA) according to the method published previously by our group.24 The T1-weighted MR images of VPDG and the Magnevist were obtained, respectively. MR images were taken at a series of Gd concentrations at 40, 20, 10, 5, and 1 μmol/L. For the measurement of T1 relaxivity, the samples were tested by using T1-weighted pulse sequences which held the time of echo (TE) constant at 15 ms while varying the time of repetition (TR) to TR-167, TR-300, TR-600, TR-900, TR-1500, and TR-2500 ms, respectively. The signal intensity of the samples was measured on each of the images, and the T1 relaxivity was calculated for each concentration of the different contrast agents, respectively. Quantitative T1 relaxation maps were reconstructed from data sets for six different relaxation times using function software at a workstation.
In vivo MRI
The in vivo MRI was tested according to the previous method.24 H22 tumor bearing mice were employed to evaluate the in vivo imaging ability of VPDG. The mice were subcutaneously injected with 0.05 mL of cell suspension containing 1×10⁶ H22 cells at the right axillary space. Administration of the contrast agents was started 10 days after the transplantation when the tumor volumes were ~1.5×1.5 cm (L×W) (L is the long diameter and W is the short diameter of a tumor). The contrast agents were injected at a dose of 40 μmol Gd/kg into the mice tail vein. The mice were scanned with a 3.0T Sigma scanner using a flex coil array, which comprised of two modified resonators. T1 scan was taken at 5 min, 10 min, 15 min, 30 min, 45 min, 1 h, 1.5 h, 2 h, 2.5 h, and 3 h after intravenous injection. Quantitative T1 MR images were obtained by saturation–recovery multislice spin-echo pulse sequence. Saturation–recovery T1 images of three or four slices (slice thickness of 2 mm) were acquired with six relaxation delays of 167 ms with an inplane spatal resolution of 0.250 mm (128×64 matrix zero filled to 128×128, field of view: 32 mm, number of scans: 8). Quantitative T1 relaxation maps were reconstructed from data sets for six different relaxation times using function software at a workstation (ADW 4.2). The T1 intensity of PDG, VPDG, and Magnevist in tumor area was measured to evaluate the MRI ability.
All experiments were carried out in compliance with the Animal Management Rules of the Ministry of Health of the People’s Republic of China (document 55, 2001) and Animal Experiment Ethics Review of Shandong University.
Hemolysis assay
Fresh rat blood (15 mL) was collected and stirred to remove the fibrous protein in the blood. Then, red blood cells (RBCs) were obtained after centrifugation and washed with PBS. The RBC suspension (2%, v/v) was mixed with VPDG at 37°C for 3 h according to Table 1. The deionized water was added as a positive control, and normal saline (NS) was added as the negative control. After incubation, the mixture was centrifuged at 3,000 rpm for 10 min to remove erythrocytes. The supernatant was collected after centrifugation and analyzed for released hemoglobin with UV/vis spectrophotometer at 576 nm as an indicative of lysis of RBCs. The hemolysis ratio (HR (%)) was calculated according to the following equation:
HR (%) = (Asample − Anegative)/(Apositive − Anegative) × 100% |
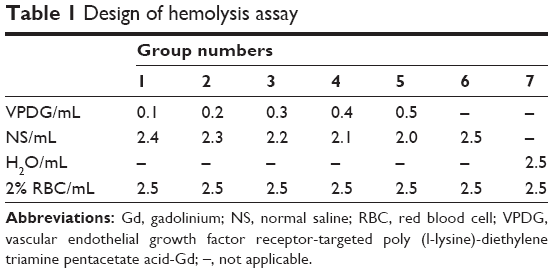 | Table 1 Design of hemolysis assay |
Asample, Anegative, and Apositive referred to the absorbance of the samples, negative control, and positive control, respectively.
Statistical analysis
Comparison between groups was analyzed by the one-tailed Student’s t-test using statistical software SPSS 11.5. All data are presented as mean ± SD. Differences were considered to be statistically significant when the P-values were <0.05.
Results and discussion
Synthesis and characterization of biotinylated PDG
Synthesis of poly(Lys(z)-NCA)
To better control the biotin modification site of PDG, the poly(Lys(z)-NCA) with one terminal amino group was first synthesized (Scheme 1). The polymerization of PLL from Zlys-NCA ensured the side chains of PLL were all protected by carboxybenzyl and leaving one free terminal amino group in each poly(Lys(z)-NCA). TEA was the initiator that started the polymerization reaction. The molar ratio of TEA and Zlys-NCA could control the degree of polymerization (DP). In this article, 1:40 (molar ratio, TEA:Zlys-NCA) was employed, and the DP was tested using ubbelohde viscometer.25 The DP of PLL after deprotection was calculated though Log DP =0.79 log ηsp +2.46, and the molecular weight is 36,208 (DP =248). The FT-IR spectra of Zlys-NCA and poly(Lys(z)-NCA) are shown in Figure 1. Compared to Zlys-NCA, the band at 1,654.28 cm−1 (amide I) and 1,537.78 cm−1 (amide II) in the FT-IR spectra of poly(Lys(z)-NCA) represented the appearance of amide bond which indicated the polymerization happened, and poly(Lys(z)-NCA) was successful synthesized.
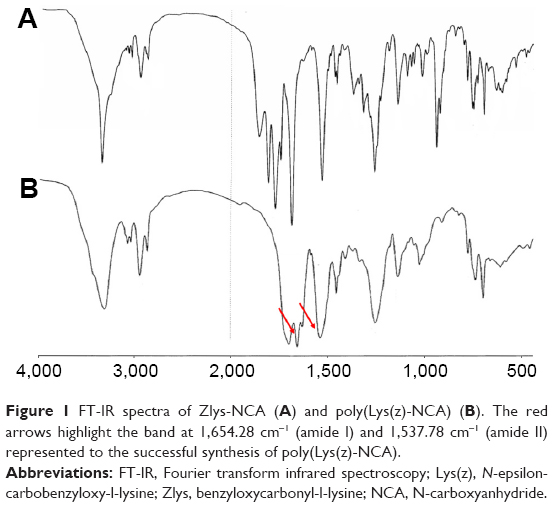 | Figure 1 FT-IR spectra of Zlys-NCA (A) and poly(Lys(z)-NCA) (B). The red arrows highlight the band at 1,654.28 cm−1 (amide I) and 1,537.78 cm−1 (amide II) represented to the successful synthesis of poly(Lys(z)-NCA). |
Synthesis of biotinylated PLL
Poly(Lys(z)-NCA) with one free terminal amino group provided active site for biotin modification. Carboxyl-activated biotin (biotin-NHS) was employed to increase the reaction rate and yield of the reaction. The pecks of biotin in 1H NMR spectra of biotinylated poly(Lys(z)-NCA) indicated its successful synthesis. The peck of biotin is small which might be caused by only one biotin that was linked to the large molecule poly(Lys(z)-NCA). After the linkage of biotin, the deprotection of amino groups of PLL was carried out to obtain biotinylated PLL. Many reagents were used in the deprotection reaction, we found that HBr acetic acid solution was more suitable for biotinylated poly(Lys(z)-NCA) to maintain the stability of amide bonds. TFA could further increase the deprotection rate of carboxybenzyl. As shown in Figure 2, the peck at 7.346 showed significant decrease, which indicated that carboxybenzyl was removed. The deprotection rate was 93% as calculated from 1H NMR spectra.
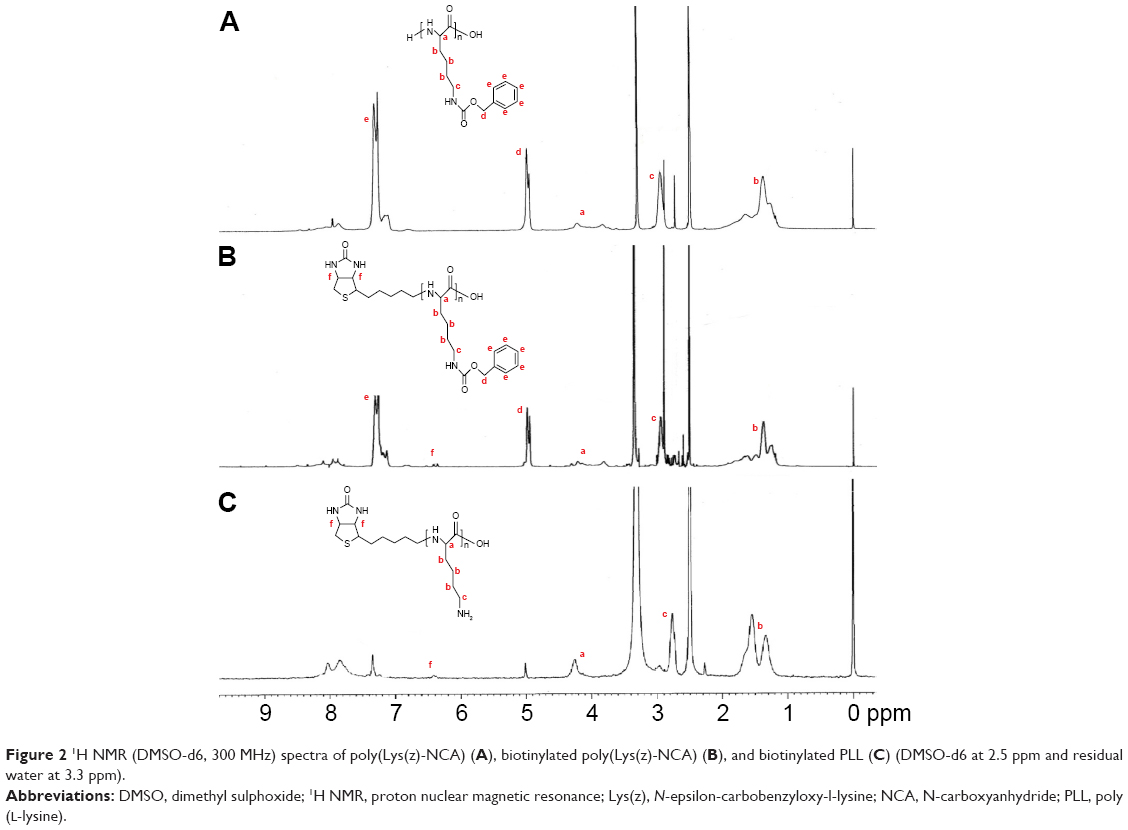 | Figure 2 1H NMR (DMSO-d6, 300 MHz) spectra of poly(Lys(z)-NCA) (A), biotinylated poly(Lys(z)-NCA) (B), and biotinylated PLL (C) (DMSO-d6 at 2.5 ppm and residual water at 3.3 ppm). |
Synthesis of biotinylated PDG
To load Gd to biotinylated PLL, DTPA were linked to biotinylated PLL by amide reaction. The excess of DTPA was added to ensure the complete reaction of the amino groups of biotinylated PLL and reduce the rate of one DTPA molecule linked to amino groups. After reaction, excess Gd ions were added and chelated by DTPA groups. After dialysis and freeze-drying, the Gd content of white powder were determined and the Gd loading was 9.69%.
Preparation of VEGFR-targeted PLL-DTPA-Gd (VPDG)
VPDG was prepared based on biotin–avidin reaction to achieve the targeting modification. Compared to traditional methods, such as by chemical covalent bonds, biotin–avidin reaction reacted in a gentler environment with high affinity and specificity. The IR spectra of biotinylated PDG and VPDG are shown in Figure S1. Compared to biotinylated PDG, the absorption peak at 2,042 cm−1 was appeared which was caused by the double bonds in the VEGFR antibodies, indicating the successful synthesis of VPDG. The obtained VPDG were clear water solutions and did not show a size distribution by dynamic light scattering, which might be caused by the good water-solubility of macromolecular VPDG. However, VPDG had a zeta potential of −10.3±2.7 mV. The negative potential might be beneficial to prolong the in vivo circulating time.
Cytotoxicity study
MRI contract agents should have low toxicity to human body. In this study, the in vitro cytotoxicity of VPDG at different Gd concentrations was evaluated by MTT assay in MCF-7 cells (Figure 3A) and HepG2 Cells (Figure 3B). The commercial preparation Magnevist at different concentrations was taken as the positive control. As shown in Figure 3, Magnevist, PDG, and VPDG showed low cytotoxicity to MCF-7 cells and HepG2 Cells. The cell survival rates of VPDG were all higher than 80% at the experimental Gd concentrations which indicated that VPDG was safe to both MCF-7 cells and HepG2 cells at the test concentrations. Compared to Magnevist group, the cell survival rate of different concentration of VPDG did not have significant deviation (P>0.05). VPDG was composed of polypeptides PLL and proteins, which could be biodegraded in vivo and resulted to the low cytotoxicity of VPDG.
 | Figure 3 Results of cytotoxicity of Magnevist®, PDG, and VPDG at different Gd concentrations in MCF-7 cells (A) and HepG2 cells (B). |
In vitro cell uptake and targeting property
Target delivery of imaging agents is essential to achieve the molecular imaging of cancer patients. Therefore, cell uptake experiments were employed to evaluate the targeting properties of VPDG. The cell uptake study was performed on VEGFR-positive HepG2 cells. The results of fluorescence microscopy images and flow cytometry test of FITC-labeled PDG and VPDG are shown in Figure 4A. FITC-labeled PDG and VPDG could be internalized by HepG2 cells, and the fluorescence intensity of FITC-labeled VPDG was significantly higher than FITC-labeled PDG. The internalization rates of FITC-labeled VPDG were 61.75%±5.22%, which is significantly higher than FITC-labeled PDG (25.16%±4.71%, P<0.05). The possible reason was that VEGFR was overexpressed on the membrane of HepG2 cells, the uptake of VPDG could be enhanced by the VEGFR-mediated internalization. The results of MR images of PDG and VPDG were showed in Figure 4B. The imaging intensity of VPDG was significantly lower than that of PDG (P<0.05), which demonstrated that the internalization of VPDG could be significantly increased after VEGFR antibody modification. These results indicated that when VPDG were delivered to the tumor tissue, the modification of VEGFR antibodies could increase the absorption of VPDG which resulted to the enhancement of the diagnostic sensitivity.23
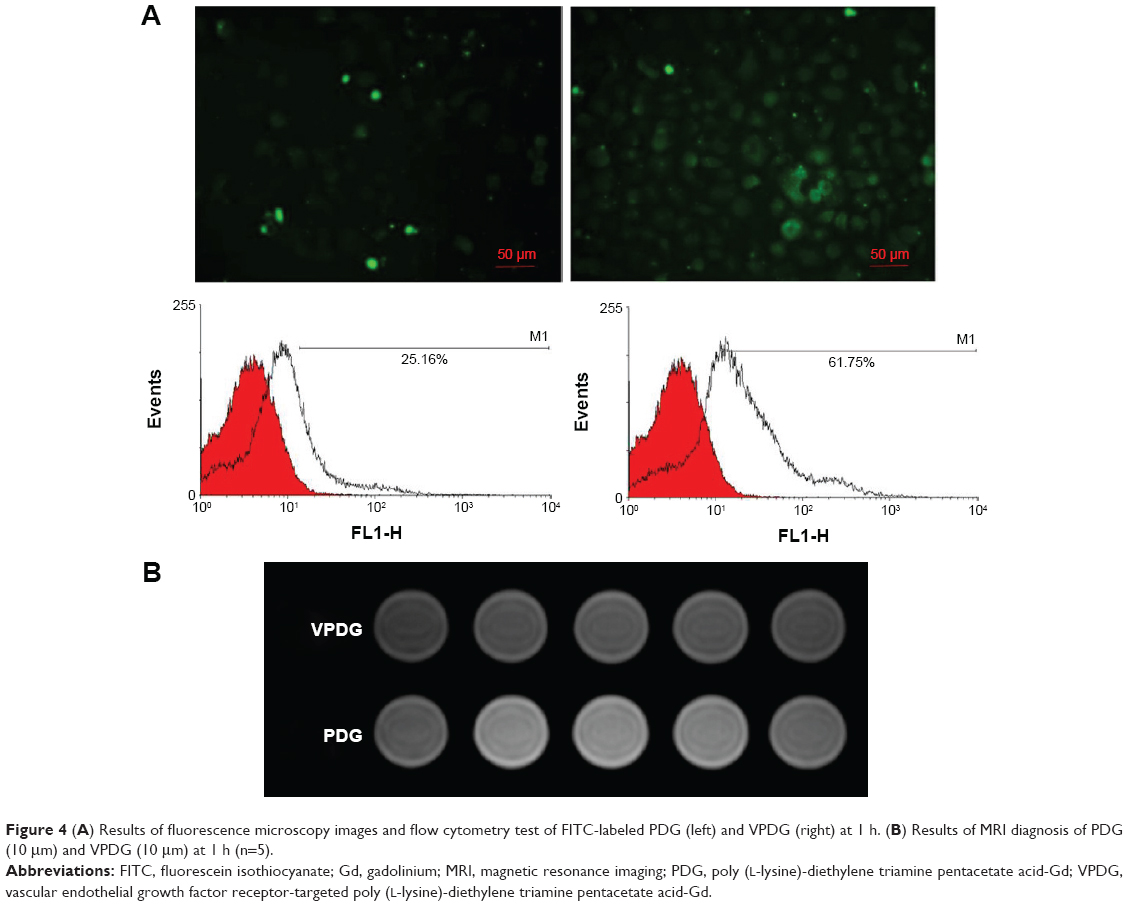 | Figure 4 (A) Results of fluorescence microscopy images and flow cytometry test of FITC-labeled PDG (left) and VPDG (right) at 1 h. (B) Results of MRI diagnosis of PDG (10 μm) and VPDG (10 μm) at 1 h (n=5). |
In vitro MRI and relaxivity measurements
For Gd-based contrast agents, T1 relaxivity is the main parameter to evaluate the imaging capability. In this study, VPDG with different Gd concentrations were evaluated at 3.0T on a clinical MR scanner to test its in vitro imaging capacity (GE). As shown in Figure 5A, the signal intensity of VPDG increased with the increase of the Gd concentration. The signal of VPDG (Gd concentration, 5 μM) was similar to Magnevist (Gd concentration, 40 μM). The relaxivity was calculated as the slope of the curves 1/T1 with respect to the gadolinium concentration.7,24 The r1 of PDG was 12.963 mM−1 s−1 (Figure 5B), which was about 1.7 times higher than Magnevist (about r1=4.9 mM−1 s−1). The r1 of VPDG was 14.184 mM−1 s−1 (Figure 5C), which was about 2.9 times higher than Magnevist (about r1=4.8 mM−1 s−1). These results are shown that PDG and VPDG could significantly increase the T1 relaxivity compared to Magnevist (P<0.05). In relaxation theory, the higher relaxivity is obtained by increasing the molecular weight of agent or increasing the exchange rate of protons between the Gd and water molecules. Gd ions were linked to the macromolecular MRI contrast agent VPDG, thus the molecular weight of PDG or VPDG were significantly higher than Magnevist. Meanwhile, Gd was distributed on the surface of PDG or VPDG, the proton exchange rate between Gd and water molecules was accordingly increased. Therefore, PDG and VPDG showed significant enhancement in T1 imaging compared to Magnevist. Because the molecular weight of VPDG was higher than PDG, the T1 relaxivity of VPDG was slightly higher than PDG.
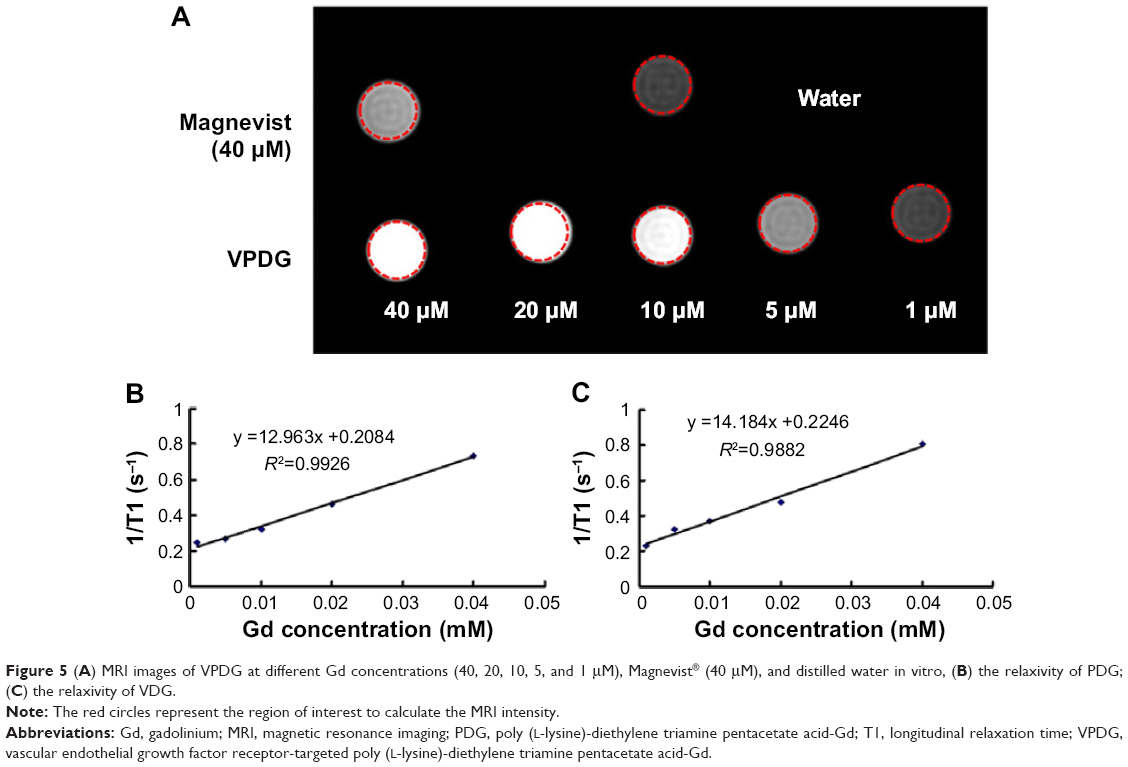 | Figure 5 (A) MRI images of VPDG at different Gd concentrations (40, 20, 10, 5, and 1 μM), Magnevist® (40 μM), and distilled water in vitro, (B) the relaxivity of PDG; (C) the relaxivity of VDG. |
In vivo MRI
To examine the potential of VPDG in MRI, subcutaneous H22 cell xenografts which overexpressed VEGFR were employed as the tumor model. The MRI maps of tumor-bearing mice after the injection of VPDG are shown in Figure 6A. The whole body of the mice was gray before injection. There is no signal intensity difference between tumor tissue and normal tissue (Figure 6A, 0 min). A ring-shaped lightness was found around tumor, and it may be caused by subcutaneous fats. After the injection of VPDG, the visual brighter images were observed at tumor tissue compared to the surrounding tissues, and the boundary of tumor tissue could be clearly demarcated (Figure 6A, 60 and 90 min). After 180 min, the signal intensity returned to normal and could not be used for diagnosis. As a control, the MRI maps of PDG after injection are shown in Figure S2. Compared to VPDG group, PDG showed a similar imaging behavior but a relatively shorter imaging time. The results of the enhanced signal of PDG, VPDG, and Magnevist in tumor tissue, and the main parameters of VPDG and Magnevist in MRI diagnosis are shown in Figure 6B and C. Compared to Magnevist group, PDG and VPDG showed longer imaging time and higher signal enhancement (P<0.01). Compared to PDG group, VPDG showed longer imaging time and higher signal enhancement (P<0.01). The possible reasons might be that 1) VPDG had higher relaxivity compared to Magnevist which resulted to the higher signal enhancement; 2) VPDG could accumulate to the tumor area by the enhanced permeability and retention (EPR) effect while Magnevist were small molecular agents that could not have tumor accumulation ability; and 3) VPDG could link to the tumor vascular cells and tumor cells (overexpressed VEGFR) by antibody–antigen reaction and led to the further accumulation and restriction of VPDG in the tumor area.26 As a result, the significant contrast enhancement and imaging time extension was observed in the HCC tumor area by VPDG compared to Magnevist.
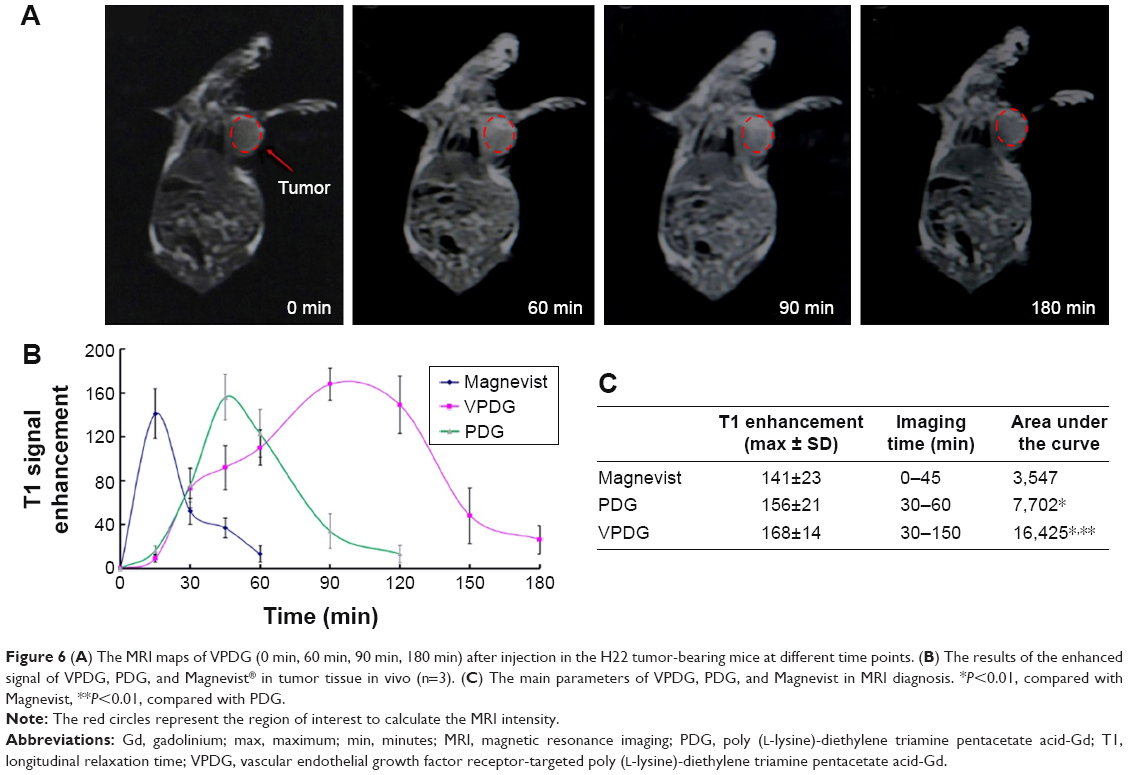 | Figure 6 (A) The MRI maps of VPDG (0 min, 60 min, 90 min, 180 min) after injection in the H22 tumor-bearing mice at different time points. (B) The results of the enhanced signal of VPDG, PDG, and Magnevist® in tumor tissue in vivo (n=3). (C) The main parameters of VPDG, PDG, and Magnevist in MRI diagnosis. *P<0.01, compared with Magnevist, **P<0.01, compared with PDG. |
Hemolysis assay
The hemolysis images of VPDG are shown in Figure 7, and the hemolytic activities of the VPDG at different concentrations were displayed in Table 2. As shown in Figure 7, no hemolysis and aggregation phenomenon was seen compared with the positive control from the figure, and the hemolysis ratio of the samples was very low (<3%) as shown in the Table 2. The highest concentration of VPDG in hemolysis assay in 10% that is higher than the concentration of VPDG administrated in vivo. Therefore, these results indicated that the VPDG had good hemocompatibility. Generally, hemolysis of <5% is regarded as non-toxic and safe.
 | Figure 7 The hemolysis image of VPDG (1–5: different concentrations of VPDG, 6: NS, 7: deionized water). |
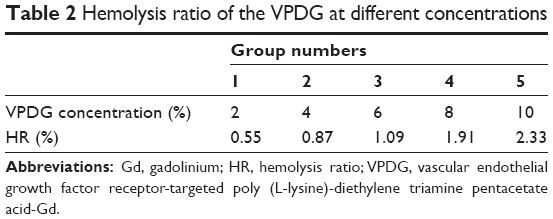 | Table 2 Hemolysis ratio of the VPDG at different concentrations |
Conclusions
In this study, VEGFR-targeted macromolecular MRI contrast agents were designed and prepared based on biotin–avidin reaction. The preparation procedure was simple with high affinity and specificity. VPDG exhibited high internalization rates in VEGFR-positive HepG2 cells compared to PDG (P<0.05). In vitro MRI studies showed that VPDG have high T1 relaxivity (14.184 mM−1 s−1). Furthermore, VPDG could significantly enhance the imaging contrast and prolong the diagnostic time in tumor-bearing mice compared to Magnevist. These results indicated that VPDG was a promising macromolecular contrast agent with high relaxivity and specificity for the diagnosis of tumor.
Acknowledgment
This work was supported by the Independent Innovation Foundation of Shandong University, IIFSDU (2015GN019).
Disclosure
The authors report no conflicts of interest in this work.
References
Estelrich J, Sanchez-Martin MJ, Busquets MA. Nanoparticles in magnetic resonance imaging: from simple to dual contrast agents. Int J Nanomedicine. 2015;10:1727–1741. | ||
Chan N, Laprise-Pelletier M, Chevallier P, Bianchi A, Fortin MA, Oh JK. Multidentate block-copolymer-stabilized ultrasmall superparamagnetic iron oxide nanoparticles with enhanced colloidal stability for magnetic resonance imaging. Biomacromolecules. 2014;15(6):2146–2156. | ||
Liu Y, Chen Z, Liu C, Yu D, Lu Z, Zhang N. Gadolinium-loaded polymeric nanoparticles modified with Anti-VEGF as multifunctional MRI contrast agents for the diagnosis of liver cancer. Biomaterials. 2011;32(22):5167–5176. | ||
Guglielmo FF, Mitchell DG, Gupta S. Gadolinium contrast agent selection and optimal use for body MR imaging. Radiol Clin North Am. 2014;52(4):637–656. | ||
Barrett T, Kobayashi H, Brechbiel M, Choyke PL. Macromolecular MRI contrast agents for imaging tumor angiogenesis. Eur J Radiol. 2006;60(3):353–366. | ||
Gu MJ, Li KF, Zhang LX, et al. In vitro study of novel gadolinium-loaded liposomes guided by GBI-10 aptamer for promising tumor targeting and tumor diagnosis by magnetic resonance imaging. Int J Nanomedicine. 2015;10:5187–5204. | ||
Yan GP, Li Z, Xu W, et al. Porphyrin-containing polyaspartamide gadolinium complexes as potential magnetic resonance imaging contrast agents. Int J Pharm. 2011;407(1–2):119–125. | ||
Hedlund A, Ahren M, Gustafsson H, et al. Gd(2)O(3) nanoparticles in hematopoietic cells for MRI contrast enhancement. Int J Nanomedicine. 2011;6:3233–3240. | ||
Tian X, Yang F, Yang C, et al. Toxicity evaluation of Gd2O3@SiO2 nanoparticles prepared by laser ablation in liquid as MRI contrast agents in vivo. Int J Nanomedicine. 2014;9:4043–4053. | ||
Bruckman MA, Yu X, Steinmetz NF. Engineering Gd-loaded nanoparticles to enhance MRI sensitivity via T(1) shortening. Nanotechnology. 2013;24(46):462001. | ||
Liu Y, Zhang N. Gadolinium loaded nanoparticles in theranostic magnetic resonance imaging. Biomaterials. 2012;33(21):5363–5375. | ||
Zhou Z, Wu X, Kresak A, Griswold M, Lu ZR. Peptide targeted tripod macrocyclic Gd(III) chelates for cancer molecular MRI. Biomaterials. 2013;34(31):7683–7693. | ||
Hussain T, Nguyen QT. Molecular imaging for cancer diagnosis and surgery. Adv Drug Deliv Rev. 2014;66:90–100. | ||
Gløgård C, Stensrud G, Hovland R, Fossheim SL, Klaveness J. Liposomes as carriers of amphiphilic gadolinium chelates: the effect of membrane composition on incorporation efficacy and in vitro relaxivity. Int J Pharm. 2002;233(1–2):131–140. | ||
Shokrollahi H. Contrast agents for MRI. Mater Sci Eng C Mater Biol Appl. 2013;33(8):4485–4497. | ||
Cheng W, Ping Y, Zhang Y, Chuang KH, Liu Y. Magnetic resonance imaging (MRI) contrast agents for tumor diagnosis. J Healthc Eng. 2013;4(1):23–45. | ||
Yan G-P, Robinson L, Hogg P. Magnetic resonance imaging contrast agents: overview and perspectives. Radiography. 2007;13(Suppl 1):e5–e19. | ||
Lima-Tenorio MK, Pineda EA, Ahmad NM, Fessi H, Elaissari A. Magnetic nanoparticles: in vivo cancer diagnosis and therapy. Int J Pharm. 2015;493(1–2):313–327. | ||
Zhao Y, Adjei AA. Targeting angiogenesis in cancer therapy: moving beyond vascular endothelial growth factor. Oncologist. 2015;20(6):660–673. | ||
Liu D, Liu F, Liu Z, Wang L, Zhang N. Tumor specific delivery and therapy by double-targeted nanostructured lipid carriers with anti-VEGFR-2 antibody. Mol Pharm. 2011;8(6):2291–2301. | ||
Wayment JR, Harris JM. Biotin-avidin binding kinetics measured by single-molecule imaging. Anal Chem. 2009;81(1):336–342. | ||
Dong C, Yang S, Shi J, et al. SPECT/NIRF dual modality imaging for detection of intraperitoneal colon tumor with an avidin/biotin pretargeting system. Sci Rep. 2016;6:18905. | ||
Liu Y, Liu C, Li M, et al. Polymer-polymer conjugation to fabricate multi-block polymer as novel drug carriers: poly(lactic acid)-poly(ethylene glycol)-poly(L-lysine) to enhance paclitaxel target delivery. J Biomed Nanotechnol. 2014;10(6):948–958. | ||
Liu Y, Feng L, Liu T, et al. Multifunctional pH-sensitive polymeric nanoparticles for theranostics evaluated experimentally in cancer. Nanoscale. 2014;6(6):3231–3242. | ||
Wang S, Cheng L, Yu F, Pan W, Zhang J. Delivery of different length poly(L-lysine)-conjugated ODN to HepG2 cells using N-stearyllactobionamide-modified liposomes and their enhanced cellular biological effects. Int J Pharm. 2006;311(1–2):82–88. | ||
Haisma HJ, Kamps GK, Bouma A, et al. Selective targeting of adenovirus to alphavbeta3 integrins, VEGFR2 and Tie2 endothelial receptors by angio-adenobodies. Int J Pharm. 2010;391(1–2):155–161. |
Supplementary materials
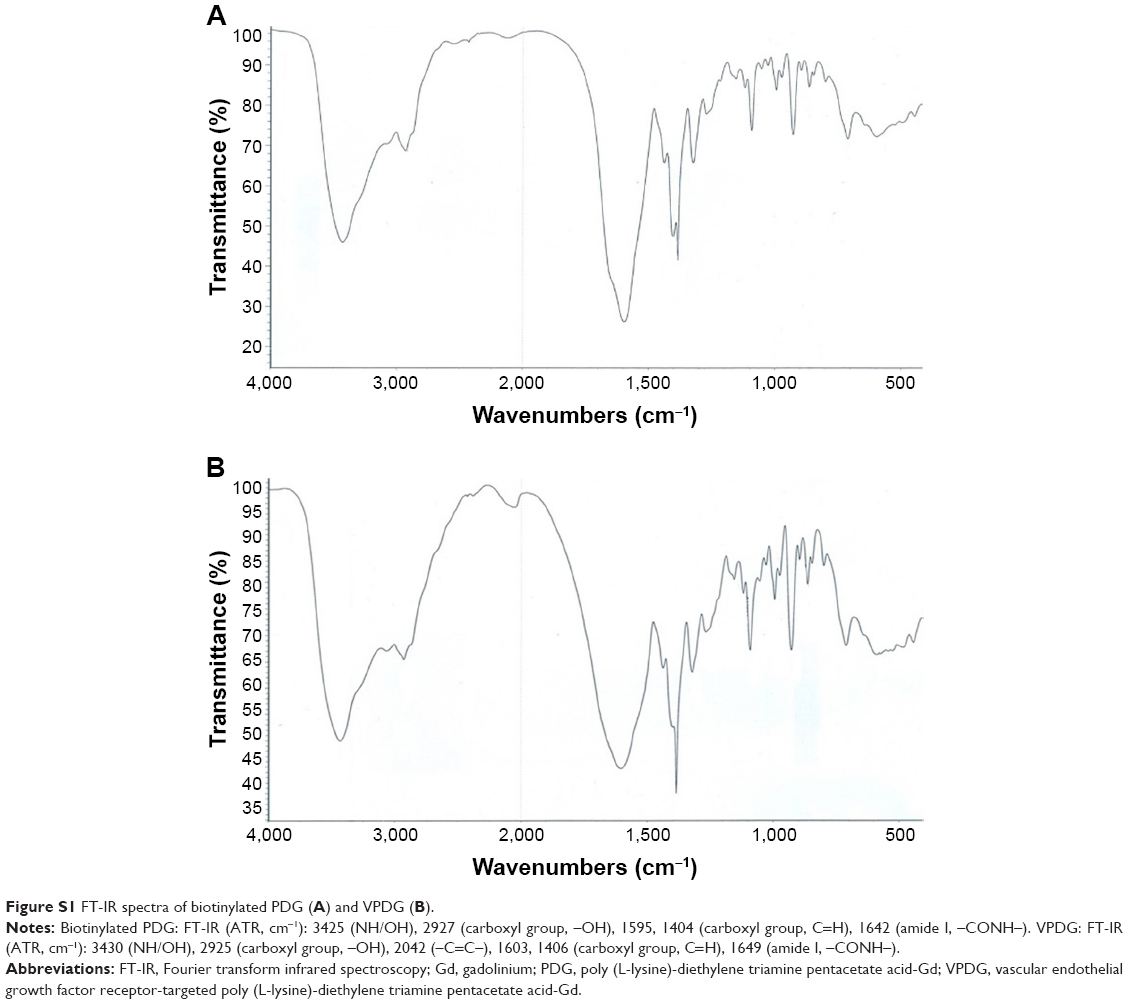 | Figure S1 FT-IR spectra of biotinylated PDG (A) and VPDG (B). |
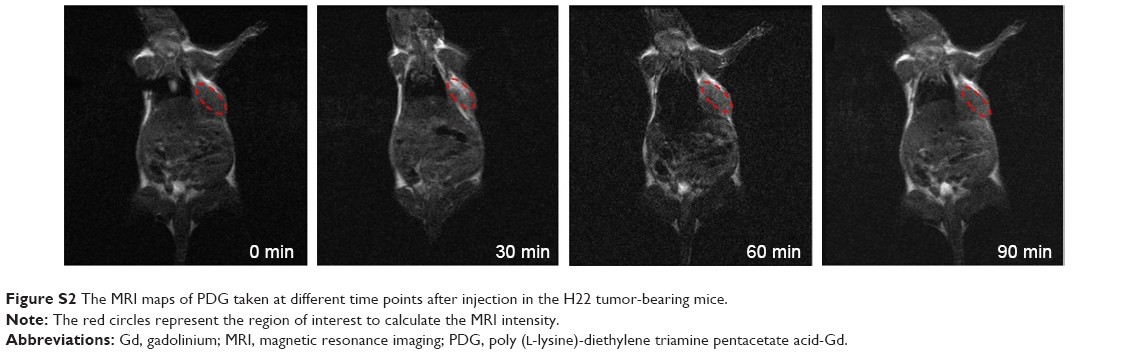 | Figure S2 The MRI maps of PDG taken at different time points after injection in the H22 tumor-bearing mice. |
 © 2017 The Author(s). This work is published and licensed by Dove Medical Press Limited. The
full terms of this license are available at https://www.dovepress.com/terms
and incorporate the Creative Commons Attribution
- Non Commercial (unported, 3.0) License.
By accessing the work you hereby accept the Terms. Non-commercial uses of the work are permitted
without any further permission from Dove Medical Press Limited, provided the work is properly
attributed. For permission for commercial use of this work, please see paragraphs 4.2 and 5 of our Terms.
© 2017 The Author(s). This work is published and licensed by Dove Medical Press Limited. The
full terms of this license are available at https://www.dovepress.com/terms
and incorporate the Creative Commons Attribution
- Non Commercial (unported, 3.0) License.
By accessing the work you hereby accept the Terms. Non-commercial uses of the work are permitted
without any further permission from Dove Medical Press Limited, provided the work is properly
attributed. For permission for commercial use of this work, please see paragraphs 4.2 and 5 of our Terms.