Back to Journals » Diabetes, Metabolic Syndrome and Obesity » Volume 14
Derivation and Validation of a Prediction Model for Predicting the 5-Year Incidence of Type 2 Diabetes in Non-Obese Adults: A Population-Based Cohort Study
Authors Cai XT ![]() , Ji LW, Liu SS, Wang MR
, Ji LW, Liu SS, Wang MR ![]() , Heizhati M, Li NF
, Heizhati M, Li NF ![]()
Received 17 March 2021
Accepted for publication 28 April 2021
Published 11 May 2021 Volume 2021:14 Pages 2087—2101
DOI https://doi.org/10.2147/DMSO.S304994
Checked for plagiarism Yes
Review by Single anonymous peer review
Peer reviewer comments 3
Editor who approved publication: Prof. Dr. Antonio Brunetti
Xin-Tian Cai,1 Li-Wei Ji,2 Sha-Sha Liu,1 Meng-Ru Wang,1 Mulalibieke Heizhati,1 Nan-Fang Li1
1Hypertension Center of People’s Hospital of Xinjiang Uygur Autonomous Region, Xinjiang Hypertension Institute, National Health Committee Key Laboratory of Hypertension Clinical Research, Urumqi, People’s Republic of China; 2Laboratory of Mitochondrial and Metabolism, National Clinical Research Center for Geriatrics, West China Hospital of Sichuan University, Chengdu, People’s Republic of China
Correspondence: Nan-Fang Li
Hypertension Center of People’s Hospital of Xinjiang Uygur Autonomous Region, Xinjiang Hypertension Institute, National Health Committee Key Laboratory of Hypertension Clinical Research, Urumqi, Xinjiang, People’s Republic of China
Tel +86 991 8564818
Email [email protected]
Purpose: The aim of this study was to derivate and validate a nomogram based on independent predictors to better evaluate the 5-year risk of T2D in non-obese adults.
Patients and Methods: This is a historical cohort study from a collection of databases that included 12,940 non-obese participants without diabetes at baseline. All participants were randomised to a derivation cohort (n = 9651) and a validation cohort (n = 3289). In the derivation cohort, the least absolute shrinkage and selection operator (LASSO) regression model was used to determine the optimal risk factors for T2D. Multivariate Cox regression analysis was used to establish the nomogram of T2D prediction. The receiver operating characteristic (ROC) curve, C-index, calibration curve, and decision curve analysis were performed by 1000 bootstrap resamplings to evaluate the discrimination ability, calibration, and clinical practicability of the nomogram.
Results: After LASSO regression analysis of the derivation cohort, it was found that age, fatty liver, γ-glutamyltranspeptidase, triglycerides, glycosylated hemoglobin A1c and fasting plasma glucose were risk predictors, which were integrated into the nomogram. The C-index of derivation cohort and validation cohort were 0.906 [95% confidence interval (CI), 0.878– 0.934] and 0.837 (95% CI, 0.760– 0.914), respectively. The AUC of 5-year T2D risk in the derivation cohort and validation cohort was 0.916 (95% CI, 0.889– 0.943) and 0.829 (95% CI, 0.753– 0.905), respectively. The calibration curve indicated that the predicted probability of nomogram is in good agreement with the actual probability. The decision curve analysis demonstrated that the predicted nomogram was clinically useful.
Conclusion: Our nomogram can be used as a reasonable, affordable, simple, and widely implemented tool to predict the 5-year risk of T2D in non-obese adults. With this model, early identification of high-risk individuals is helpful to timely intervene and reduce the risk of T2D in non-obese adults.
Keywords: type 2 diabetes, prediction model, nomogram, risk factor
Introduction
Type 2 diabetes (T2D) is a disease characterized by hyperglycemia caused by insulin resistance and relatively insufficient insulin.1 In recent decades, due to the increase in obesity and the popularization of sedentary lifestyles, the incidence of T2D has increased rapidly all over the world, and it is rapidly becoming a serious public health problem in developed and developing countries.2 In the Western Pacific region, including China, Japan and other countries, T2D is considered to be an epidemic, and is the region with the largest number of diabetes in the world.3 T2D can lead to a variety of complications, such as cardiovascular disease, diabetic retinopathy, diabetic nephropathy, diabetic neuropathy, diabetic foot and so on.4 The incidence rate of T2D and its complications is one of the main causes of death, which causes huge burden to patients, especially those living in economically backward areas. In 2019, the latest results from the International Diabetes Federation Diabetes Atlas, 9 th edition, estimated that more than 4 million adults die of T2D and its complications, accounting for 11.3% of all-cause mortality. Approximately half (46.2%, 1.9 million) the deaths attributable to T2D occurred in those younger than 60 years, the working age group.5 Obesity caused by a sedentary lifestyle and a high energy diet are generally considered to be the main risk factors for the onset of T2D.6 However, many T2D patients do not present obesity and the specific etiology of T2D in these non-obese individuals is still unclear.7 However, some studies have reported that T2D in non-obese individuals may be caused by lifestyle, intestinal flora structure, genetic and environmental factors.7–9 As a debilitating chronic epidemic, the core content of T2D prevention strategies is to identify individuals with high risk of T2D.10 As a debilitating chronic epidemic, early detection, early diagnosis, and early treatment are important components of T2D prevention and health care.11 The core part of T2D prevention strategy is to screen individuals at high risk for developing T2D.12 Studies have shown that lifestyle changes and early pharmacological interventions can prevent or delay the onset of T2D and reduce the harmful effects of T2D in non-obese adults.13,14 In addition, screening individuals at high risk for prediabetes will facilitate the targeted implementation of low-cost, time-consuming intervention programs while avoiding the burden of prevention and treatment in low-risk populations.1,15 Therefore, it is very important to investigate the high risk factors of T2D in non-obese people and find a reliable, simple and accurate screening tool to identify the high risk group of T2D in non-obese people. This will be conducive to the effective implementation of T2D prevention program in non-obese adults.
Risk prediction models have considerable potential for the decision-making process of sub-healthy population and patient management. They can screen individuals to determine the increased risk of undiagnosed diseases, thereby initiating secondary prevention management and treatment, and ultimately improving patient prognosis.16–18 Researchers around the world have developed dozens of T2D risk prediction models in different populations. Although there are a large number of risk prediction models, only a few are routinely used in clinical practice.19–22 In addition to the heterogeneity of population and complex mathematical formulas, the lack of simple and intuitive tools to promote the use of these risk prediction models will be another important obstacle for risk communication between patients and clinicians.
The theory of nomogram was put forward by French engineer Philbert Maurice d’Ocagne in 1884. In the field of medicine, the advantage of nomogram is that it can personally predict a certain clinical outcome or the probability of a certain type of event, so it has great value in clinical practice.23 The nomogram transforms the complex regression equation into a simple and intuitive graph. According to the degree of influence of each predictor on the outcome event, assign scores to each predictor, and then add the scores to obtain the total score. Finally, Through the function conversion relationship between the total score and the occurrence probability of the outcome event, the predicted probability of the individual outcome event is calculated.24
In the East Asian population, only a limited number of reliable T2D prediction nomogram models have been established, but all have several limitations.25–28 First of all, most do not consider lifestyle changes, such as physical activity, smoking and alcohol consumption behaviour. Others are based on invasive and cost-effective data, or small-scale and inappropriate cohort selection. Others are based on short-term follow-up or lack of transparent reporting on the steps that produced the pattern. Most importantly, these nomogram models are based on the general population rather than the non-obese population. Using a simple and intuitive nomogram model to accurately estimate the risk of T2D in non-obese adults can help high-risk people take timely intervention measures to reduce the incidence of T2D and improve the quality of life. Therefore, in this study, we constructed and validated a nomogram based on independent predictors to better assess the 5-year risk of T2D in non-obese adults.
Materials and Methods
Data Source
We obtained the data from the “DATADRYAD” database (www.Datadryad.org). This is a website that allows users to download raw data freely. All these authors have waived their copyright on the original research data. Therefore, we can use these data for secondary analysis without infringing the rights of the author. When we use this data, we refer to the Dryad data package in this study in accordance with the Dryad Terms of Service. (Dryad data package: Okamura Takuro, Hashimoto Yoshitaka, Hamaguchi Masahide, Ohobra Akihiro, Kojima Takao, Fukui Michiaki (2018) Data from: Ectopic fat obesity presents the greatest risk for incident type 2 diabetes: a population-based longitudinal study. Dryad Digital Repository. https://doi.org/10.5061/dryad.8q0p192).
The variables of raw data in the database file included baseline information, incident T2D and follow-up duration. The variables were extracted as follows: baseline age, gender, baseline ethanol consumption, baseline fatty liver, baseline body mass index (BMI), baseline waist circumference (WC), baseline alanine aminotransferase (ALT), baseline aspartate transaminase (AST), baseline body weight, baseline habit of exercise, baseline γ-glutamyltranspeptidase (GGT), baseline high density lipoprotein-cholesterol (HDL-C), baseline total cholesterol (TC), baseline triglycerides (TG), baseline glycosylated haemoglobin A1c (HbA1c), baseline alcohol consumption, baseline smoking status, baseline fasting plasma glucose (FPG), baseline systolic blood pressure (SBP), baseline diastolic blood pressure (DBP), follow-up duration, incident T2D.
Study Population
It is worth noting that Okamura Takuro and his collaborators completed the entire study.29 In order to give readers a clearer understanding of the design and implementation steps of the entire study, we give a brief retell. Okamura Takuro et al conducted a population-based longitudinal analysis study at the Murakami Memorial Hospital in Gifu City, Japan, from 2004 to 2015. In this study Okamura Takuro et al used the NAGALA (NAfld in the Gifu Area, Longitudinal Analysis) database to investigate the effect of obesity phenotype on the risk of developing T2D. Since most of the participants require repeated examinations, the researchers conducted a follow-up study of incident T2D diagnosed by blood tests and fatty liver diagnosed by abdominal ultrasound.30 A total of 15,744 subjects were recruited in the original study and screened according to exclusion criteria. Exclusion criteria: (1) alcoholic fatty liver disease, (2) viral hepatitis (defined by measuring hepatitis B antigen and hepatitis C antibody), (3) any drug use during baseline examination, (4) diabetic patients at baseline, (5) participants with missing covariates, and (6) participants diagnosed with T2D at baseline (participants diagnosed by self-report or diagnosed by a fasting plasma glucose ≥ 6.1 mmol/L).
Data Collection and Measurements
In the original study, standardized self-administered questionnaires were used to investigate the medical history and lifestyle factors of all participants, including physical activity, drinking and smoking habits. The researchers assessed alcohol consumption by asking participants about the type and amount of alcohol consumed per week in the previous month, and then estimated the mean weekly alcohol intake. The participants were divided into the following four groups: no or minimal alcohol consumption, <40 g/week; light alcohol consumption, 40–140 g/week; moderate alcohol consumption, 140–280 g/week; or heavy alcohol consumption, >280 g/week. The researchers also classified the participants into three groups according to their smoking status: never smoker, past smoker or current smoker. Non-smokers were defined as participants who never smoked, past smokers were defined as participants who smoked in the past but quit smoking before the baseline examination, and current smokers were defined as participants who smoked at the baseline examination. In addition, the participants were asked about their weekly frequency of physical activity, such as jogging, bicycling, and swimming that lasted long enough to produce perspiration. Exercise status was characterized as regular if any sport that lasted long enough to produce perspiration > 1 ×/week was performed. The questions in the original study were drawn from a validated questionnaire.29,31,32 Blood samples were collected from the participants after fasting for at least 8 h each visit. Samples were centrifuged immediately and were stored at −80°C until analysis. The clinical measurements of GGT, TC, TG, HDL-C, and ALT et al were performed on an automatic analyzer (HITACHI High-Technologies Co., Ltd., Tokyo, Japan). FPG was measured with either the enzymatic or glucose oxidase peroxidative electrode method. HbA1c was measured using a latex agglutination immunoassay, high-performance liquid chromatography or the enzymatic method.
Definitions
The T2D was defined as any of the following: FPG ≥126 mg/dL, HbA1c ≥ 48 mmol/mol, or self-reported during follow-up.33 In Asian populations, obesity was defined as a BMI of 25 kg/m2 as a cut-off,29,34 which has been validated by several studies.35,36 The diagnosis of fatty liver was made by abdominal ultrasound examination performed by trained medical technicians. The images were critically reviewed by a gastroenterologist and the fatty liver was diagnosed without reference to the personal data of the participant. Participants with liver contrast and liver brightness in the four known criteria (vascular blurring, deep attenuation, liver brightness, and hepatorenal echo contrast) were diagnosed with fatty liver.
Ethical Approval
As this study was based on a secondary analysis of previous data and the personal information of the patients in the original data was anonymous, informed consent from the participants was not required. In a previously published article, Okamura et al29 made it clear that the study was approved by the Murakami Memorial Hospital Ethics Committee and that written informed consent was obtained from each participant.
Statistical Analyses
The study is consistent with the transparent reporting of a multivariable prediction model for individual prognosis or diagnosis (TRIPOD): the TRIPOD statement.37
For the derivation and validation of the nomogram, all participants were randomly divided into derivation cohort and validation cohort with a theoretical ratio of 3:1. Baseline characteristics were expressed as the mean ± standard deviation (normal distribution) or median (quartiles) (skewed distribution) of continuous variables, as well as the frequency or percentage of categorical variables. Two-sample t-tests were used to analyze differences between derivation cohort and validation cohort for continuous variables with normal distribution, Wilcoxon rank-sum tests for continuous variables with non-normal distribution, and chi-square tests for categorical variables.
Risk factors were screened by the least absolute shrinkage and selection operator (LASSO) regression analysis, a method of shrinkage and variable selection for linear regression models. To obtain a subset of predictors, LASSO regression analysis compresses the estimates of uncorrelated variables to near zero, and then variables with zero regression coefficients after the contraction process were excluded from the model. Analysis steps: Step 1: valid variables from the dataset were included in the LASSO regression analysis process and the optimal penalty parameter λ is determined by k-fold (10-fold in this case) cross-validation. Step 2: a multivariate Cox regression analysis was used to build the predictive model by combining the features selected in the LASSO regression model. These characteristics were considered to be the hazard ratio (HR) and P-value for the 95% confidence interval (CI). Step 3: the results of the multivariate Cox regression analysis were visualized using forest plots and nomogram respectively.
The discrimination ability of the prediction model was evaluated and compared using Harrell’s concordance index (C-index). The time-dependent receiver operating characteristic (ROC) curve analysis was applied to evaluate the prediction model’s performance at different times. When C-index > 0.7, the model has good discrimination. The area under the ROC curve (AUC) is used to evaluate whether the model’s prediction results meet the requirements. AUC usually ranges from 0.5 to 1.0. The closer the AUC value is to 1, the better the identification ability of prediction model is. The calibration curves were drawn in the derivation cohort and the validation cohort respectively, and the calibration effectiveness of the prediction model was evaluated using the Hosmer-Lemeshow fitting test. The clinical usefulness of the nomogram prediction model was evaluated for the whole cohort by a decision curve analysis (DCA). DCA is a method to determine the clinical practicability of the prediction model according to the net benefit at different threshold probabilities. C-index, ROC curve, calibration curve and DCA were analyzed by 1000 bootstrap resamplings to reduce the over-fitting bias.
All statistical analyses was performed using R software (R Development Core Team; http://www.r-project.org; version 3.6.1). For all analyses, P < 0.05 was deemed statistically significant and all tests were two-sided unless otherwise indicated.
Results
Characteristics of the Derivation and Validation Cohorts
A total of 12,940 participants were included in this study, of which 9651 were in the derivation cohort and 3289 were in the validation cohort. A flow diagram of study design is depicted in Figure 1. The crude incidence was 1.6 and 1.4 cases per 100 person-years for the derivation cohort and validation cohort, respectively. The median follow-up time for the derivation cohort was 1972 days (quartile: 994–3427), and the median follow-up time for the validation cohort was 2131 days (quartile: 1065–3584). In addition, there were no statistically significant differences in baseline demographics, clinical characteristics, follow-up time, and incidence of T2D between the two cohorts. Baseline characteristics of the derivation and validation cohorts are summarised in Table 1.
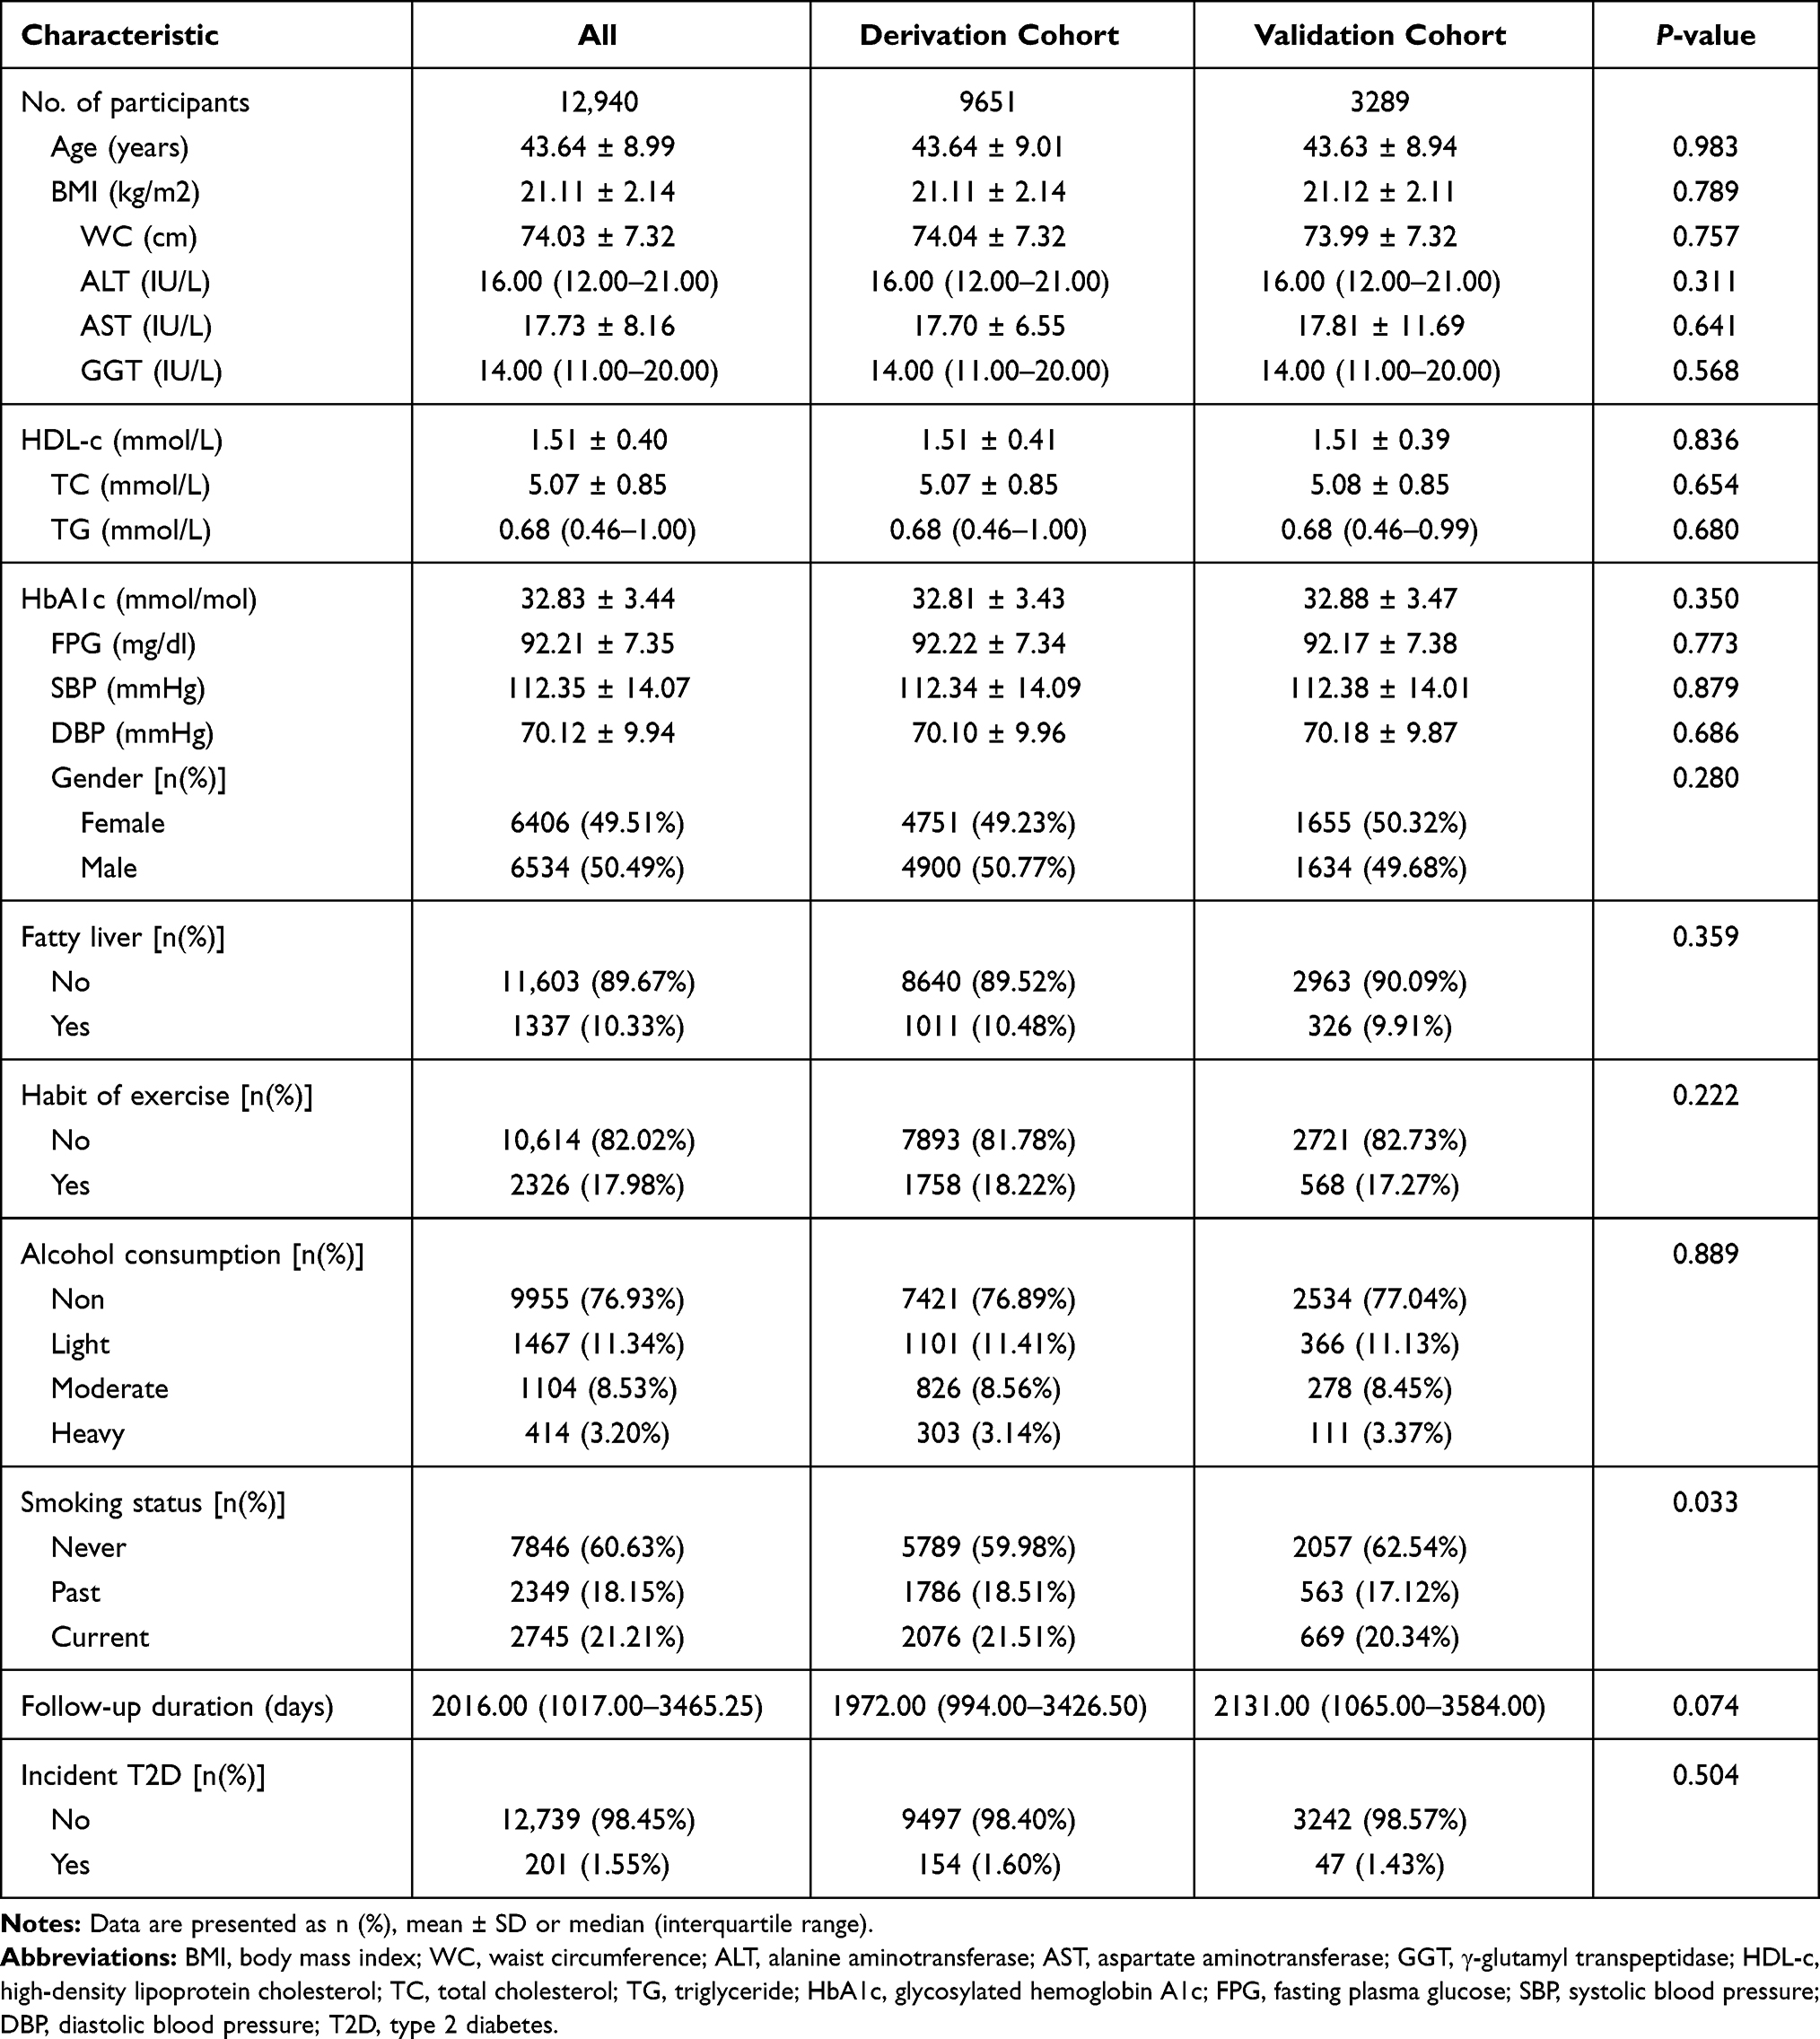 |
Table 1 Demographic and Clinical Characteristics of Study Population in the Derivation and Validation Cohorts |
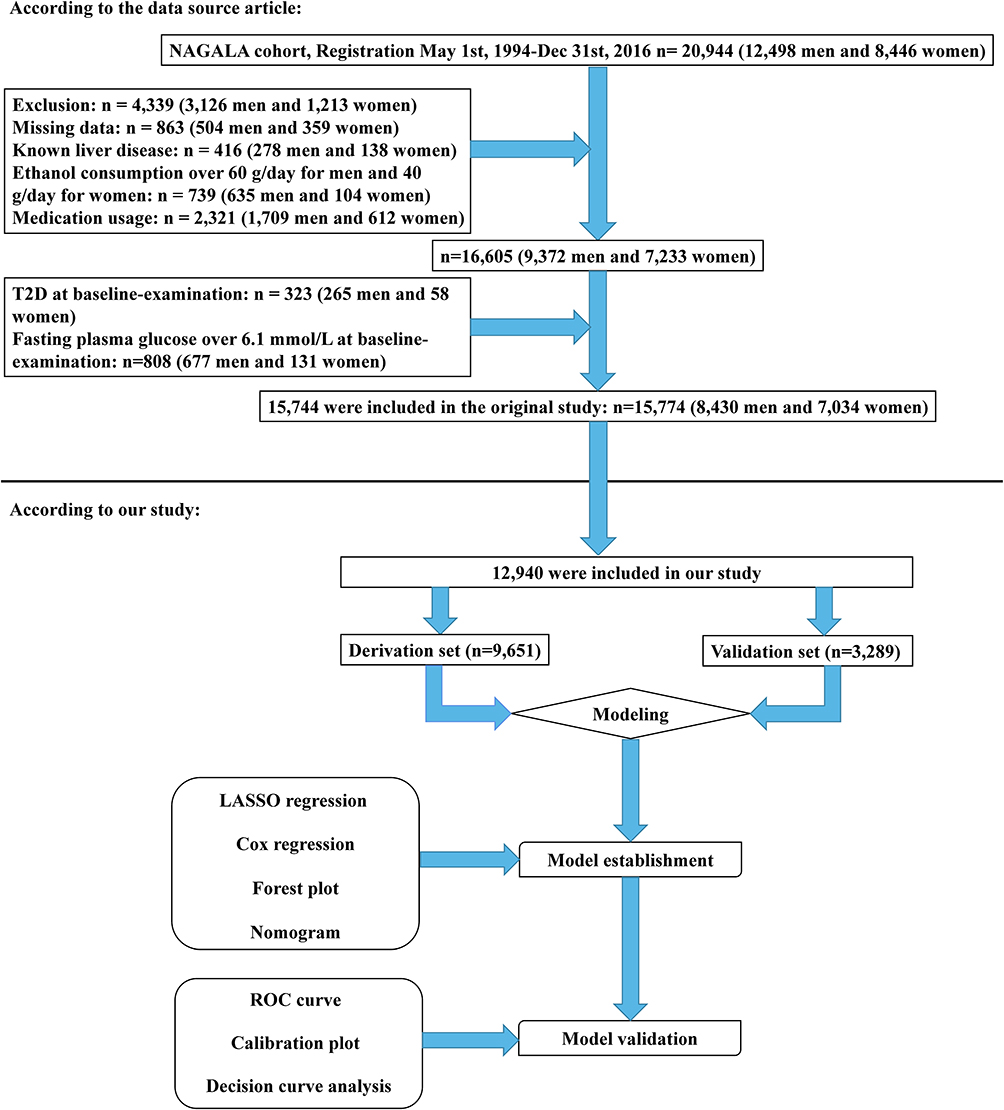 |
Figure 1 Flow diagram of study design. |
Characteristics Selection by LASSO Regression Analysis
Through LASSO regression analysis, we obtained 6 non-zero coefficient characteristics, which shows that we reduced the 18 indicators to 6 indicators. Figure 2A shows the optimization parameters (Lambda) of LASSO regression model were selected by 10-fold cross-validation. Dotted vertical lines were drawn at the optimal values by using the minimum standard and the minimum standard of 1 SE (the 1-SE standard). Figure 2B shows the LASSO coefficient profiles of the 6 features. A coefficient profile plot was produced against the log (Lambda) sequence. Vertical lines were drawn at the value selected using 10-fold cross-validation, where optimal lambda resulted in 6 features with non-zero coefficients. These features included age, fatty liver, GGT, TG, HbA1c and FPG (Table 2).
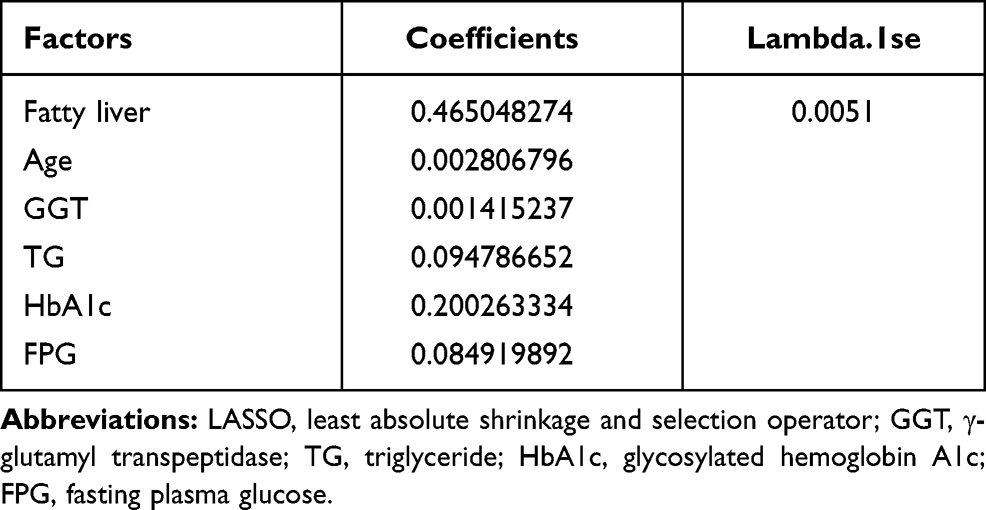 |
Table 2 Risk Factors of Type 2 Diabetes According to the LASSO Regression Model in Non-Obese Adults |
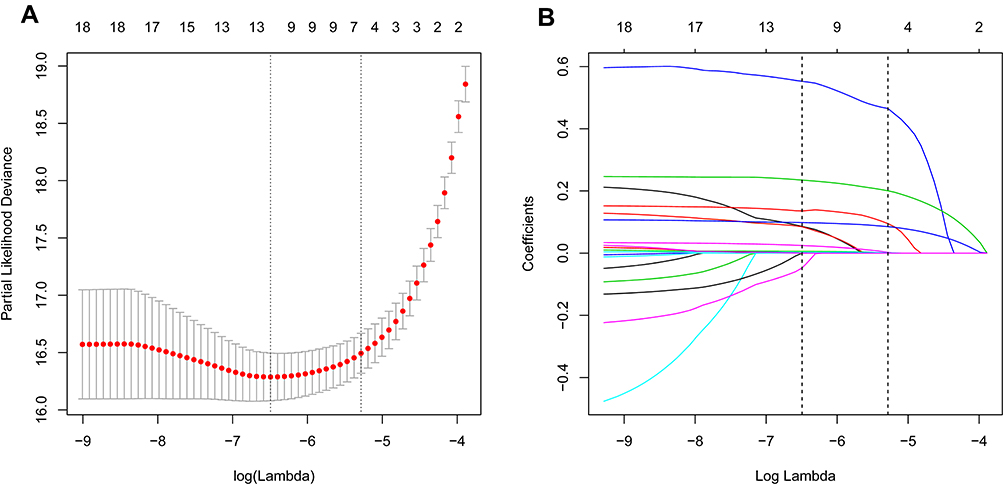 |
Figure 2 Demographic and clinical feature selection using the LASSO regression model. (A) 10-fold cross-validation via minimum criteria was applied for optimal parameter (lambda) selection through LASSO model. Partial likelihood deviance (binomial deviance) curve was schemed versus log (lambda). Dotted vertical lines were drawn at the optimal values by using the minimum criteria and 1 SE of the minimum criteria (the 1-SE criteria). (B) LASSO coefficient profiles of the 19 features. A coefficient profile plot was produced against the log (lambda) sequence. Vertical line was generated at the value selected by 10-fold cross-validation, where optimal lambda resulted in six features with nonzero coefficients. Abbreviations: LASSO, least absolute shrinkage and selection operator; SE, standard error. |
Multivariate Cox Regression Analysis in the Training Cohort
With T2D as the dependent variable, the 6 potential risk factors selected in the LASSO regression method were used as independent variables, including age, fatty liver, GGT, TG, HbA1c and FPG. The results of multivariate Cox regression analysis showed that age (HR 1.04; 95% CI 1.02–1.06), fatty liver (HR 1.98; 95% CI 1.46–2.68), GGT (HR 1.03; 95% CI 1.01–1.05), TG (HR 1.20; 95% CI 1.03–1.41), HbA1c (HR 1.28; 95% CI 1.22–1.34), and FPG (HR 1.12; 95% CI 1.09–1.15) were independent risk factors for T2D in the non-obese population. The results of multivariate Cox regression analysis are shown in the forest plot (Figure 3).
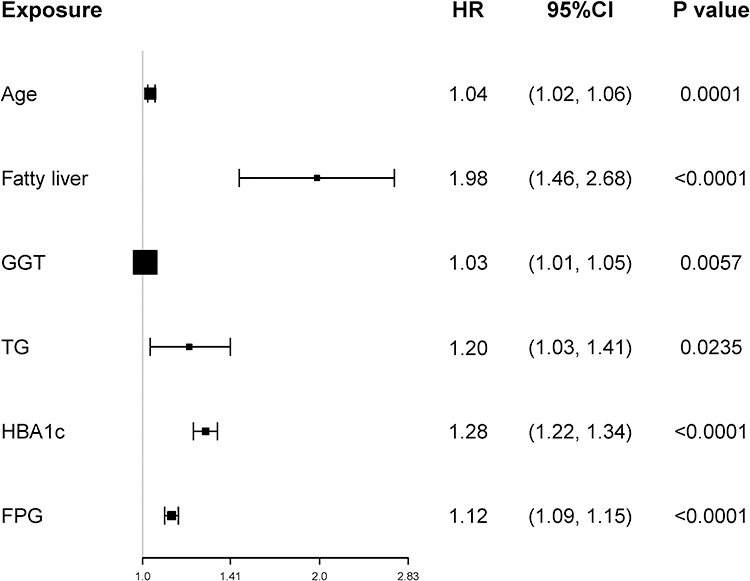 |
Figure 3 Forest plot of the HR of the selected feature. Use forest plot to visualize multivariate Cox regression analysis. |
Establishment of a Predicting Nomogram
The nomogram was established to predict the 5-year risk of T2D in non-obese adults based on the significant predictors (age, fatty liver, GGT, TG, HbA1c and FPG) in the training cohort (Figure 4). Each value for the individuals was determined according to the top Points scale, and then the points for each variable were added. Finally, a personalized 5-year risk of T2D was obtained according to Total Points scale.
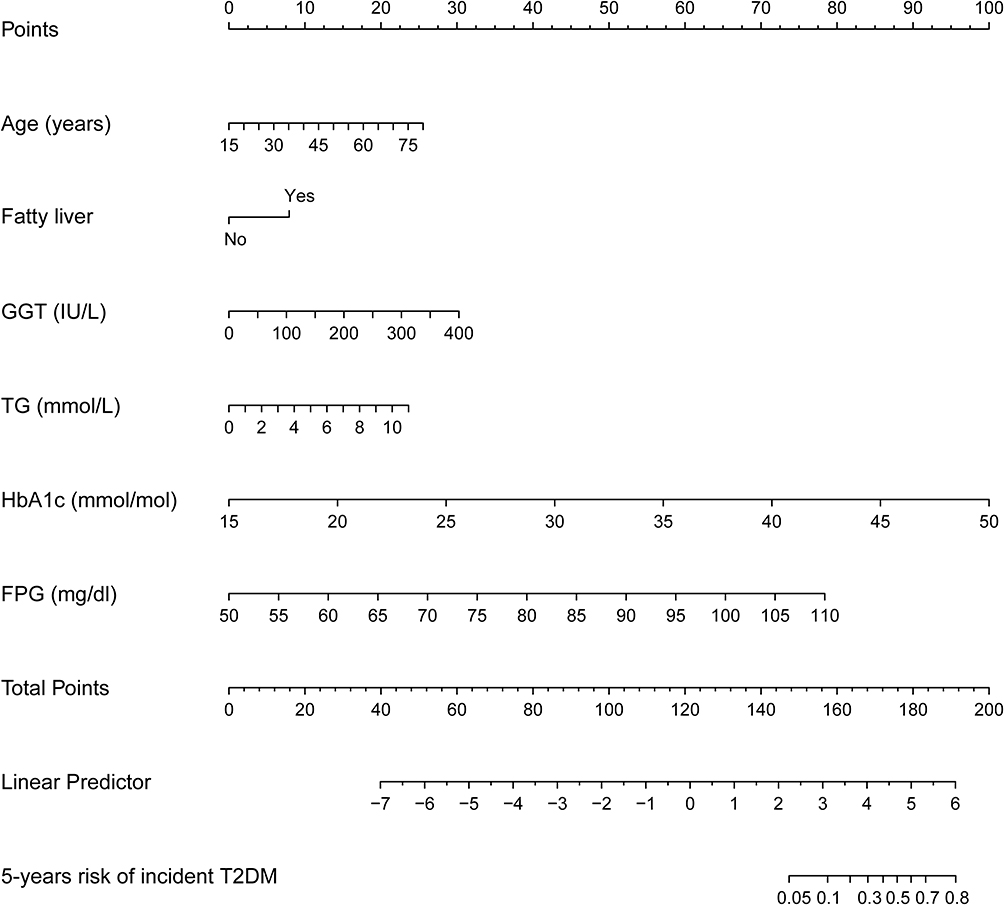 |
Figure 4 Nomogram for predicting the 5-year risk of T2D in non-obese adults. To use the nomogram, find the position of each variable on the corresponding axis. A vertical line was drawn from that value to the top points scale to determine the number of points that were assigned by that variable value. Then, the points from each variable value were added. Finally, draw a line from the total point axis to estimate the 5-year risk of T2D at the lower line of the nomogram. |
Model Performance for Derivation and Validation Cohort
The C-index of the nomogram in derivation cohort was 0.906 (95% CI, 0.878–0.934), whereas in validation cohort was 0.837 (95% CI, 0.760–0.914) (Table 3), indicating that the nomogram has good ability of discrimination and prediction. The results of time-dependent ROC analyses are shown in Figure 5A and B. The predictive model of the nomogram resulted in AUC ranging from 0.906 to 0.929 for different time points in derivation cohort. The predictive model of the nomogram resulted in AUC ranging from 0.740 to 0.869 for different time points in validation cohort. In the derivation cohort, the AUC for 5-year risk of T2D in non-obese adults was 0.916 (95% CI, 0.889–0.943). Likewise, in the validation cohort, the AUC for 5-year risk of T2D in non-obese adults was 0.829 (95% CI, 0.753–0.905), indicating that the nomogram has good ability of discrimination. The calibration of the nomogram prediction model was evaluated by Hosmer-Lemeshow fitting test, and calibration curves were obtained (Figure 6A and B). Using the Hosmer-Lemeshow test, there was no statistically significant difference between the predicted risk of T2D and the observed risk (P > 0.05). The calibration curves of the nomogram model for the probability of T2D in the non-obese population showed good prediction accuracy between the predicted and observed values, both in the derivation and validation cohorts.
 |
Table 3 C-Index in the Nomogram on Derivation Cohort and Validation Cohorts |
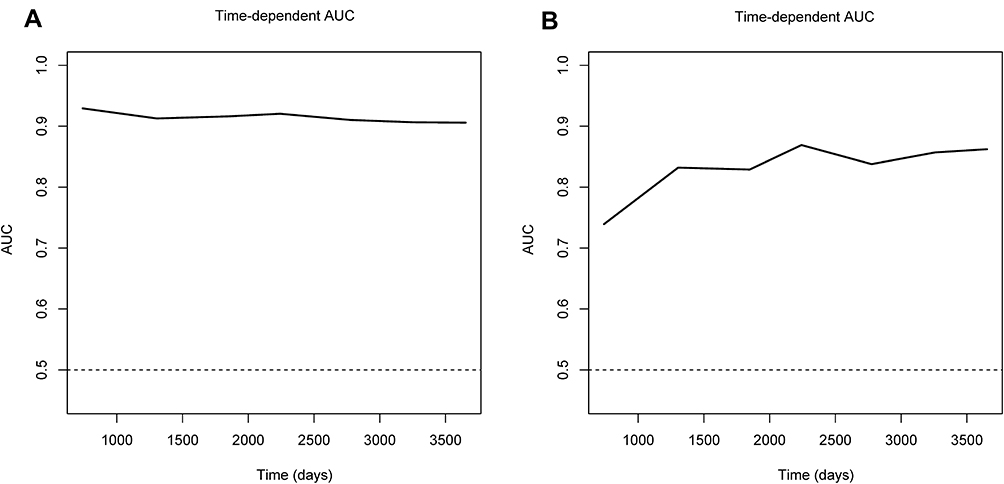 |
Figure 5 Time-dependent receiver-operating characteristic (ROC) curves of the model in the derivation and validation cohort. (A) Time-dependent ROC curve of the model in the derivation cohort. (B) Time-dependent ROC curve of the model in the validation cohort. The solid and dashed lines depict the AUC and random chance, respectively. *Using bootstrap resampling (times = 1000). |
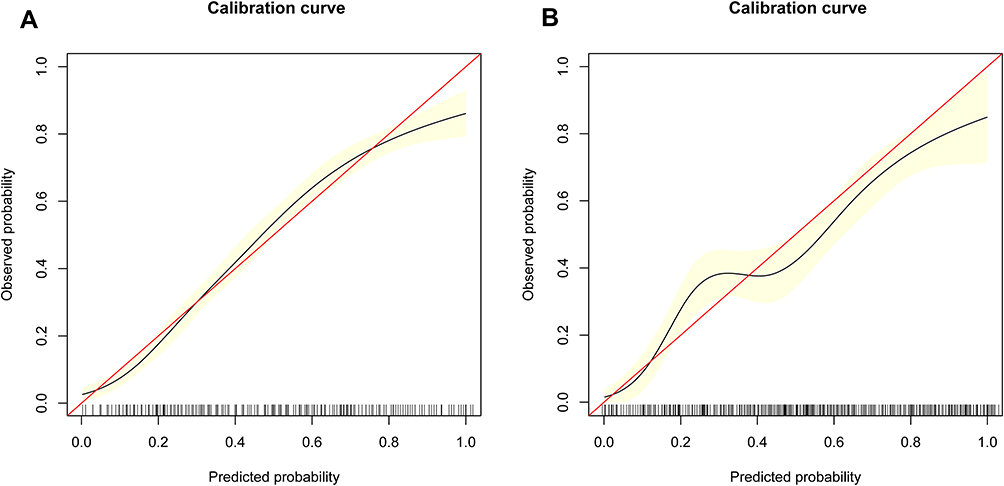 |
Figure 6 Calibration curves for the derivation and validation cohort models. (A) Calibration curve of the model in the derivation cohort. (B) Calibration curve of the model in the validation cohort. The red solid line represents an ideal predictive model, and the solid black line shows the actual performance of the predictive model. The yellow shadow represents 95% confidence interval. The calibration curves showed a good correlation between the predicted probability and actual probability. *Using bootstrap resampling (times = 1000). |
Clinical Usefulness of the Predicting Nomogram
Using data from the whole cohort, DCA showed clinical utility for the 5-year risk of T2D in a non-obese population. The farther the model curve is from the black and light gray lines, the better the clinical application effect of the nomogram prediction model. When the threshold probability was between 1% and 69.5%, the nomogram of T2D risk prediction provided more net benefits than “all individuals with T2D” or “no individuals with T2D” (Figure 7), indicating that the nomogram was clinically useful.
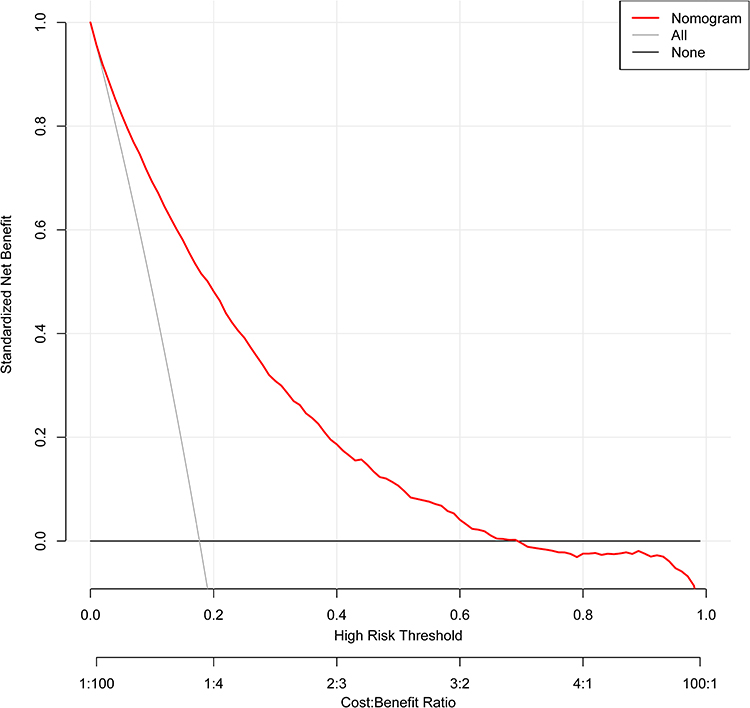 |
Figure 7 The Decision curve analysis of the nomogram in the whole cohort. Net benefit was produced against the high risk threshold. The black line represents the net benefit when none of the participants are considered to develop diabetes, while the light gray line represents the net benefit when all participants are considered to develop diabetes. The area between the “no treatment line” (black line) and “all treatment line” (light gray line) in the model curve indicates the clinical utility of the model. The farther the model curve is from the black and light gray lines, the better the clinical use of the nomogram. *Using bootstrap resampling (times = 1000). |
Discussion
T2D is a major health problem that is growing in severity worldwide.38 The number of people with T2D aged 20–79 years was predicted to rise to 642 million by 2040.39 The prevalence of T2D is also increasing rapidly in the Western Pacific region and is expected to exceed 202 million by 2035, attributed to rapid urbanization and changes in lifestyle and epigenetics.40,41 T2D can lead to a variety of complications that can cause severe physical and psychological distress and place an increasing burden on the socioeconomic and public health care systems.42 Obesity is now a well-known independent risk factor for T2D.8 Many mechanisms have been reported regarding the association of obesity with T2D, including insulin resistance, the prohibition of insulin action, and relative insufficiency of insulin action.43,44 Therefore, weight loss in obese individuals is effective in controlling T2D.43 Recently, T2D in non-obese individuals has attracted attention. In fact, according to an epidemiological study in Japan, over 60% of people with T2D in this Japanese population were not obese.45 And another study reported that 68.2% of instances of newly detected T2D was those of non-obese T2D in southern China.46 Compared with obese individuals, the key defect that causes the development of hyperglycemia in T2D in non-obese individuals is impaired pancreatic insulin secretion and decreased insulin resistance.45,47 It is worth noting that the increased risk of cardiovascular disease in non-obese type 2 diabetic patients is similar to that of obese type 2 diabetic patients.48,49 In addition, a meta-analysis showed that adults with normal weight at the time of incident T2D had higher non-cardiovascular and cardiovascular mortality compared with obese adults.50 Therefore, non-obese T2D may have underlying pathophysiological changes, which may lead to a worse prognosis than obese T2D. However, a possible mechanism explaining this phenomenon has yet to be elucidated.51–53 Therefore, early detection of individuals at high risk for T2D in the non-obese population is essential to reduce the incidence of T2D, the complications of T2D, and the socioeconomic burden, which prompted us to carry out this study.
Although different T2D prediction models based on demographic information and clinical measurements have been established, they have been used mainly in European and American populations. In the East Asian population, only a limited number of reliable T2D prediction models have been established, each containing different risk predictors. In addition, their predictive performance and clinical utility vary greatly. In 2019, Lin et al26 performed a Cox proportional hazards regression analysis to develop a nomogram to predict the 5-year incidence of T2D based on age, sex, hypertensive dyslipidemia, smoking status, BMI, and family history of T2D. The C-index of the model was 0.815. However, they did not perform a decision curve analysis to assess the clinical utility of the model. In addition, categorizing the risk predictors of continuous variables will cause detrimental information loss and affect the ability to detect real relationships. In 2019, Wang et al28 developed a nomogram to predict the risk of 2-year T2D in healthy residents of mainland China based on BMI, age, FPG, HDL-C, LDL-C, and TG. The AUCs for females and males were 0.847 and 0.755, respectively. Consistent with our nomogram, their nomogram contains continuous predictor variables. However, they did not consider HbA1c, fatty liver, smoking and history of alcohol consumption. In addition, they did not measure how closely the predicted risk fits the actual risk. Compared with the above-mentioned similar studies, our nomogram fills these gaps. First of all, our research has a large sample size (n = 12,940). Second, we comprehensively considered new factors in the study, such as HbA1c, fatty liver, smoking and drinking history. Third, nomograms and decision curves were used to visualize risk scores to improve their clinical utility. Fourth, the performance of nomogram was evaluated using multiple new methods, including calibration plots and decision curves.
Nomogram is considered to be a practical and reliable prediction tool, which can evaluate the individual probability of clinical events by integrating different prognosis and determinants, and quantify individual risk by combining a variety of important prognostic factors.24,28 Nomogram relies on a user-friendly digital interface to improve accuracy and provide easier to understand prognosis to help better clinical decision-making.24,54,55 In this population-based cohort study, we developed and validated an individualized prediction nomogram of 5-year risk of T2D in a non-obese population. To the best of our knowledge, our study is the first to establish an individualized predictive nomogram for predicting the 5-year risk of T2D in a non-obese population. And because this is a retrospective cohort study, it can significantly reduce the risk of selection bias and information bias. A large degree of discrimination and prediction ability was found in both the derivation cohort and the validation cohort, which indicates that there is a relatively good predictive ability to distinguish individuals with T2D risk from individuals without T2D risk. The calibration curve indicated that the prediction model was relatively accurate in predicting the risk of T2D. In addition, the decision curve analysis proved that the clinical application of nomogram can avoid additional T2D screening for individuals with low risk of T2D in non-obese adults, reduce economic burden and medical cost.
Risk predictors in this prediction model included age, GGT, TG, FPG, HbA1c, and fatty liver. These variables identified as risk factors for T2D are consistent with previous studies.25,26,28,56 T2D usually occurs in adults and is more common in the elderly. Advanced age is an unalterable risk factor for T2D. Ageing of pancreatic β-cells leads to decreased glucose sensitivity and defective insulin secretion, leading in hyperglycaemia and T2D.57 Age-related glucose intolerance is usually accompanied by insulin resistance and β-cell dysfunction. The epigenetic changes caused by ageing may affect gene expression and insulin secretion in pancreatic islets.58 Bacos et al59 found that age-related changes in DNA methylation in human pancreatic islets are related to insulin secretion and T2D.
GGT exists on the surface of most cell types and is highly active in tissues, especially in liver, pancreas, kidney and bile duct. Traditionally, serum GGT has been considered as a marker of hepatobiliary disease or excessive alcohol consumption.60 Although many epidemiological studies have confirmed that serum GGT levels are closely associated with the onset of T2D and are important biochemical risk indicators for predicting T2D, the specific biological mechanism of serum GGT and T2D is not completely clear.61 At present, researchers have proposed several possible mechanisms to explain the relationship between GGT and T2D. Firstly, GGT is not only a sensitive indicator of oxidative stress, but also a direct contributor to oxidative stress. Oxidative stress is a factor that reduces insulin secretion by destroying pancreatic cells.60 Secondly, we propose that GGT is associated with T2D through hepatic steatosis (such as non-alcoholic fatty liver), which is associated with impaired hepatic insulin resistance.62 Finally, genetic variants of GGT may be a factor that increases the risk of T2D.60,63
According to previous studies, dyslipidemia is a well-known independent risk factor for T2D and impaired fasting glucose.64,65 Similar to these reports, in our prediction model, individuals with dyslipidemia in the non-obese population had a higher T2D risk score.25,56 Dyslipidemia and T2D often coexist in the same individual. As an endocrine organ, adipose tissue can affect glucose and lipid metabolism, and TG is the most abundant lipid in adipose tissue.66 TG itself may directly lead to the disorder of glucose metabolism. Excess adipose tissue releases many lipid metabolites, pro-inflammatory cytokines and cellular stress, all of which mediate insulin resistance.67,68
FPG level can reflect the secretion level and function of basal insulin. Elevated FPG levels are associated with an increased risk of T2D, which may be closely related to insulin response and insulin sensitivity.69 HbA1c level not only reflects the blood glucose level at a certain time point, but also reflects the average blood glucose level in the past three months.70 Previous studies have shown that HbA1c can be used as a predictor of T2D, diabetic complications and diabetic drug response.71,72 A broader prospective open cohort study in England found that both FPG and HbA1c improved the ability to identify 10-year T2D risk prediction models.73
Objectively, there are some limitations to our study. First, the diagnosis of T2D depends on fasting blood glucose ≥ 126 mg/dl, HbA1c ≥ 48 mmol/mol or self-reported T2D, rather than 2-hour oral glucose tolerance test, which may be underestimated. Secondly, there is a lack of data of LDL-C, insulin and fasting C-peptides levels in the database, so it is not possible to compare the accuracy of triglyceride glucose index and homeostasis model assessment of insulin resistance in predicting risk of T2D. Third, as this large cohort study was conducted in Japan. Therefore, whether the results of this study can be extended to other races and some special groups, such as pregnant women and children, requires further validation by external cohorts. Fourth, the nomogram is based on a retrospective cohort, excluding individuals with incomplete data, which may lead to selection bias. Finally, this report is a secondary analysis on the basis of the existing database. Although many confounding factors have been adjusted, some variables not included in the database, such as family history, diet, rest and sleep, psychological factors and data of participants receiving treatment, have not been adjusted. Therefore, the potential impact of these residual confounding factors on the results can not be ignored.
Conclusion
We developed and validated a personalized prediction nomogram for non-obese adults with 5-year T2D risk, including age, GGT, TG, FPG, HbA1c, and fatty liver. The application of this model is helpful for clinicians, especially community medical workers, to evaluate the risk of T2D in non-obese adults, and formulate effective primary prevention strategies for T2D according to the evaluation results, to reduce the risk of T2D.
Funding
This work was supported by the Projects of Provincial Natural Science Foundation of Xinjiang Uygur Autonomous Region (no. 2019D01C147).
Disclosure
The authors declared no competing interests in this work.
References
1. Gloyn AL, Drucker DJ. Precision medicine in the management of type 2 diabetes. Lancet Diabetes Endocrinol. 2018;6(11):891–900. doi:10.1016/S2213-8587(18)30052-4
2. Kautzky-Willer A, Harreiter J, Pacini G. Sex and gender differences in risk, pathophysiology and complications of type 2 diabetes mellitus. Endocr Rev. 2016;37(3):278–316.
3. Nanditha A, Ma RC, Ramachandran A, et al. Diabetes in asia and the pacific: implications for the global epidemic. Diabetes Care. 2016;39(3):472–485. doi:10.2337/dc15-1536
4. Zheng Y, Ley SH, Hu FB. Global aetiology and epidemiology of type 2 diabetes mellitus and its complications. Nat Rev Endocrinol. 2018;14(2):88–98. doi:10.1038/nrendo.2017.151
5. Saeedi P, Salpea P, Karuranga S, et al. Mortality attributable to diabetes in 20–79 years old adults, 2019 estimates: results from the International Diabetes Federation Diabetes Atlas, 9th edition. Diabetes Res Clin Pract. 2020;162:108086. doi:10.1016/j.diabres.2020.108086
6. Leitner DR, Frühbeck G, Yumuk V, et al. Obesity and type 2 diabetes: two diseases with a need for combined treatment strategies - EASO can lead the way. Obes Facts. 2017;10(5):483–492. doi:10.1159/000480525
7. Li X, Wu Y, Zhao J, et al. Distinct cardiac energy metabolism and oxidative stress adaptations between obese and non-obese type 2 diabetes mellitus. Theranostics. 2020;10(6):2675–2695. doi:10.7150/thno.40735
8. Rattarasarn C. Dysregulated lipid storage and its relationship with insulin resistance and cardiovascular risk factors in non-obese Asian patients with type 2 diabetes. Adipocyte. 2018;7(2):71–80. doi:10.1080/21623945.2018.1429784
9. Fingeret M, Marques-Vidal P, Vollenweider P. Incidence of type 2 diabetes, hypertension, and dyslipidemia in metabolically healthy obese and non-obese. Nutr Metab Cardiovasc Dis. 2018;28(10):1036–1044. doi:10.1016/j.numecd.2018.06.011
10. Herman WH. The global agenda for the prevention of type 2 diabetes. Nutr Rev. 2017;75(suppl 1):13–18. doi:10.1093/nutrit/nuw034
11. Golubnitschaja O, Costigliola V. EPMA. General report & recommendations in predictive, preventive and personalised medicine 2012: white paper of the European Association for predictive, preventive and personalised medicine. EPMA J. 2012;3(1):14. doi:10.1186/1878-5085-3-14
12. Wang CY, Neil DL, Home P. vision - An overview of prospects for diabetes management and prevention in the next decade. Diabetes Res Clin Pract. 2020;2018(143):101–112.
13. le Roux CW, Astrup A, Fujioka K, et al. 3 years of liraglutide versus placebo for type 2 diabetes risk reduction and weight management in individuals with prediabetes: a randomised, double-blind trial. Lancet. 2017;389(10077):1399–1409. doi:10.1016/S0140-6736(17)30069-7
14. Brito JP, Montori VM, Davis AM. Metabolic surgery in the treatment algorithm for type 2 diabetes: a joint statement by international diabetes organizations. JAMA. 2017;317(6):635–636. doi:10.1001/jama.2016.20563
15. Samocha-Bonet D, Debs S, Greenfield JR. Prevention and treatment of type 2 diabetes: a pathophysiological-based approach. Trends Endocrinol Metab. 2018;29(6):370–379. doi:10.1016/j.tem.2018.03.014
16. Horáková D, Azeem K, Benešová R, et al. Total and high molecular weight adiponectin levels and prediction of cardiovascular risk in diabetic patients. Int J Endocrinol. 2015;2015:545068. doi:10.1155/2015/545068
17. Wu Q, Xu Y, Zhang KJ, Jiang SM, Zhou Y, Zhao Y. A clinical model for the prediction of acute exacerbation risk in patients with idiopathic pulmonary fibrosis. Biomed Res Int. 2020;2020:8848919. doi:10.1155/2020/8848919
18. Liu K, Lai M, Wang S, Zheng K, Xie S, Wang X. Construction of a CXC chemokine-based prediction model for the prognosis of colon cancer. Biomed Res Int. 2020;2020:6107865.
19. Läll K, Mägi R, Morris A, Metspalu A, Fischer K. Personalized risk prediction for type 2 diabetes: the potential of genetic risk scores. Genet Med. 2017;19(3):322–329. doi:10.1038/gim.2016.103
20. Di Camillo B, Hakaste L, Sambo F, et al. HAPT2D: high accuracy of prediction of T2D with a model combining basic and advanced data depending on availability. Eur J Endocrinol. 2018;178(4):331–341. doi:10.1530/EJE-17-0921
21. Wilkinson L, Yi N, Mehta T, Judd S, Garvey WT. Development and validation of a model for predicting incident type 2 diabetes using quantitative clinical data and a Bayesian logistic model: a nationwide cohort and modeling study. PLoS Med. 2020;17(8):e1003232. doi:10.1371/journal.pmed.1003232
22. Liu X, Li Z, Zhang J, et al. A novel risk score for type 2 diabetes containing sleep duration: a 7-year prospective cohort study among chinese participants. J Diabetes Res. 2020;2020:2969105. doi:10.1155/2020/2969105
23. Balachandran VP, Gonen M, Smith JJ, DeMatteo RP. Nomograms in oncology: more than meets the eye. Lancet Oncol. 2015;16(4):e173–180. doi:10.1016/S1470-2045(14)71116-7
24. Cai X, Aierken X, Ahmat A, et al. A nomogram model based on noninvasive bioindicators to predict 3-year risk of nonalcoholic fatty liver in nonobese mainland chinese: a prospective cohort study. Biomed Res Int. 2020;2020:8852198. doi:10.1155/2020/8852198
25. Wu Y, Hu H, Cai J, et al. A prediction nomogram for the 3-year risk of incident diabetes among Chinese adults. Sci Rep. 2020;10(1):21716. doi:10.1038/s41598-020-78716-1
26. Lin Z, Guo D, Chen J, Zheng B. A nomogram for predicting 5-year incidence of type 2 diabetes in a Chinese population. Endocrine. 2020;67(3):561–568. doi:10.1007/s12020-019-02154-x
27. Chung SM, Park JC, Moon JS, Lee JY. Novel nomogram for screening the risk of developing diabetes in a Korean population. Diabetes Res Clin Pract. 2018;142:286–293. doi:10.1016/j.diabres.2018.05.036
28. Wang K, Gong M, Xie S, et al. Nomogram prediction for the 3-year risk of type 2 diabetes in healthy mainland China residents. EPMA J. 2019;10(3):227–237. doi:10.1007/s13167-019-00181-2
29. Okamura T, Hashimoto Y, Hamaguchi M, Obora A, Kojima T, Fukui M. Ectopic fat obesity presents the greatest risk for incident type 2 diabetes: a population-based longitudinal study. Int J Obes (Lond). 2019;43(1):139–148. doi:10.1038/s41366-018-0076-3
30. Hamaguchi M, Kojima T, Takeda N, et al. The metabolic syndrome as a predictor of nonalcoholic fatty liver disease. Ann Intern Med. 2005;143(10):722–728. doi:10.7326/0003-4819-143-10-200511150-00009
31. Ma CM, Yin FZ. Glycosylated hemoglobin a1c improves the performance of the nomogram for predicting the 5-year incidence of type 2 diabetes. Diabetes Metab Syndr Obes. 2020;13:1753–1762. doi:10.2147/DMSO.S252867
32. Okamura T, Hashimoto Y, Hamaguchi M, Obora A, Kojima T, Fukui M. Effect of alcohol consumption and the presence of fatty liver on the risk for incident type 2 diabetes: a population-based longitudinal study. BMJ Open Diabetes Res Care. 2020;8(1):e001629. doi:10.1136/bmjdrc-2020-001629
33. American Diabetes Association. Standards of medical care in diabetes–2011. Diabetes Care. 2011;34(Suppl 1):S11–61. doi:10.2337/dc11-S011
34. Ota T, Takamura T, Hirai N, Kobayashi K. Preobesity in World Health Organization classification involves the metabolic syndrome in Japanese. Diabetes Care. 2002;25(7):1252–1253. doi:10.2337/diacare.25.7.1252
35. Hashimoto Y, Hamaguchi M, Fukuda T, Obora A, Kojima T, Fukui M. Weight gain since age of 20 as risk of metabolic syndrome even in non-overweight individuals. Endocrine. 2017;58(2):253–261. doi:10.1007/s12020-017-1411-5
36. Hashimoto Y, Tanaka M, Okada H, et al. Metabolically healthy obesity and risk of incident CKD. Clin J Am Soc Nephrol. 2015;10(4):578–583. doi:10.2215/CJN.08980914
37. Collins GS, Reitsma JB, Altman DG, Moons KG. Transparent reporting of a multivariable prediction model for individual prognosis or diagnosis (TRIPOD): the TRIPOD statement. BMJ. 2015;350(jan07 4):g7594. doi:10.1136/bmj.g7594
38. Harding JL, Pavkov ME, Magliano DJ, Shaw JE, Gregg EW. Global trends in diabetes complications: a review of current evidence. Diabetologia. 2019;62(1):3–16. doi:10.1007/s00125-018-4711-2
39. Ogurtsova K, da Rocha Fernandes JD, Huang Y, et al. IDF Diabetes Atlas: global estimates for the prevalence of diabetes for 2015 and 2040. Diabetes Res Clin Pract. 2017;128:40–50. doi:10.1016/j.diabres.2017.03.024
40. Chan JC, Malik V, Jia W, et al. Diabetes in Asia: epidemiology, risk factors, and pathophysiology. JAMA. 2009;301(20):2129–2140. doi:10.1001/jama.2009.726
41. Ramachandran A, Ma RC, Snehalatha C. Diabetes in Asia. Lancet. 2010;375(9712):408–418. doi:10.1016/S0140-6736(09)60937-5
42. da Rocha Fernandes J, Ogurtsova K, Linnenkamp U, et al. IDF Diabetes Atlas estimates of 2014 global health expenditures on diabetes. Diabetes Res Clin Pract. 2016;117:48–54. doi:10.1016/j.diabres.2016.04.016
43. Bhupathiraju SN, Hu FB. Epidemiology of obesity and diabetes and their cardiovascular complications. Circ Res. 2016;118(11):1723–1735. doi:10.1161/CIRCRESAHA.115.306825
44. Singer-Englar T, Barlow G, Mathur R. Obesity, diabetes, and the gut microbiome: an updated review. Expert Rev Gastroenterol Hepatol. 2019;13(1):3–15. doi:10.1080/17474124.2019.1543023
45. Kashima S, Inoue K, Matsumoto M, Akimoto K. Prevalence and characteristics of non-obese diabetes in Japanese men and women: the yuport medical checkup center study. J Diabetes. 2015;7(4):523–530. doi:10.1111/1753-0407.12213
46. Tang Z, Fang Z, Huang W, et al. Non-obese diabetes and its associated factors in an underdeveloped area of South China, Guangxi. Int J Environ Res Public Health. 2016;13(10):976. doi:10.3390/ijerph13100976
47. Racette SB, Weiss EP, Hickner RC, Holloszy JO. Modest weight loss improves insulin action in obese African Americans. Metabolism. 2005;54(7):960–965. doi:10.1016/j.metabol.2005.02.013
48. Hirakawa Y, Ninomiya T, Kiyohara Y, et al. Age-specific impact of diabetes mellitus on the risk of cardiovascular mortality: an overview from the evidence for Cardiovascular Prevention from Observational Cohorts in the Japan Research Group (EPOCH-JAPAN). J Epidemiol. 2017;27(3):123–129. doi:10.1016/j.je.2016.04.001
49. Manson JE, Colditz GA, Stampfer MJ, et al. A prospective study of maturity-onset diabetes mellitus and risk of coronary heart disease and stroke in women. Arch Intern Med. 1991;151(6):1141–1147. doi:10.1001/archinte.1991.00400060077013
50. Carnethon MR, De Chavez PJ, Biggs ML, et al. Association of weight status with mortality in adults with incident diabetes. JAMA. 2012;308(6):581–590. doi:10.1001/jama.2012.9282
51. Huvinen E, Engberg E, Meinilä J, et al. Lifestyle and glycemic health 5 years postpartum in obese and non-obese high diabetes risk women. Acta Diabetol. 2020;57(12):1453–1462. doi:10.1007/s00592-020-01553-1
52. Pearson JA, Wong FS, Wen L. The importance of the Non Obese Diabetic (NOD) mouse model in autoimmune diabetes. J Autoimmun. 2016;66:76–88. doi:10.1016/j.jaut.2015.08.019
53. Sung KC, Seo DC, Lee SJ, Lee MY, Wild SH, Byrne CD. Non alcoholic fatty liver disease and risk of incident diabetes in subjects who are not obese. Nutr Metab Cardiovasc Dis. 2019;29(5):489–495. doi:10.1016/j.numecd.2019.01.016
54. Cai X, Zhu Q, Wu T, et al. Development and validation of a novel model for predicting the 5-year risk of type 2 diabetes in patients with hypertension: a retrospective cohort study. Biomed Res Int. 2020;2020:9108216. doi:10.1155/2020/9108216
55. Ding Y, Mao Z, Ruan J, et al. Nomogram-based new recurrence predicting system in early-stage papillary thyroid cancer. Int J Endocrinol. 2019;2019:1029092. doi:10.1155/2019/1029092
56. Wang K, Yang QF, Chen XL, et al. Metabolic syndrome and its components predict the risk of type 2 diabetes mellitus in the mainland chinese: a 3-year cohort study. Int J Endocrinol. 2018;2018:9376179. doi:10.1155/2018/9376179
57. Helman A, Klochendler A, Azazmeh N, et al. p16(Ink4a)-induced senescence of pancreatic beta cells enhances insulin secretion. Nat Med. 2016;22(4):412–420. doi:10.1038/nm.4054
58. Li N, Liu F, Yang P, et al. Aging and stress induced β cell senescence and its implication in diabetes development. Aging (Albany NY). 2019;11(21):9947–9959. doi:10.18632/aging.102432
59. Bacos K, Gillberg L, Volkov P, et al. Blood-based biomarkers of age-associated epigenetic changes in human islets associate with insulin secretion and diabetes. Nat Commun. 2016;7:11089. doi:10.1038/ncomms11089
60. Lee JH, Lee HS, Lee YJ. Serum γ-glutamyltransferase as an independent predictor for incident type 2 diabetes in middle-aged and older adults: findings from the KoGES over 12 years of follow-up. Nutr Metab Cardiovasc Dis. 2020;30(9):1484–1491. doi:10.1016/j.numecd.2020.04.027
61. Zhao W, Tong J, Liu J, Liu J, Li J, Cao Y. The dose-response relationship between gamma-glutamyl transferase and risk of diabetes mellitus using publicly available data: a Longitudinal Study in Japan. Int J Endocrinol. 2020;2020:5356498. doi:10.1155/2020/5356498
62. Venkatesan C, Younossi ZM. Potential mechanisms underlying the associations between liver enzymes and risk for type 2 diabetes. Hepatology. 2012;55(3):968–970. doi:10.1002/hep.24769
63. Zhang J, Cheng N, Ma Y, et al. Liver enzymes, fatty liver and type 2 diabetes mellitus in a jinchang cohort: a prospective study in adults. Can J Diabetes. 2018;42(6):652–658. doi:10.1016/j.jcjd.2018.02.002
64. Nelson AJ, Rochelau SK, Nicholls SJ. Managing Dyslipidemia in Type 2 Diabetes. Endocrinol Metab Clin North Am. 2018;47(1):153–173. doi:10.1016/j.ecl.2017.10.004
65. Lazarte J, Hegele RA. Dyslipidemia management in adults with diabetes. Can J Diabetes. 2020;44(1):53–60. doi:10.1016/j.jcjd.2019.07.003
66. Vekic J, Zeljkovic A, Stefanovic A, Jelic-Ivanovic Z, Spasojevic-Kalimanovska V. Obesity and dyslipidemia. Metabolism. 2019;92:71–81. doi:10.1016/j.metabol.2018.11.005
67. Meex R, Watt MJ. Hepatokines: linking nonalcoholic fatty liver disease and insulin resistance. Nat Rev Endocrinol. 2017;13(9):509–520. doi:10.1038/nrendo.2017.56
68. Hirano T. Pathophysiology of Diabetic Dyslipidemia. J Atheroscler Thromb. 2018;25(9):771–782. doi:10.5551/jat.RV17023
69. Ogata E, Asahi K, Yamaguchi S, et al. Low fasting plasma glucose level as a predictor of new-onset diabetes mellitus on a large cohort from a Japanese general population. Sci Rep. 2018;8(1):13927. doi:10.1038/s41598-018-31744-4
70. Yazdanpanah S, Rabiee M, Tahriri M, et al. Evaluation of glycated albumin (GA) and GA/HbA1c ratio for diagnosis of diabetes and glycemic control: a comprehensive review. Crit Rev Clin Lab Sci. 2017;54(4):219–232. doi:10.1080/10408363.2017.1299684
71. Škrha J, Šoupal J, Škrha J
72. Sidorenkov G, van Boven J, Hoekstra T, Nijpels G, Hoogenberg K, Denig P. HbA1c response after insulin initiation in patients with type 2 diabetes mellitus in real life practice: identifying distinct subgroups. Diabetes Obes Metab. 2018;20(8):1957–1964. doi:10.1111/dom.13332
73. Hippisley-Cox J, Coupland C. Development and validation of QDiabetes-2018 risk prediction algorithm to estimate future risk of type 2 diabetes: cohort study. BMJ. 2017;359:j5019. doi:10.1136/bmj.j5019
 © 2021 The Author(s). This work is published and licensed by Dove Medical Press Limited. The
full terms of this license are available at https://www.dovepress.com/terms
and incorporate the Creative Commons Attribution
- Non Commercial (unported, 3.0) License.
By accessing the work you hereby accept the Terms. Non-commercial uses of the work are permitted
without any further permission from Dove Medical Press Limited, provided the work is properly
attributed. For permission for commercial use of this work, please see paragraphs 4.2 and 5 of our Terms.
© 2021 The Author(s). This work is published and licensed by Dove Medical Press Limited. The
full terms of this license are available at https://www.dovepress.com/terms
and incorporate the Creative Commons Attribution
- Non Commercial (unported, 3.0) License.
By accessing the work you hereby accept the Terms. Non-commercial uses of the work are permitted
without any further permission from Dove Medical Press Limited, provided the work is properly
attributed. For permission for commercial use of this work, please see paragraphs 4.2 and 5 of our Terms.