Back to Journals » Drug Design, Development and Therapy » Volume 8
Defensive mechanism in cholangiocarcinoma cells against oxidative stress induced by chlorin e6-based photodynamic therapy
Authors Lee HM, Chung C, Kim CH, Kim DH, Kwak TW, Jeong Y ![]() , Kang DH
, Kang DH
Received 11 February 2014
Accepted for publication 29 April 2014
Published 18 September 2014 Volume 2014:8 Pages 1451—1462
DOI https://doi.org/10.2147/DDDT.S62265
Checked for plagiarism Yes
Review by Single anonymous peer review
Peer reviewer comments 3
Hye Myeong Lee,1,* Chung-Wook Chung,2,* Cy Hyun Kim,1,3 Do Hyung Kim,1,3 Tae Won Kwak,1 Young-Il Jeong,1 Dae Hwan Kang1,3
1National Research and Development Center for Hepatobiliary Cancer, Research Institute for Convergence of Biomedical Science and Technology, Yangsan, Republic of Korea; 2Department of Biological Sciences, Andong National University, Andong, Republic of Korea; 3School of Medicine, Pusan National University, Yangsan, Republic of Korea
*Both authors contributed equally to this work
Abstract: In this study, the effect of chlorin e6-based photodynamic therapy (Ce6-PDT) was investigated in human intrahepatic (HuCC-T1) and extrahepatic (SNU1196) cholangiocarcinoma (CCA) cells. The amount of intracellular Ce6 increased with increasing Ce6 concentration administered, or with incubation time, in both cell lines. The ability to take up Ce6 and generate reactive oxygen species after irradiation at 1.0 J/cm2 did not significantly differ between the two CCA cell types. However, after irradiation, marked differences were observed for photodamage and apoptotic/necrotic signals. HuCC-T1 cells are more sensitive to Ce6-PDT than SNU1196 cells. Total glutathione (GSH) levels, glutathione peroxidase and glutathione reductase activities in SNU1196 cells were significantly higher than in HuCC-T1 cells. With inhibition of enzyme activity or addition of GSH, the phototoxic effect could be controlled in CCA cells. The intracellular level of GSH is the most important determining factor in the curative action of Ce6-PDT against tumor cells.
Keywords: cholangiocarcinoma, chlorin e6, photodynamic therapy, reactive oxygen species, glutathione, heme oxygenase-1
Introduction
Cholangiocarcinoma (CCA) is a malignant tumor that originates from the biliary system. It can be classified into two types: intrahepatic and extrahepatic CCA.1,2 Diagnosing CCA is very difficult, since the cause (or pathogenesis) of this biliary tract malignancy is not thoroughly understood.2–5 More than 90% of all CCA cases are differentiated adenocarcinoma, which presents as a solid mass, and has the ability to infiltrate surrounding tissues. The disease grows intraductally, causing biliary obstruction.6 Diagnosing and surgically treating CCA is difficult. Thus, palliative therapies, such as endoscopic stent placement, chemotherapy, radiation therapy, and photodynamic therapy (PDT) are commonly used to treat CCA.7–12
PDT is noninvasive and shows some advantages, such as minimal side effects avoidable normal organ dysfunction, compared against other cancer treatment methods.13 Thus, PDT can be used in CCA patients to improve survival and quality of life.14 In PDT, three components are applied in sequence: oxygen, photosensitizer (PS), and suitable light. Among these, PS is the most significant for improving the therapeutic effect of PDT; this emphasizes the requirement for a suitable and powerful PS.15–17 Chlorin e6 (Ce6), a second generation PS, is an asymmetric molecule with three ionizable carboxylic groups. Ce6 has lipophilic characteristics and exists in different ionic forms, dependent on pH.18–20 Ce6 has a shorter tumor accumulation time, more rapid clearance, and higher singlet oxygen generation efficiency, compared against first generation PS.20–22 Moreover, Ce6 is activated by near-infrared wavelengths (eg, 664 nm), enabling the molecule to reach deep tissue layers.23
Under irradiation, light-activated PS can deliver light energy to the surrounding oxygen to form reactive oxygen species (ROS) such as superoxide, hydroxyl radical, singlet oxygen, and hydrogen peroxide. Intracellular ROS generation may induce cell death through apoptotic or necrotic signals.15,16 Protective mechanisms are activated in cells under oxidative stress. Intracellularly-generated ROS can be controlled by intracellular antioxidant molecules, such as glutathione (GSH) or heme oxygenase-1 (HO-1).24–27 Intracellular GSH can act as an electron donor, to reduce intracellular free radicals through the action of glutathione peroxidase (GPx). As a result, GSH is oxidized to glutathione disulfide (GSSG). GSSG is converted back to GSH by the enzyme glutathione reductase (GR), which uses nicotinamide adenine dinucleotide phosphate (NADPH) as an electron donor.25–29 This mechanism is used by cells to maintain appropriate levels of intracellular GSH. HO-1, which is activated under various stress conditions, such as oxidative stress, is a powerful cytoprotective protein involved in cellular defensive mechanisms.16,28,30,31 Previous studies have reported that HO-1 expression is accelerated by ROS, which can be generated by PDT.32,33
In this study, we investigated the effect of Ce6-PDT on CCA cells. The abilities of protective mechanisms that could cause phototoxicity were investigated with two types of CCA cells: intrahepatic (HuCC-T1) and extrahepatic (SNU1196) cells.
Material and methods
Materials
Ce6 was obtained from Frontier Scientific Inc. (Logan, UT, USA). 2′,7′-dichlorofluorescein diacetate (DCFH-DA), MTT, propidium iodide (PI), mercaptosuccinic acid (MS), and GSH were purchased from Sigma-Aldrich Co. (St Louis, MO, USA). Fluorescein isothiocyanate (FITC)-Annexin V was obtained from Santa Cruz Biotechnology Inc. (Santa Cruz, CA, USA). Cell culture materials were purchased from Thermo Fisher Scientific (Waltham, MA, USA). The total GSH detection kit, GPx activity kit, and GR activity kit were obtained from Enzo Life Sciences (Farmingdale, NY, USA).
Cell culture
Human intrahepatic and extrahepatic CCA cells lines, HuCC-T1 and SNU1196, were used in this study. HuCC-T1 and SNU1196 cells were purchased from the Health Science Research Resources Bank (Osaka, Japan) and the Korean Cell Line Bank (Seoul, Korea), respectively. Cells were cultured in Roswell Park Memorial Institute (RPMI) 1640 medium (Thermo Fisher Scientific) supplemented with 10% fetal bovine serum (FBS) (Thermo Fisher Scientific) and 1% antibiotics, at 37°C, in a humidified atmosphere of 5% CO2. Human normal skin fibroblast cells (CDD-986Sk) (Korean Cell Line Bank) were cultured in Iscove’s Modified Dulbecco’s Medium (IMEM; Thermo Fisher Scientific) containing 10% FBS and 1% antibiotics. Cells were subcultured twice per week.
Cytotoxicity of Ce6
CDD-986Sk cells were seeded into 96-well plates. For starvation, the cells were incubated in IMEM medium containing 0.1% FBS for 24 hours. After removing the medium, the cells were washed with phosphate buffered saline (PBS). Next, 100 μL of fresh serum-free IMEM medium containing various concentrations of Ce6 was added to each well. The cells were then incubated in the dark at 37°C for 120 minutes. Finally, the cells were washed twice with PBS and cytotoxicity was measured using the MTT assay.
Dark toxicity of Ce6
CCA cells were seeded into a 96-well plate and treated with various concentrations of Ce6 (1–15 μM) in serum-free medium for 90 minutes. After removing the medium, the cells were washed twice with PBS. To each well, 100 μL of the growth medium containing 10% FBS was added, and the cells were incubated for an additional 24 hours. Cell viability was measured using the MTT assay.
Intracellular uptake of Ce6
The assay was performed as described in our previous study.34 Briefly, the seeded cells were treated with various concentrations (0–15 μM) of Ce6. The cells were washed and solubilized, and then Ce6 fluorescence was measured.
Confocal microscopy
Intracellular Ce6 was observed using confocal laser scanning microscopy (CLSM) (TCS SP2; Leica Microsystems, Wetzlar, Germany). The microscope was equipped with a 590 nm excitation filter and a 615 nm filter to detect Ce6 fluorescence. Approximately 2×10⁵ cells were seeded onto a cover glass in a 6-well plate. The cells were then treated with 10 μM Ce6 for 90 minutes in serum-free medium, after which, the medium was discarded and the cells were washed with PBS. The cells on the cover glass were observed using CLSM.
PDT
CCA cells were seeded into a 96-well plate and cultured for 24 hours. The cells were then washed twice with PBS, and 100 μL of serum-free medium, containing various concentrations of Ce6, was added to each well, followed by incubation for 90 minutes. The medium was removed and the cells were washed twice with PBS. Next, 100 μL of fresh RPMI medium containing 10% FBS was added, and the cells were exposed to an expanded homogeneous beam of 664 nm radiation (SH Systems, Gwangju, Korea) at a light dose of 0.0–2.0 J/cm2, and the signal was measured using a photo-radiometer (Delta Ohm, Padova, Italy). After irradiation, the cells were incubated for an additional 24 hours. Cell viability was determined using the MTT assay.
MTT assay
The MTT assay is based on the principle that live cells are able to cleave a tetrazolium ring to a molecule that absorbs at 570 nm in active mitochondria.35 The assay was performed as described in our previous study.34
Flow cytometry analysis
To evaluate apoptotic and necrotic cells, FITC-Annexin V and PI were used, respectively. Following PDT, the uptake of these two reagents was assessed using a FACScan™ flow cytometer (BD Biosciences, San Jose, CA, USA). CCA cells were treated with various concentrations of Ce6 (0.0, 1.0, and 10.0 μM) and then exposed to a light dose of 0.5–2.0 J/cm2. Cells were harvested by trypsinization and washed with PBS. The cells were resuspended in binding buffer (10 mM 4-[2-hydroxyethyl]-1-piperazineethanesulfonic acid [pH 7.4], 150 mM NaCl, 5 mM KCl, 1 mM MgCl2, 1.8 mM CaCl2), containing FITC-Annexin V (1 μg/mL) and PI (10 μg/mL), then further incubated for 15 minutes at room temperature (25°C) in the dark. The cells were analyzed immediately, using flow cytometry.
ROS assay
The DCFH-DA method was used for detection of ROS.36 The assay was performed as described in our previous study.34 Briefly, the cells were treated with various concentrations of Ce6 (0–15 μM) with DCFH-DA, at a final concentration of 20 μM, in phenol red-free RPMI medium, and incubated at 37°C for 90 minutes. Then, the cells were washed with PBS, and 100 μL of phenol red-free RPMI medium was added to each well. After irradiation, ROS generation was measured by using an Infinite® M200 PRO microplate reader (Tecan Group AG, Männedorf, Switzerland) (excitation wavelength: 485 nm; emission wavelength: 535 nm).
Measurement of total GSH and enzymatic activity
The Glutathione (total) detection kit (Enzo) was used to measure total intracellular GSH in CCA cells. The two CCA cell lines were incubated with 0–10 μM Ce6 for 90 minutes. Total GSH content was measured according to the manufacturer’s instructions, after the cells were irradiated under 0.0–1.0 J/cm2 light. The Glutathione peroxidase activity kit (Enzo) was used to measure changes in enzymatic activity, according to the manufacturer’s instructions.
Inhibition of GPx and external addition of GSH
HuCC-T1 or SNU1196 cells were seeded in a 96-well plate and cultured for 24 hours. After washing twice with PBS, the cells were used in this study. First, 100 μL of serum-free medium containing 5 μM Ce6 and 1.25 mM GSH were added to HuCC-T1 cells for 90 minutes. For SNU1196 cells, 5 μM of Ce6 was added to the cells for 60 minutes, and then the cells were further incubated for 30 minutes with MS, a GPx inhibitor. Following incubation, the medium was discarded and the two types of CCA cells were washed twice with PBS. Intracellular GSH content, ROS generation, and phototoxicity were measured in the two CCA cell preparations described above. To measure ROS generation, 1.0 J/cm2 light power was used. In addition, basal GPx activity in SNU1196 cells was measured according to the manufacturer’s instructions, after the cells were incubated with 0.0 or 10.0 mM MS for 30 minutes.
Western blotting
For Western blot analysis, HuCC-T1 and SNU1196 cells were seeded in 100-well dishes and incubated for 18 hours. Cells were treated with different concentrations of Ce6 for 90 minutes, and then irradiated with 1.0 J/cm2 light power. Cells that had not been irradiated were also evaluated. After incubation of PDT in serum-free medium for 1 hour, or after seeding cells into 100-well dishes, the basal protein level was measured.
To obtain protein, the cells were washed with PBS and denatured in cell lysis buffer (GenDEPOT, Barker, TX, USA). The supernatant was collected and the protein concentration was determined using a BCA protein assay kit (Thermo Fischer Scientific). Fifty micrograms of protein was resolved using 4%–15% precast sodium dodecyl sulfate polyacrylamide gel electrophoresis (SDS-PAGE) gel (Bio-Rad Laboratories Inc., Hercules, CA, USA) electrophoresis, followed by electroblotting (280 mA for 2 hours) on a polyvinylidene difluoride membrane (GE Healthcare UK Ltd, Little Chalfont, UK). Blots were blocked with 5% nonfat dry milk and probed with monoclonal anti-HO-1, gamma-glutamylcysteine synthetase (GCS), γ-GCSm, GPx-1/2, GR, and β-actin antibodies (1:1000 sc-136960, sc-166356, sc-22754, sc-133160, sc-133159, and sc-47778) (Santa Cruz Biotechnology Inc.). Membranes were then incubated with a secondary anti-mouse or anti-rabbit antibody (1:5000) (Sigma-Aldrich Co.), followed by chemiluminescence-based detection (GE Healthcare UK Ltd).
Statistical data analysis
The results are expressed as the means of at least three parallel experiments ± standard error of the mean (SEM). Statistical analysis was performed using the Student’s t-test with P<0.05 as the minimal level of significance.
Results
Cytotoxicity and dark toxicity of Ce6
The cytotoxicity and dark toxicity of Ce6 were tested against CCD-986Sk and CCA cells, respectively. As shown in Figure 1A and B, no cytotoxicity or dark toxicity was observed in the presence of less than 15 μM Ce6. These results indicate that Ce6, at concentrations between 0.0–15.0 μM, has no effect on cell survival.
 | Figure 1 Toxicities and intracellular accumulation of Ce6 in human CCA cells. |
Cellular uptake and intracellular fluorescence of Ce6
Ce6 uptake in CCA cells was investigated. As shown in Figure 1C and D, intracellular Ce6 levels increased, dependent on dose and incubation time, regardless of CCA cell type. Additionally, no difference in the ability to absorb Ce6 was observed between the cell types; a similar amount of Ce6 was observed in both HuCC-T1 and SNU1196 cells for each PS dose or incubation time. Furthermore, the intracellular Ce6 level was saturated at a 10 μM Ce6 concentration, or 90 minutes incubation time. Thus, we used 10 μM, or 90 minutes, for further studies involving Ce6 concentration, or incubation time.
Figure 1E shows the strong fluorescence intensity of Ce6 in CCA cells. Based on confocal microscopy results, the red fluorescence of Ce6 indicated widespread intracellular distribution of Ce6.
Phototoxicity induced by Ce6-PDT
Figure 2A and B show cell survival after irradiation with different light intensities (0.0–2.0 J/cm2) after 90 minutes of incubation in the presence of 0–15 μM Ce6. Cell survival decreased with increased light dose or Ce6 concentration in both CCA cell types. As light dose increased from 0.5 to 2.0 J/cm2, the half maximal inhibitory concentration (IC50) value decreased from 6.2 μM to 2.8 μM and from 26.2 μM to 7.1 μM, in HuCC-T1 and SNU1196 cells, respectively (Table 1). Under the same PDT conditions, PS concentration, or light dose, HuCC-T1 cells were more sensitive to Ce6-PDT, compared against SNU1196 cells, although intracellular Ce6 levels between CCA cells showed no significant difference (Figure 1C and D).
 | Figure 2 Phototoxicity of Ce6-PDT against CCA cells. |
 | Table 1 IC50 value of Ce6-PDT treated CCA cells |
Figure 2C through F show the apoptotic or necrotic cell populations after Ce6-PDT. A single treatment of drug or light could not induce cell death, but apoptotic or necrotic cell populations increased when the drug and light were simultaneously used to treat cells (Figure 2C and D). Apoptotic and necrotic cells increased by approximately 15.3 and 25.7 times, and 2.3 and 6.8 times, compared against the control group, for HuCC-T1 or SNU1196 cells, respectively. In particular, the numbers of both apoptotic and necrotic cells were significantly increased in HuCC-T1 cells, following treatment with 10 μM Ce6 and 1.0 J/cm2 light, whereas the necrotic population of SNU1196 cells was remarkably increased. Additionally, nearly three times more apoptotic and two times more necrotic HuCC-T1 cells were observed, compared against SNU1196 cells (Figure 2C and D). Furthermore, apoptotic and necrotic cell populations were significantly affected by light intensity or Ce6 concentration (Figure 2E and F). As described above, a relatively lower apoptotic or necrotic signal was observed for SNU1196 cells, compared against HuCC-T1 cells, under the same PDT conditions. Cell death signaling results were correlated with photodamage results. Relatively higher cell death signal and photodamage was observed in HuCC-T1 cells, although a similar level of intracellular Ce6 was observed for the two types of CCA cells.
ROS generation induced by Ce6-PDT
Intracellular ROS generation after Ce6-PDT treatment was observed in both CCA cell types. ROS generation in CCA cells increased up to 220% with increasing Ce6 concentrations (Figure 3). Although a slightly higher amount of ROS was observed in SNU1196 cells than in HuCC-T1 cells, it did not significantly differ between the two cell types.
 | Figure 3 Intracellular ROS generation after Ce6-PDT. |
GSH level and enzyme activity in CCA cells
Figure 4 shows intracellular GSH levels in CCA cells. GSH may act as a scavenger to balance intracellular ROS levels. A basal GSH level nearly 1.4 times greater was observed in SNU1196 cells than in HuCC-T1 cells when Ce6 or light was not used to treat the cells (Figure 4A). After the cells were treated with 5.0 or 10.0 μM Ce6, intracellular GSH was markedly increased in both cell types, particularly in SNU1196 cells. Subsequently, the total GSH level after irradiation decreased dramatically in both CCA cell types with increased drug concentrations or light power. In particular, a more rapid total GSH decreasing slope was observed in SNU1196 cells when light power was increased from 0.0 to 1.0 J/cm2, with 10 μM Ce6 (Figure 4A).
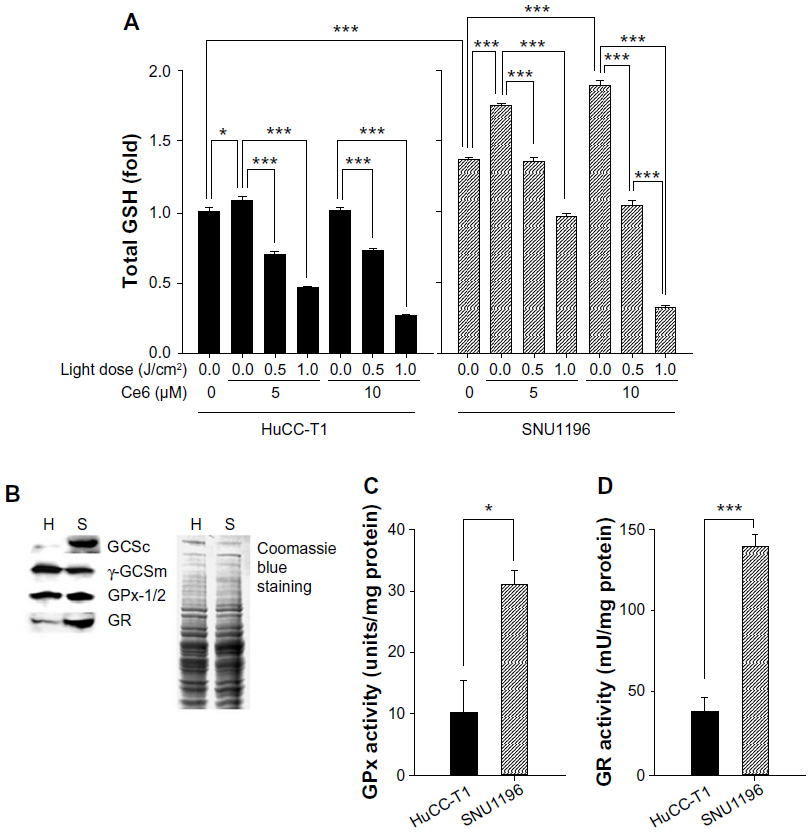 | Figure 4 Effect of GSH on Ce6-PDT in CCA cells. |
GCS, which consists of a catalytic subunit (γ-GCSc) and a modifier subunit (γ-GCSm), is the rate-limiting enzyme for GSH synthesis.37 Therefore, the levels of γ-GCSc and γ-GCSm in the two CCA cell lines were measured. As shown in Figure 4B, very strong expression of γ-GCSc was shown in SNU1196 cells. Interestingly, the opposite situation was observed in the expression of γ-GCSm, even though the difference in expression is not significant. In addition, relatively higher expression of GPx-1/2 and GR were observed in SNU1196 cells. These key enzyme expression results could be correlated with intracellular basal GSH level data (Figure 4A). Furthermore, not only higher expression but also strong enzyme activity was shown in SNU1196 cells compared to HuCC-T1 cells (Figure 4C and D). Approximately 2.5 and 3.5 times greater basal activity of GPx and GR, respectively, was observed in SNU1196 cells, compared against HuCC-T1 cells.
Effect of exogenous GSH or GPx inhibitor on Ce6-PDT in CCA cells
To clarify the effect of GSH in Ce6-based PDT, exogenous GSH, or MS, was added to HuCC-T1, or SNU1196 cells, respectively.
Exogenous GSH and 5 μM Ce6 were simultaneously administered to HuCC-T1 cells. As shown in Figure 5A, the intracellular GSH level in HuCC-T1 cells increased following a single treatment of Ce6 or GSH, without irradiation. And the highest intracellular GSH level was observed when Ce6 and GSH were coadministered to the cells in dark conditions. After irradiation with 1.0 J/cm2 light power, intracellular GSH levels were immediately measured in HuCC-T1 cells that had been treated (or not treated) with Ce6 or exogenous GSH. Intracellular GSH levels did not decrease after irradiation in the absence of Ce6, and intracellular GSH levels were influenced only by irradiation. Interestingly, the highest intracellular GSH consumption tendency was observed in the group treated with additional GSH and Ce6-PDT. Along with measurement of intracellular GSH levels, relative ROS generation and cell death after irradiation were investigated. As shown in Figure 5B, exogenous GSH could positively affect ROS generation and cell survival in Ce6-PDT. Because of the high intracellular GSH level, relatively lower ROS generation and cell death were observed in Ce6-PDT with additional GSH than in Ce6-PDT alone. GSH itself slightly increased ROS levels, which agrees with the results of intracellular GSH level measurements. However, GSH alone did not affect cell survival.
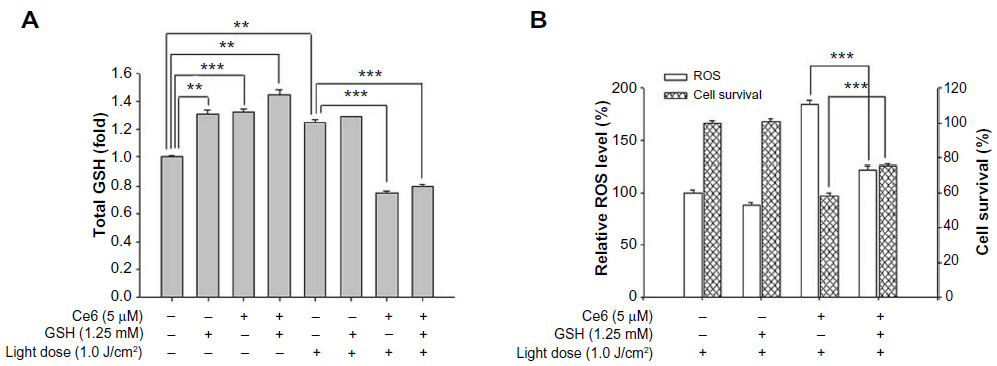 | Figure 5 Effect of exogenous GSH on Ce6-PDT in HuCC-T1 cells. |
MS was used in this study to inhibit GSH oxidization in SNU1196 cells. As shown in Figure 6A, 10 mM MS effectively decreased GPx activity in SNU1196 cells. Actually, GPx activity changed in a dose-dependent manner for MS (data not shown). To identify the effect of GPx activity on the effectiveness of Ce6-PDT, SNU1196 cells were treated with 5 μM of Ce6 for 60 minutes and further incubated for 30 minutes with MS. Total intracellular GSH level, ROS generation, and cell survival were investigated after irradiation with 1.0 J/cm2 (or no irradiation). As described above, intracellular GSH level was affected by additional compounds, such as Ce6 or MS, in the absence of light (Figure 6B). After irradiation, intracellular GSH in SNU1196 cells was generally lower in the presence of Ce6. Since GPx activity was inhibited, GSH consumption generally decreased, suppressing the ability of GSH to eliminate ROS (Figure 6B). Thus, higher ROS levels and increased cell death were observed in the MS-treated group with Ce6 (Figure 6C). In the MS-treated group with Ce6, approximately 1.6 and five times greater ROS levels and cell phototoxicity were observed, respectively, than in Ce6-PDT.
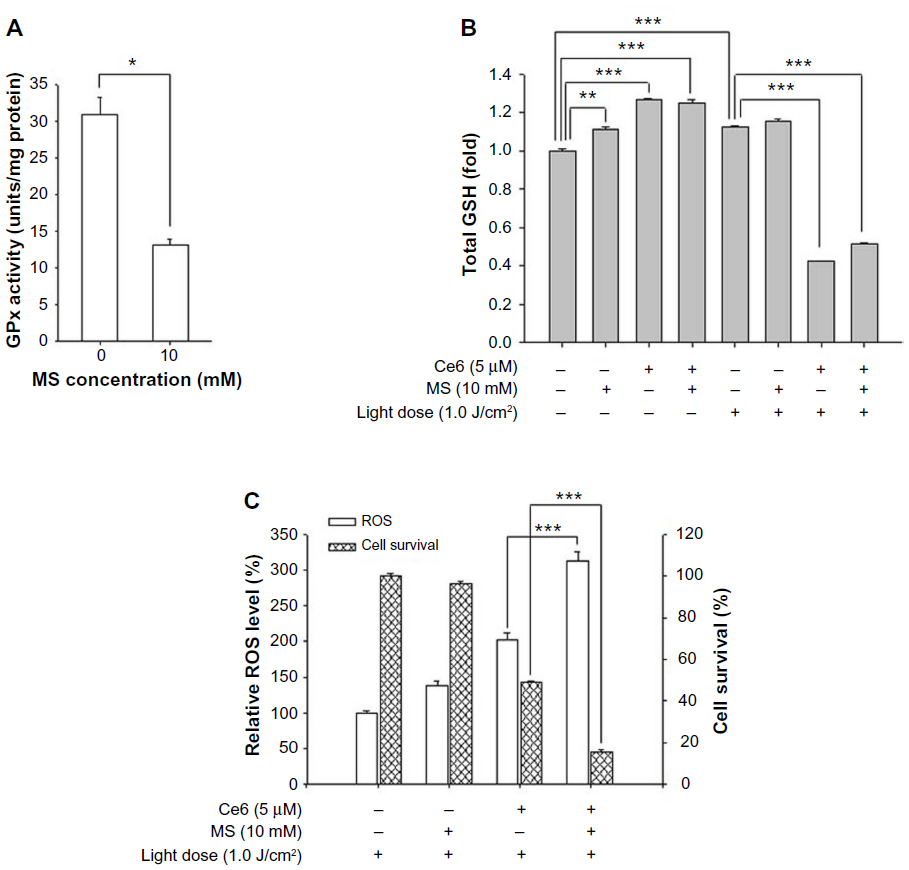 | Figure 6 Effect of GPx inhibitor on Ce6-PDT in SNU1196 cells. |
HO-1 expression in Ce6-PDT
Figure 7 shows HO-1 expression after Ce6 or 5-aminolevulinic acid (ALA)-PDT treatment in HuCC-T1 cells. HO-1 expression was not observed in HuCC-T1 cells after treatment with Ce6-PDT, although different concentrations of Ce6 were used. HO-1 expression was observed only in the positive control group, ALA-PDT.
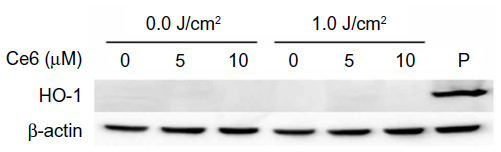 | Figure 7 HO-1 expression induced by Ce6 or ALA-PDT. |
Discussion
In this study, the effectiveness of Ce6-PDT therapy for treating CCA cells was evaluated. Two CCA cell lines, intrahepatic and extrahepatic CCA HuCC-T1 and SNU1196 cells, respectively, were used as CCA cell models. We found that Ce6-PDT could kill CCA cells successfully, and that the degree of photodamage in tumor cells depended on their ability to defend against oxidative stress. Interestingly, even though a similar efficiency of Ce6 uptake and ROS generation was observed in the two CCA cell lines under the same PDT conditions (Figures 1 and 3), photodamage against CCA cells showed a significant difference (Figure 2). HuCC-T1 cells were more sensitive to Ce6-PDT. Additionally, higher apoptotic or necrotic signals after irradiation were observed in HuCC-T1 cells, leading to higher cell death and a lower IC50 value. From these results, we could assume that the difference in photodamage between the two CCA cell lines may be caused by differences in efficiency of the defensive mechanisms (antioxidant molecules) in protecting cells against oxidative stress induced by Ce6-PDT. Therefore, we evaluated the basal level of GSH and the key enzyme activity involved in producing GSH in the two CCA cell lines.
GSH is the best-known antioxidant molecule controlling intracellular ROS levels to maintain redox homeostasis.24–29 Furthermore, GPx and GR have major roles in removing ROS via interconversion of GSH to GSSG. ROS are scavenged by the enzyme GPx, which requires GSH as an electron donor. Oxidized GSSG is reduced back to GSH by the enzyme GR, which uses NADPH as an electron donor.28
To examine this process in detail, intracellular GSH levels were measured in the two CCA cell lines. The basal GSH level in SNU1196 cells was higher than in HuCC-T1 cells (Figure 4A). The GSH level was markedly increased after cells were treated with Ce6 or light only (Figure 4A). It is well known that the intracellular GSH level is generally affected by the presence of various drugs.28 Furthermore, there are some reports that intracellular GSH synthesis could be elevated by light intensity in plant cells.38 At this point, we could assume that suitable light energy could produce some effects on the GSH synthetic mechanism, and that, as a result, the intracellular GSH level was increased in CCA cells. Further studies are needed to clarify this point. GSH levels differed significantly before and after irradiation. Differences in photodamage between HuCC-T1 and SNU1196 cells could be due to varying intracellular levels of GSH and its ability to reduce antioxidants, despite similar levels of intracellular ROS generation (Figures 2 through 5). Several previous studies have described the role of GSH in combating oxidative stress.24–29 Kimani et al reported that GSH is very important in disulfonated aluminium phthalocyanine (AlPcS2)-based PDT; PDT was more effective at inhibition of GSH generation.39 Furthermore, not only higher GSH levels but also higher key enzyme activities of γ-GCSc, γ-GCSm, GPx, and GR were observed in SNU1196 cells.
To further evaluate this observation, the intracellular GSH level in the CCA cell lines was controlled by additional treatment with GSH or inhibition of GPx. As expected, following addition of exogenous GSH, HuCC-T1 cells showed an increased ability to defend against phototoxicity. Upon inhibition of GPx activity, SNU1196 cell survival was dramatically decreased after Ce6-PDT treatment, compared against groups without MS treatment. Similar results have been reported previously.39,40 Following the addition of GSH to cells, Shen et al showed increased GSH levels in mitochondria, which resulted in higher resistance of cells to oxidative stress.41 Additionally, they investigated the role of GPx and GR enzymes in the defense mechanism against ROS. Higher GPx and GR activity in the cells may cause decreased sensitivity to oxidative stress.42–45
When cells are under oxidative stress, protection mechanisms become activated. In addition to GSH, HO-1 is well known as an inducible stress protein, which confers cytoprotection against oxidative injury and cellular stress, both in vitro and in vivo.16,28,30,31 Previous studies have demonstrated the relationship between HO-1 expression and ALA-PDT. Frank et al showed that phototoxicity increases when HO-1 expression is suppressed.46 Similar results were obtained in our previous study.47 We evaluated the expression of HO-1 in HuCC-T1 cells at 4 hours after irradiation in cells that had been treated with 3 mM ALA for 4 hours. Cell death was significantly increased following inhibition of HO-1 by ALA-PDT. HO-1 expression was evaluated after various incubation times following treatment with Ce6-PDT. However, HO-1 expression was not observed in the two CCA cell lines (Figure 7). The activity of GSH-related enzymes and basal GSH level may affect Ce6-PDT efficiency, but HO-1 was not affected by Ce6-PDT. One possible explanation as to why HO-1 expression did not change in Ce6-PDT, is due to the nature of the PS. Actually, ALA itself cannot act as a PS. After ALA is converted to protoporphyrin IX (PpIX) in the heme biosynthetic pathway, the generated PpIX may act as a strong PS. Therefore, PpIX may localize primarily in the mitochondria. HO-1 expression is related to the heme biosynthetic pathway.48 Generally, intracellular Ce6 is located in the plasma membrane and in intracellular vesicles, and Ce6 may effectively kill tumor cells by acting within intracellular organelles.18 Furthermore, the most-generated ROS induced by Ce6-PDT is 1O2, which acts quickly and strongly.20 Therefore, GSH (which is known as a primary defensive molecule against oxidative stress and is located in whole cells) can act critically in Ce6-PDT. But HO-1 needs several hours to express, and no difference of HO-1 expression could be caused by cell shutdown after Ce6-PDT. Cellular antioxidant defensive mechanisms may depend on the location of generated ROS. However, this is not clear, and additional studies are needed to clarify this point.
In conclusion, PDT-induced cellular dysfunction coincides with the PS location. ROS generated by PDT have a short life and a limited range of action in biological systems.49–53 Therefore, the increasing intracellular accumulation of Ce6 represents an improved therapeutic effect of PDT against tumor cells. But, in this study, we found that the degree of Ce6-based phototoxicity differed depending on the ability of the cell to defend against oxidative stress, and this preventive capability is an inherent property of each tumor cell. Therefore, although intracellular Ce6 uptake and ROS levels after irradiation were similar between the two CCA cell lines, cell death signaling and cell survival after PDT differed between the two CCA cell lines.
Conclusion
We investigated the effect of Ce6-PDT on human CCA cells. The photokilling phenomenon was dependent on PS concentration, drug treatment time, and light dose, for both types of CCA cells. In particular, Ce6-PDT more potently induced HuCC-T1 cell death, due to downregulation of antioxidant levels and activity. The results of this study show that Ce6-PDT is a promising candidate for effectively treating CCA, and the effect of Ce6-PDT may be accelerated by controlling GSH levels in tumor cells.
Acknowledgment
This study was supported by a grant from the Korea Healthcare Technology R&D Project, Ministry for Health, Welfare and Family Affairs, Republic of Korea (Number: A091047).
Disclosure
The authors report no conflicts of interest in this work.
References
Karamitopoulou E, Tornillo L, Zlobec I, et al. Clinical significance of cell cycle- and apoptosis-related markers in biliary tract cancer: a tissue microarray-based approach revealing a distinctive immunophenotype for intrahepatic and extrahepatic cholangiocarcinomas. Am J Clin Pathol. 2008;130(5):780–786. | |
Lazaridis KN, Gores GJ. Cholangiocarcinoma. Gastroenterology. 2005;128(6):1655–1667. | |
Patel T. Worldwide trends in mortality from biliary tract malignancies. BMC Cancer. 2002;2:10. | |
Patel T. Increasing incidence and mortality of primary intrahepatic cholangiocarcinoma in the United States. Hepatology. 2001;33(6):1353–1357. | |
Fava G, Lorenzini I. Molecular pathogenesis of cholangiocarcinoma. Int J Hepatol. 2012;2012:630543. | |
Ortner MA. Photodynamic therapy for cholangiocarcinoma. Lasers Surg Med. 2011;43(7):776–780. | |
Cheon YK, Lee TY, Lee SM, Yoon JY, Shim CS. Longterm outcome of photodynamic therapy compared with biliary stenting alone in patients with advanced hilar cholangiocarcinoma. HPB (Oxford). Mar 2012;14(3):185–193. | |
Liberato MJ, Canena JM. Endoscopic stenting for hilar cholangiocarcinoma: efficacy of unilateral and bilateral placement of plastic and metal stents in a retrospective review of 480 patients. BMC Gastroenterol. 2012;12:103. | |
Isayama H, Tsujino T, Nakai Y, et al. Clinical benefit of radiation therapy and metallic stenting for unresectable hilar cholangiocarcinoma. World J Gastroenterol. 2012;18(19):2364–2370. | |
Nonaka T, Nanashima A, Nonaka M, et al. Advantages of laserphyrin compared with photofrin in photodynamic therapy for bile duct carcinoma. J Hepatobiliary Pancreat Sci. 2011;18(4):592–600. | |
Cao LQ, Xue P, Lu HW, Zheng Q, Wen ZL, Shao ZJ. Hematoporphyrin derivative-mediated photodynamic therapy inhibits tumor growth in human cholangiocarcinoma in vitro and in vivo. Hepatol Res. 2009;39(12):1190–1197. | |
Wong Kee Song LM, Wang KK, Zinsmeister AR. Mono-L-aspartyl chlorin e6 (NPe6) and hematoporphyrin derivative (HpD) in photodynamic therapy administered to a human cholangiocarcinoma model. Cancer. 1998;82(2):421–427. | |
Tomizawa Y, Tian J. Photodynamic therapy for unresectable cholangiocarcinoma. Dig Dis Sci. 2012;57(2):274–283. | |
Richter JA, Kahaleh M. Photodynamic therapy: Palliation and endoscopic technique in cholangiocarcinoma. World J Gastrointest Endosc. 2010;2(11):357–361. | |
Dolmans DE, Fukumura D, Jain RK. Photodynamic therapy for cancer. Nat Rev Cancer. 2003;3(5):380–387. | |
Agostinis P, Berg K, Cengel KA, et al. Photodynamic therapy of cancer: an update. CA Cancer J Clin. 2011;61(4):250–281. | |
Triesscheijn M, Baas P, Schellens JH, Stewart FA. Photodynamic therapy in oncology. Oncologist. 2006;11(9):1034–1044. | |
Mojzisova H, Bonneau S, Vever-Bizet C, Brault D. Cellular uptake and subcellular distribution of chlorin e6 as functions of pH and interactions with membranes and lipoproteins. Biochim Biophys Acta. 2007;1768(11):2748–2756. | |
Shim G, Lee S, Kim YB, Kim CW, Oh YK. Enhanced tumor localization and retention of chlorin e6 in cationic nanolipoplexes potentiate the tumor ablation effects of photodynamic therapy. Nanotechnology. 2011;22(36):365101. | |
Cunderlikova B, Gangeskar L, Moan J. Acid-base properties of chlorin e6: relation to cellular uptake. J Photochem Photobiol B. 1999;53(1–3):81–90. | |
Sharma M, Dube A, Bansal H, Kumar Gupta P. Effect of pH on uptake and photodynamic action of chlorin p6 on human colon and breast adenocarcinoma cell lines. Photochem Photobiol Sci. 2004;3(2):231–235. | |
Horibe S, Nagai J, Yumoto R, Tawa R, Takano M. Accumulation and photodynamic activity of chlorin e6 in cisplatin-resistant human lung cancer cells. J Pharm Sci. 2011;100(7):3010–3017. | |
Spikes JD. Chlorins as photosensitizers in biology and medicine. J Photochem Photobiol B. 1990;6(3):259–274. | |
Sies H. Glutathione and its role in cellular functions. Free Radic Biol Med. 1999;27(9–10):916–921. | |
Dickinson DA, Forman HJ. Cellular glutathione and thiols metabolism. Biochem Pharmacol. 2002;64(5–6):1019–1026. | |
Lu SC. Regulation of hepatic glutathione synthesis: current concepts and controversies. FASEB J. 1999;13(10):1169–1183. | |
Meister A, Anderson ME. Glutathione. Annu Rev Biochem. 1983;52:711–760. | |
Valko M, Leibfritz D, Moncol J, Cronin MT, Mazur M, Telser J. Free radicals and antioxidants in normal physiological functions and human disease. Int J Biochem Cell Biol. 2007;39(1):44–84. | |
Franco R, Cidlowski JA. Apoptosis and glutathione: beyond an antioxidant. Cell Death Differ. 2009;16(10):1303–1314. | |
Keyse SM, Tyrrell RM. Heme oxygenase is the major 32-kDa stress protein induced in human skin fibroblasts by UVA radiation, hydrogen peroxide, and sodium arsenite. Proc Natl Acad Sci U S A. 1989;86(1):99–103. | |
Kongpetch S, Kukongviriyapan V, Prawan A, Senggunprai L, Kukongviriyapan U, Buranrat B. Crucial role of heme oxygenase-1 on the sensitivity of cholangiocarcinoma cells to chemotherapeutic agents. PLoS One. 2012;7(4):e34994. | |
Lee HG, Li MH, Joung EJ, Na HK, Cha YN, Surh YJ. Nrf2-Mediated heme oxygenase-1 upregulation as adaptive survival response to glucose deprivation-induced apoptosis in HepG2 cells. Antioxid Redox Signal. 2010;13(11):1639–1648. | |
Furfaro AL, Macay JR, Marengo B, et al. Resistance of neuroblastoma GI-ME-N cell line to glutathione depletion involves Nrf2 and heme oxygenase-1. Free Radic Biol Med. 2012;52(2):488–496. | |
Lee HM, Jeong YI, Kim DH, et al. Ursodeoxycholic acid-conjugated chitosan for photodynamic treatment of HuCC-T1 human cholangiocarcinoma cells. Int J Pharm. 2013;454(1):74–81. | |
Mosmann T. Rapid colorimetric assay for cellular growth and survival: application to proliferation and cytotoxicity assays. J Immunol Methods. 1983;65(1–2):55–63. | |
Heo HY, Park JM, Kim CH, Han BS, Kim KS, Seol W. LRRK2 enhances oxidative stress-induced neurotoxicity via its kinase activity. Exp Cell Res. 2010;316(4):649–656. | |
Lu SC. Regulation of glutathione synthesis. Mol Aspects Med. 2009;30(1–2):42–59. | |
Ogawa K, Hatano-Iwasaki A, Yanagida M, Iwabuchi M. Level of glutathione is regulated by ATP-dependent ligation of glutamate and cysteine through photosynthesis in Arabidopsis thaliana: mechanism of strong interaction of light intensity with flowering. Plant Cell Physiol. 2004;45(1):1–8. | |
Kimani SG, Phillips JB, Bruce JI, MacRobert AJ, Golding JP. Antioxidant inhibitors potentiate the cytotoxicity of photodynamic therapy. Photochem Photobiol. 2012;88(1):175–187. | |
Chen Q, Li W, Wan Y, et al. Amplified in breast cancer 1 enhances human cholangiocarcinoma growth and chemoresistance by simultaneous activation of Akt and Nrf2 pathways. Hepatology. 2012;55(6):1820–1829. | |
Shen D, Dalton TP, Nebert DW, Shertzer HG. Glutathione redox state regulates mitochondrial reactive oxygen production. J Biol Chem. 2005;280(27):25305–25312. | |
Lubos E, Loscalzo J, Handy DE. Glutathione peroxidase-1 in health and disease: from molecular mechanisms to therapeutic opportunities. Antioxid Redox Signal. 2011;15(7):1957–1997. | |
Mohazzab-HKM, Agarwal R, Wolin MS. Influence of glutathione peroxidase on coronary artery responses to alterations in PO2 and H2O2. Am J Physiol. 1999;276(1 Pt 2):H235–H241. | |
Franco JL, Posser T, Dunkley PR, et al. Methylmercury neurotoxicity is associated with inhibition of the antioxidant enzyme glutathione peroxidase. Free Radic Biol Med. 2009;47(4):449–457. | |
Tajima M, Kurashima Y, Sugiyama K, Ogura T, Sakagami H. The redox state of glutathione regulates the hypoxic induction of HIF-1. Eur J Pharmacol. 2009;606(1–3):45–49. | |
Frank J, Lornejad-Schafer MR, Schöffl H, Flaccus A, Lambert C, Biesalski HK. Inhibition of heme oxygenase-1 increases responsiveness of melanoma cells to ALA-based photodynamic therapy. Int J Oncol. 2007;31(6):1539–1545. | |
Kim CH, Chung CW, Lee HM, et al. Synergistic effects of 5-aminolevulinic acid based photodynamic therapy and celecoxib via oxidative stress in human cholangiocarcinoma cells. Int J Nanomedicine. 2013;8:2173–2186. | |
Maines MD. Heme oxygenase: function, multiplicity, regulatory mechanisms, and clinical applications. FASEB J. 1988;2(10):2557–2568. | |
Kessel D, Luo Y, Deng Y, Chang CK. The role of localization in initiation of apoptosis by photodynamic therapy. Photochem Photobiol. 1997;65(3):422–426. | |
Noodt BB, Berg K, Stokke T, Peng Q, Nesland JM. Different apoptotic pathways are induced from various intracellular sites by tetraphenylporphyrins and light. Br J Cancer. 1999;79(1):72–81. | |
Kessel D, Luguya R, Vicente MG. Localization and photodynamic efficacy of two cationic porphyrins varying in charge distributions. Photochem Photobiol. 2003;78(5):431–435. | |
Oleinick NL, Morris RL, Belichenko I. The role of apoptosis in response to photodynamic therapy: what, where, why, and how. Photochem Photobiol Sci. 2002;1(1):1–21. | |
Moan J, Berg K. The photodegradation of porphyrins in cells can be used to estimate the lifetime of singlet oxygen. Photochem Photobiol. 1991;53(4):549–553. |
 © 2014 The Author(s). This work is published and licensed by Dove Medical Press Limited. The
full terms of this license are available at https://www.dovepress.com/terms
and incorporate the Creative Commons Attribution
- Non Commercial (unported, 3.0) License.
By accessing the work you hereby accept the Terms. Non-commercial uses of the work are permitted
without any further permission from Dove Medical Press Limited, provided the work is properly
attributed. For permission for commercial use of this work, please see paragraphs 4.2 and 5 of our Terms.
© 2014 The Author(s). This work is published and licensed by Dove Medical Press Limited. The
full terms of this license are available at https://www.dovepress.com/terms
and incorporate the Creative Commons Attribution
- Non Commercial (unported, 3.0) License.
By accessing the work you hereby accept the Terms. Non-commercial uses of the work are permitted
without any further permission from Dove Medical Press Limited, provided the work is properly
attributed. For permission for commercial use of this work, please see paragraphs 4.2 and 5 of our Terms.