Back to Journals » Diabetes, Metabolic Syndrome and Obesity » Volume 16
Deep Sea Water Inhibited Pancreatic β-Cell Apoptosis and Regulated Glucose Homeostasis by Affecting Lipid Metabolism in Db/Db Mice
Authors Shi M ![]() , Hu B, Hong Y, Wang M
, Hu B, Hong Y, Wang M ![]() , Yao Y
, Yao Y
Received 27 October 2022
Accepted for publication 17 December 2022
Published 27 January 2023 Volume 2023:16 Pages 245—258
DOI https://doi.org/10.2147/DMSO.S395053
Checked for plagiarism Yes
Review by Single anonymous peer review
Peer reviewer comments 2
Editor who approved publication: Prof. Dr. Juei-Tang Cheng
Mengxia Shi,1 Bin Hu,1 Yu Hong,1 Meng Wang,1,* Ying Yao1,2,*
1Department of Nephrology, Tongji Hospital, Tongji Medical College, Huazhong University of Science and Technology, Wuhan, People’s Republic of China; 2Department of Nutrition, Tongji Hospital, Tongji Medical College, Huazhong University of Science and Technology, Wuhan, People’s Republic of China
*These authors contributed equally to this work
Correspondence: Ying Yao, Department of Nephrology and Department of Nutrition, Tongji Hospital, Tongji Medical College, Huazhong University of Science and Technology, No. 1095, Jiefang Avenue, Wuhan, People’s Republic of China, Tel +86-13720379867, Email [email protected] Meng Wang, Department of Nephrology, Tongji Hospital, Tongji Medical College, Huazhong University of Science and Technology, No. 1095, Jiefang Avenue, Wuhan, People’s Republic of China, Tel +86-15927407065, Email [email protected]
Purpose: Deep sea water (DSW) is a natural resource rich in minerals, which participates in biological processes such as energy metabolism, regulates serum glucose and lipids levels, and has a certain protective effect on endocrine and metabolism-related diseases. Studies have shown that the improvement of glucose tolerance in diabetic mice by DSW may be associated with the protective effect on the structure and function of pancreatic islets, and the specific mechanism is still unclear. Other studies have shown that long-term exposure to high concentrations of fatty acids can lead to apoptosis and dysfunction of pancreatic β-cell, increasing the risk of type 2 diabetes mellitus (T2DM). Down-regulation of plasma fatty acid levels may reduce pancreatic β-cell dysfunction, thereby improving glucose homeostasis. Understanding the specific mechanism of DSW regulating blood glucose is of great significance for its clinical application.
Methods: In the present study we used db/db mice as a T2DM model and treated mice with deep ocean mineral concentration (DOMC, a commercial product of DSW) for 4 and 12 weeks. Basic information, serum biochemical indicators, and pathological tissues were gathered for exploration.
Results: The db/db mice treated with 4 weeks’ DOMC (db/db+DOMC) showed decreased plasma cholesterol and triglyceride levels. Tests implied that in adipose tissues, the db/db+DOMC group’s lipolysis process was inhibited, and the β-fatty acid oxidation process was promoted. Besides, DOMC reduced lipogenesis and encouraged β-oxidation in the liver, as a result, improved fatty liver in db/db mice. Further measurements showed DOMC improved glucose homeostasis slightly in db/db animals after a 12-week treatment by preventing pancreatic β-cell apoptosis.
Conclusion: DOMC inhibited pancreatic β-cell apoptosis and regulated glucose homeostasis in db/db mice by lowering the lipid levels via regulation of fatty acid β-oxidation, lipolysis, and lipogenesis processes.
Keywords: deep sea water, type 2 diabetes mellitus, lipid metabolism, glucose homeostasis, pancreatic β-cell apoptosis
Introduction
Diabetes mellitus (DM) is characterized as hyperglycemia caused by defects in insulin secretion and/or insulin function.1 According to a recent article, 463 million individuals globally have DM in 2019. Without prompt or adequate clinical intervention, 578 million people would have DM by 2030, and this number will rise by 51% (to 700 million) by 2045.2 Chronic hyperglycemia in DM patients leads to multiorgan dysfunction, and as a result, adds financial burden to a family and country. Thus, the exploration of the specific mechanism participating in DM is important for glucose hemostasis improvement and clinical therapy. In clinic, the cases of DM can be divided into two broad etiopathogenetic categories, type 1 and type 2 DM (T2DM). T2DM accounts for 90–95% of people with DM and includes people with insulin resistance and usually with relative insulin deficiency.1 Research shows that pancreatic β-cell dysfunction and apoptosis increase the risk of T2DM,3 and one of the major factors leading to pancreatic β-cell dysfunction and apoptosis is chronic exposure to a high concentration of fatty acids.4 Plasma fatty acid downregulation may reduce pancreatic β-cell dysfunction and, as a result, improve glucose homeostasis in T2DM patients and delay the progression.
Deep sea water (DSW) comes from the ocean at depths below 600 meters and is rich in minerals including magnesium(Mg), calcium (Ca), potassium, zinc, vanadium, and so on.5 Studies show that DSW application attenuates hyperlipidemia in high-fat diet-induced rats6 and mice7 through involvement in lipid metabolism, inhibits inflammation in 2,4-dinitro-chlorobenzene-treated Nc/Nga mice to prevent the development of atopic dermatitis,8 ameliorates arteriosclerosis in spontaneous hypertensive rats via 5’-adenosine monophosphate-activated protein kinase (AMPK) and acetyl-coenzyme A carboxylase (ACC) pathway,9 and slows the progression of menopause-induced osteoporosis in ovariectomized rat through the regulation of osteoblast differentiation.10 It has been suggested that DSW’s effect on physiological functions might be related to the minerals it contains. Exogenous Mg2+ supplementation is beneficial for the treatment of obesity, diabetes, and asthma.11 Animal experiments demonstrated that DSW rich in Mg2+ and Ca2+ regulates glucose homeostasis and hyperglycemia in both type 112 and type 213 diabetic mice by improving the structure and function of pancreatic islets. So far, the precise molecular anti-diabetic mechanism by which DSW controls pancreatic islets is yet unclear. Studies have shown that long-term high concentrations of fatty acids can lead to apoptosis and dysfunction of pancreatic β-cell, increasing the risk of T2DM. Down-regulation of plasma fatty acid levels may reduce pancreatic β-cell dysfunction in T2DM patients, thereby improving glucose homeostasis. Whether the glucose homeostasis improvement by DSW has anything to do with the downregulation of hyperlipidemia is still unknown. For a wide application of DSW in clinical disease, more research is encouraged.
In the present study, we planned to investigate the effect of deep ocean mineral concentrate (DOMC, a product of DSW) on both lipid and glucose metabolism in diabetic mice. We adopted db/db mice, which are created by mutations in the db gene on chromosome 4, as a model of T2DM.14 Age-related declines in pancreatic β-cell numbers have been observed in db/db mice, while the pancreatic α-cell number has been shown to increase.15 As insulin is secreted by pancreatic β-cell and glucagon is secreted by pancreatic α-cell, the change of pancreatic cells in db/db mice leads to hormonal disequilibrium and subsequently abnormal glucose homeostasis and DM.16 We tested the levels of serum lipids and glucose, measured the lipolysis, lipogenesis, and β-oxidation process, and calculated pancreatic cells, thus exploring the concrete effect of DOMC on diabetic db/db mice.
Materials and Methods
Animal Experiment Procedure
Six-week-old male C57BL/KsJ-db/db and C57BL/KsJ-db/m mice were purchased from Changzhou Cavens Experimental Animal Co., LTD. (Changzhou, P.R.C) and left to acclimatize for 10 days before the experimental period. The animal breeding room was specific pathogen-free, with the condition of the controlled temperature, humidity, and light (12-hour light/12-hour dark cycle). The experiments were conducted for 4 and 12 weeks and the mice were divided into three groups: the db/m group (n=7-8, db/m mice had the same BL/KsJ background with db/db mice but had a misty (m) gene mutation, which was used as a healthy group); the db/db group (n=8-14, db/db mice were used as a model of T2DM); the db/db+DOMC group (n=8-14, db/db mice were treated with DOMC from Shenzhen Aquamarine Minerals Technology Co., LTD, Shenzhen, P.R.C, the certificate of analysis of the main mineral composition in DOMC was in the Supplementary Materials). The dosage of Mg2+ was calculated based on the human-recommended daily dose of 400 mg. Mice in the db/db+DOMC group were administrated with DOMC with a dose of Mg2+ 60.67 mg/kg/day by intragastric administration; the db/m group and db/db group mice were treated with an equal volume of deionized water. The mice were euthanized for 4 or 12 weeks. Blood, liver, pancreas, and epididymal adipose tissue samples were collected for further use. All experiments were approved by the Institutional Animal Care and Use Committee of Tongji Medical College, Huazhong University of Science and Technology (IACC Number: 2689), which was conducted following the Guide for the Care and Use of Laboratory Animals (NIH Publication, 8th Edition, 2011), and Animal Research: Reporting of In Vivo Experiments guidelines. All relevant national, institutional, and/or international guidelines for the care and use of animals were adhered to.
Blood Glucose and Intraperitoneal Glucose Tolerance Test (IPGTT)
After fasting for 12 hours at night, the mice were measured for tail venous blood glucose with a blood glucose meter (ACCU-CHEK® Sensor; Roche, Mannheim, Germany). IPGTT was performed the day before the mice were sacrificed: after fasting for 12 hours, the mice were injected intraperitoneally with 20% glucose at a dose of 1 mg per body weight (g). Blood glucose levels from the tail venous were measured at 0 (before intraperitoneal glucose injection), 15, 30, 60, 90, and 120 minutes (min) after injection. The area under the glucose curve (AUC) was calculated by the trapezoidal method ( ).
).
Serum Biomarkers
Plasma glycosylated serum protein (GSP), triglyceride (TG), total cholesterol (TC), low-density lipoprotein cholesterol (LDL), and high-density lipoprotein cholesterol (HDL) were detected by the automatic biochemical analyzer Chemray 800 (Shenzhen Duolai Life Science and Technology Co., LTD., Shenzhen, P.R.C). Plasma adiponectin was measured by a mouse adiponectin ELISA kit (catalog No. KE10044, Proteintech, Wuhan, P.R.C).
Hematoxylin-Eosin (HE) Staining
The pancreas and liver tissues were fixed with 4% paraformaldehyde, embedded in paraffin, and sectioned at 4 μm. Slices were stained by an automatic HE staining machine (Leica, Wetzlar, Germany). The images were taken using an Olympus DP72 digital imaging system (Olympus Corporation, Tokyo, Japan).
Oil Red O Staining
The staining was performed according to the instruction of the oil red O staining kit (Wuhan Baiqian Biological Technology Co., LTD., Wuhan, P.R.C). After being thawed and fixed in the fixative (catalog No. B0003) for 15 minutes, the frozen liver slices were then washed with distilled water. Then the slices were dipped in oil red dye (catalog No. B1006) for 10 min and rinsed with distilled water. The slices were slightly differentiated by 75% alcohol and washed with distilled water. Hematoxylin dye (catalog No. B1001) was used to stain the slices for three to five minutes. The slices were then differentiated using a differentiation solution (catalog No. B1004), and the film was sealed using glycerin gelatin film sealant (catalog No. B1101). Images were taken by a scanner (Pannoramic MIDI, 3DHistech Ltd, Budapest, Hungary).
Immunofluorescence Staining
After dewaxing the pancreatic sections, antigens were retrieved by citric acid buffer (pH 6.0) and incubated with 1% sheep serum (catalog No. WGAR1009-5, Servicebio, Wuhan, P.R.C) for 30 min. Then the slices were incubated with primary antibodies: Anti-insulin Mouse pAb (1:200; catalog No. GB12334, Servicebio, Wuhan, P.R.C), Anti-glucagon Rabbit pAb (1:200; catalog No. GB11097, Servicebio, Wuhan, P.R.C) at 4°C overnight and labeled with secondary antigens (CY3-labeled sheep anti-mouse IgG, FITC-labeled sheep anti-rabbit IgG, catalog No. GB21301 and GB22303, Servicebio, Wuhan, P.R.C). Nuclei were marked with 4’6-diamidino-2-phenylindole (DAPI, catalog No. G1012-10ML, Servicebio, Wuhan, P.R.C). Staining was quantified with six to ten randomly chosen fields on each slide and the data were analyzed using Image-Pro Plus software (Media Cybernetics, Rockville, MD, USA) blindly.
TUNEL Staining
The staining was performed according to the experimental procedures required by the FITC Tunel Cell Apoptosis Detection kit (catalog No. G1501-50T, Servicebio, Wuhan, P.R.C). The pancreatic sections were dewaxed, treated with Proteinase K (catalog No. G1501-4) for 20 minutes at 37 °C, rinsed with PBS (catalog No. G0002), and then coated with Equilibration Buffer (catalog No. G1501-3) for 10 minutes at room temperature. The TdT incubation buffer was mixed according to the proportion of Recombinant TdT enzyme (catalog No. G1501-1): FITC-12-dUTP Labeling Mix (catalog No. G1501-2): Equalization Buffer = 1:5:50. Create a TdT incubation buffer for control purposes without recombinant TdT enzyme by add ddH2O as a checkerboard. After removing the balanced equilibrium buffer from the sections, adding 56ul of TdT incubation buffer, and incubating at 37 °C in the dark for 1 hour, PBS should be used to moisten the tissue sample. The nuclei were labeled with DAPI. Images were taken by a scanner (Pannoramic 250FLASH, 3DHistech Ltd, Budapest, Hungary).
Real-Time Quantitative Polymerase Chain Reaction (RT-qPCR)
Total RNA was isolated from liver and epididymal adipose tissues using Trizol (catalog No. 9109, TaKaRa, Wuhan, P.R.C). cDNA was obtained using the HiScript II Q Select RT SuperMix for qPCR (catalog No. R232-01, Vazyme Biotech Co., Ltd, Wuhan, P.R.C). RT-qPCR was performed using Thermofisher ABI QuantStudio 1 (Applied biological system, Foster City, CA, USA) and ChamQ Universal SYBR qPCR Master Mix (catalog No. Q711, Vazyme Biotech Co., Ltd, P.R.C). The sequences of primers used were listed in Table 1. The gene expression of each sample was analyzed repeatedly and normalized with the reference gene GAPDH. ΔΔCt was used to quantitatively analyze the expression levels of target genes in the samples.
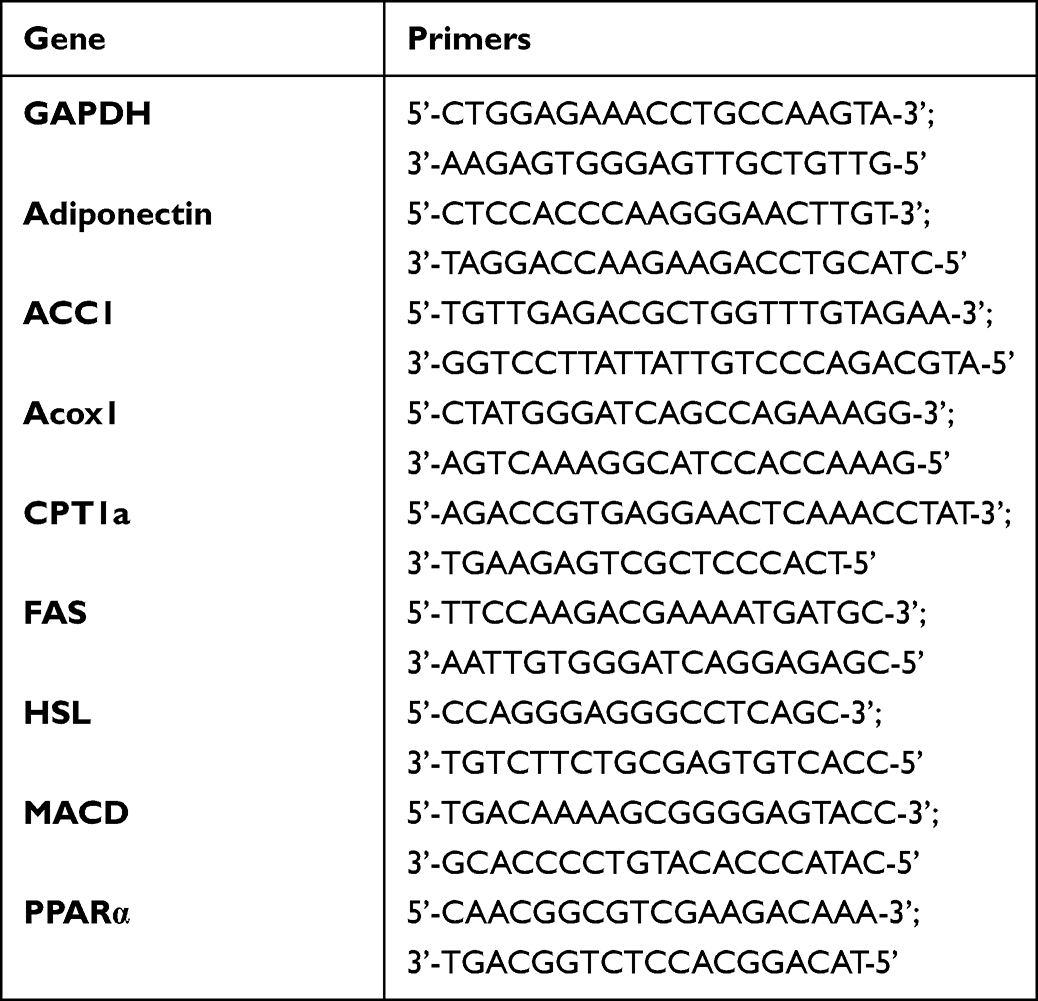 |
Table 1 Primer Sequences |
Western Blotting
The liver protein samples were extracted according to the manufacturer’s instructions (phosphorylation protease inhibitor, PMSF, and protease inhibitor cocktail, catalog No. G2007-1ML, G2008-1ML, and G2006-250UL, Servicebio, Wuhan, P.R.C) and the protein concentration was quantified using the BCA Protein Assay (catalog No. G2026-1000T, Servicebio, Wuhan, P.R.C). Proteins were separated by 10% SDS-PAGE and transferred to PVDF membranes (catalog No. WGPVDF45, Servicebio, Wuhan, P.R.C), the membranes were blocked with 5% non-fat dried milk (catalog No. GC310001-100g, Servicebio, Wuhan, P.R.C). Primary antibodies (PPARα, catalog No.66826-1-Ig; Proteintech, Wuhan, P.R.C; GAPDH, catalog No.60004-1-Ig; Proteintech, Wuhan, P.R.C) were treated with the membranes at 4°C overnight. The membranes were incubated for 1 hour at room temperature with an HRP-conjugated secondary antibody (anti-mouse IgG, catalog No. G1214-100UL, Servicebio, Wuhan, P.R.C). The gray values of the target protein bands were analyzed using Image J software (NIH, Bethesda, MD, USA).
Data Analysis
Data were presented as mean ± standard deviation. Significant differences between groups were analyzed by one-way analysis of variance (ANOVA) multiple comparison tests and basic information comparisons were calculated by Student’s t-test using GraphPad Prism 8.4.3.
Results
Basic Information on Experimental Mice
Over the course of a 4-week investigation, the diabetic mice in db/db (43.09 ± 3.95g) and db/db+DOMC (40.96 ± 3.75g) groups gained considerably more weight than mice in the db/m group (27.74 ± 1.49g). However, there was no statistical distinction between the db/db and db/db+DOMC groups. The liver weight of mice in the three groups showed a similar trend as the body weight. Although mice in the db/db+DOMC group had rather lighter livers (59.36 ± 4.30g) than mice in the db/db group (64.75 ± 8.38g), there was still no statistical difference. Besides, the db/db mice in both db/db group and db/db+DOMC group have lower weights of the spleen, left kidney, and right kidney than db/m mice (Table 2).
 |
Table 2 Basic Information on Experimental Mice |
DOMC Reduced Plasma Lipids by Regulation of Lipolysis and β-Oxidation
As db/db mice are commonly adopted as obesity and T2DM models, we tested the level of plasma lipids at first. Results revealed that the TC and TG concentrations of mice in the db/db group were higher than mice in the db/m group. With the administration of DOMC, mice in the db/db+DOMC owned lower TC and TG concentrations than mice in the db/db group (Figure 1A). Plasma LDL and HDL level measurements showed there was no significant difference among the db/m, db/db, and db/db+DOMC groups. Secondly, we evaluated the expressions of molecules associated with lipid metabolism in adipose tissue. Hormone-sensitive lipase (HSL) is a rate-limiting enzyme that primarily takes part in the lipolysis process and is involved in the decomposition of TG into free fatty acids. RT-qPCR analysis showed the mRNA level of HSL in the db/db group increased in comparison to the group of healthy mice (the db/m group). DOMC intervention (the db/db+DOMC group) reduced the expression of HSL in db/db mice. Key molecules and enzymes involved in fatty acid β-oxidation in adipose tissue include peroxisome proliferator-activated receptor alpha (PPARα), carnitine palmitoyltransferase1a (CPT1a), medium-chain acyl-CoA dehydrogenase (MACD), and acyl-coenzyme A oxidase 1 (Acox1). RT-qPCR analysis revealed that the expressions of PPARα and Acox1 decreased in the db/db group when compared to the db/m group. DOMC administration upregulated the expressions of PPARα, CPT1a, MACD, and Acox1 in the db/db+DOMC group, replying that DOMC treatment promoted fatty acid β-oxidation (Figure 1B). Adiponectin, an insulin-sensitizing hormone secreted by adipose tissue and involved in both lipid and glucose metabolism, was also measured. Results presented that both the plasma concentration and gene mRNA of adiponectin were lower in the db/db group than in the db/m group, and DOMC treatment enhanced the adiponectin expression in the db/db+DOMC group, implying a possible effect of DOMC on both lipid and glucose metabolism (Figure 1C).
 |
Figure 1 DOMC reduced plasma lipids by regulation of lipolysis and β-oxidation. (A) Plasma TG, TC, LDL, and HDL measurements after a 4-week experiment. (B) RT-qPCR analysis for detection of lipolysis and fatty acid β-oxidation associated gene PPARα, CPT1a, MACD, and Acox1 on epididymal adipose tissue. (C) Plasma adiponectin and gene expression of adiponectin on epididymal adipose tissue. The data were presented as means ± SD; n=6-10/group. *p<0.05, **p<0.005, ***p<0.001, ****p<0.0001. Abbreviation: ns, no significant difference. |
DOMC Ameliorated Fatty Liver by Regulation of Lipogenesis and β-Oxidation
Next, we detected the pathological alteration of the liver, an organ taking participated in both lipid and glucose metabolism. HE staining showed that healthy mice (db/m) had less lipid deposition and presented no steatosis in the liver, while mice in the db/db group had macro-vesicular steatosis, and mice in the db/db+DOMC group had micro-vesicular steatosis. Oil red O staining revealed a similar phenomenon that the ratio of lipid area to the total area in the db/db group increased significantly when compared to the db/m group, and in the db/db+DOMC group the ratio decreased (Figure 2A). Both the HE staining and oil red O staining imply that DOMC ameliorated liver fat deposits in db/db mice. RT-qPCR analysis showed that the mRNA expressions of PPARα, CPT1a, MACD, and Acox1 in liver tissue were lower in the db/db group than in the db/m group, whereas the expressions were increased in the db/db+DOMC group. Western blot analysis showed the expression of PPARα decreased in the db/db group compared to the db/m group and increased with DOMC administration in the db/db+DOMC group (Figure 2B). These results suggested that DOMC promoted fatty acid β-oxidation and reduced hepatic lipid deposition. Fatty acid synthase (FAS) and acetyl-coenzyme A carboxylase alpha (ACC1) are two enzymes involved in lipid synthesis in the liver. Gene mRNA measurement exhibited that their expressions were low in the db/m group and high in the db/db group, and in the db/db+DOMC group, their expressions were downregulated (Figure 2C), suggesting that the liver’s synthesis of lipids was attenuated by DOMC too. The results above evinced that DOMC improved liver steatosis by ameliorating lipogenesis and promoting β-oxidation.
 |
Figure 2 DOMC ameliorated fatty liver by reduction of lipogenesis and β-oxidation. (A) HE and Oil red O staining of the liver to evaluate liver steatosis. (B) a. RT-qPCR analysis of fatty acid β-oxidation in the liver. b. Western blot to test PPAPα at the protein level. (C) lipogenesis-associated genes in the liver. The data were presented as means ± SD; n=6-10/group. *p<0.05, **p<0.005, ***p<0.001, ****p<0.0001. Scale bar: 50 μm. Abbreviation: ns, no significant difference. |
DOMC Regulated Glucose Homeostasis in Db/Db Mice
Further, we explored the effect of DOMC on glucose metabolism. The plasma glucose level in db/db mice nearly doubled when compared to normal mice (db/m mice in the db/m group). There was no significant difference between the db/db and db/db+DOMC groups. The GSP level of db/db mice in the db/db group increased too, and its expression decreased slightly in the db/db+DOMC group, replying that DOMC had a weak protective effect on glucose regulation in diabetic mice (Figure 3A). IPGTT presented the same phenomenon, the glucose level was significantly increased in db/db mice when in contrast with db/m mice, but the glucose levels between the db/db and db/db+DOMC groups showed no discernible difference. AUC data suggested that DOMC slightly improved glucose homeostasis of db/db mice with a 4-week treatment (Figure 3B). HE staining revealed that in the db/db and db/db+DOMC groups some pancreatic islet cells experienced vacuolar degeneration, while in the db/m group the cells were plump and full of cytoplasmic contents. There was no difference in the mouse pancreatic islet area among these three groups (Data not shown) (Figure 3C). Next, we measured both the pancreatic β- and α-cells, the main constituents of islets. As insulin is produced by islet β-cell and glucagon is produced by islet α-cells, we selected insulin and glucagon respectively as the markers of islet β- and α-cells. Immunofluorescence staining showed there were massive insulin-positive islet β-cells and only a few glucagon-positive α-cells in the db/m group. In the db/db and db/db+DOMC groups, the number of insulin-positive cells decreased slightly and the number of glucagon-positive cells increased relatively. There was no difference in the number of β- and α-cells between the db/db and db/db+DOMC groups (Figure 3D). We observed a weak protective effect of DOMC on glucose homeostasis, and the short-term application had probable no appreciable effect on pancreatic cells.
 |
Figure 3 DOMC regulated glucose homeostasis in db/db mice. (A) The test of fasting blood glucose levels and GSP. (B) IPGTT after a 4-week experiment. (C) HE staining of the pancreas: green arrows implied the vacuolar degeneration of pancreatic islet cells. (D) Immunofluorescence co-staining of the pancreas. Each section was stained for insulin, glucagon (green) and DAPI (blue). Insulin and glucagon-positive cells were counted per visual field. The data were presented as means ± SD; n=6-10/group. *p<0.05, **p<0.005, ***p<0.001, ****p<0.0001. Scale bar: 50 μm. Abbreviation: ns, no significant difference. |
DOMC Protected Pancreatic β-Cell by a Long-Term Application
In the next step, we extended DOMC intervention to 12 weeks. The fasting blood glucose monitor showed the db/db mice presented extremely higher glucose levels than db/m mice, while there was no difference between the db/db group and db/db+DOMC group. Interestingly, the AUC of IPGTT in the db/db+DOMC group was lower than that in the db/db group, suggesting a 12-week DOMC intervention might improve murine blood glucose in diabetic mice (Figure 4A). HE staining showed that the pancreatic islet area of mice in the db/db group decreased significantly when compared to the db/m group, in the db/db+DOMC group the area increased (Data not shown). Besides, the phenomenon of vacuolar degeneration in db/db mice was alleviated with the administration of DOMC (Figure 4B). Insulin and glucagon co-staining showed that the ratio of insulin-positive β-cells to total islet cells in the db/db group decreased when compared to the db/m group. On the contrary, the ratio of glucagon-positive α-cell to total islet cells increased. With the administration of DOMC, the ratio of insulin-positive β-cells to total islet cells increased (p<0.005), and the α-cell/β-cell ratio decreased significantly, too (p<0.005) (Figure 4C). DOMC enhanced the number of pancreatic β-cell in db/db mice after a prolonged application and played a protective effect on glucose homeostasis in db/db mice.
 |
Figure 4 DOMC protected pancreatic β-cell by a long-term application. (A) The measurement of fasting blood glucose levels and AUC of IPGTT after a 12-week experiment. (B) HE staining of the pancreas. (C) Immunofluorescence of insulin and glucagon co-staining. The data were presented as means ± SD; n=8-14/group. *p<0.05, **p<0.005, ***p<0.001, ****p<0.0001. Scale bar: 50 μm. |
DOMC Alleviated Pancreatic β-Cell Apoptosis
To explore the detailed mechanism of DOMC protecting pancreatic β-cell in db/db mice, we tested the cell apoptosis by TUNEL staining. In the db/m group, there were no TUNEL-positive apoptotic cells, while in the db/db and db/db+DOMC groups there were a few TUNEL-positive apoptotic cells after a 4-week experiment (Figure 5A). In a 12-week experiment, we observed obviously increased TUNEL-positive cells in the db/db group, and prolonged DOMC application duration inhibited the apoptosis of pancreatic β-cell in the db/db+DOMC group (Figure 5B).
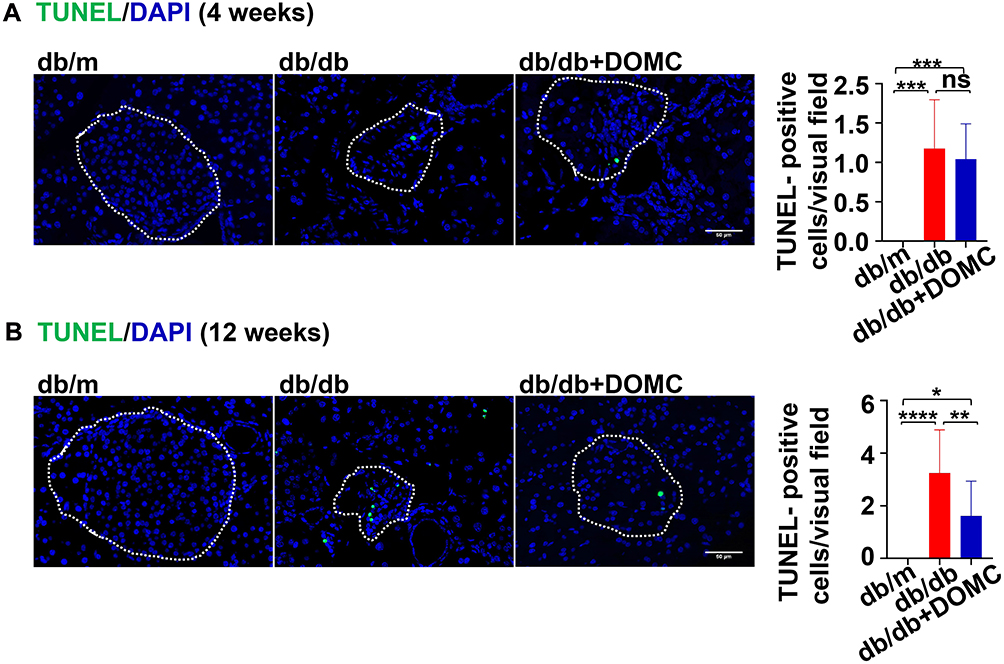 |
Figure 5 DOMC alleviated pancreatic β-cell apoptosis. (A) TUNEL staining of the pancreas slices after a 4-week experiment. (B) TUNEL staining of the pancreas slices after a 12-week experiment. White dotted boxes were depicted as pancreas islets, the number of TUNEL-positive cells was counted as green fluorescence cells in the boxes. The data were presented as means ± SD; n=6-14/group. *p<0.05, **p<0.005, ****p<0.0001. Scale bar: 50 μm. Abbreviation: ns, no significant difference. |
Discussion
T2DM is characterized by insulin resistance and progressive β-cell dysfunction, which leads to chronic hyperglycemia and a variety of diabetic complications including cardiovascular disease, peripheral arterial disease, nephropathy, neuropathy, and retinopathy.17 As the earliest observable anomaly used to predict T2DM, insulin resistance has an important influence in the development of T2DM.18 Plenty of previous research focused on the specific mechanisms of insulin resistance affecting T2DM, thus, finding a way to improve insulin resistance and glucose homeostasis in T2DM animals and patients. Studies concentrated on pancreatic β-cell dysfunction play an important role in diabetic exploration too. It’s reported that the pathological mechanisms that participated in β-cell dysfunction include incretin (glucagon-like peptide 1 and gastric inhibitory polypeptide) deficiency,19 excess fatty acids,4 glucotoxicity,20 amyloid deposition in the islets,21 and oxidative stress,22 among which excess fatty acids and consequent lipotoxicity are particularly important. According to the research, long-term exposure to excess fatty acids can trigger the synthesis of toxic derivatives including diacylglycerol, TG, ceramides, and reactive oxygen species. These derivatives lead to many unfavorable processes, including endoplasmic reticulum stress, mitochondrial dysfunction, and autophagy insufficiency, and as a result aggravate the apoptosis and dysfunction of pancreatic β-cell and ultimately result in the onset and progression of T2DM.23
DSW is well known for its abundance of various mineral elements. It’s reported that DSW participates in lipid metabolism and improves hyperlipidemia. According to a clinical study, DSW decreases serum TC and LDL via the reduction of lipid peroxidation.24 Other studies demonstrated that DSW leads to weight loss and alleviates liver steatosis in high-fat diet-induced obese C57BL/6J mice by regulating the gene expression of lipogenic, lipolytic, proinflammatory, and β-oxidation-associated cytokines, as well as adipokines.7 An in vitro investigation suggests that DSW down-regulates the expression of adipogenic transcription factors and adipocyte-specific genes, which in turn reduces lipid accumulation in 3T3-L1 adipocytes.25 Data associated with the specific mechanism of DSW participating in the lipid metabolism process helps expand the clinical application of DSW. PPARα is a ligand-activated nuclear receptor that forms heterodimers with retinoid X receptors. It’s widely recognized for its transcriptional regulation of fatty acid metabolism.26 Studies report that PPARα up-regulates the expression of genes involved in cellular fatty acid uptake, transport, and β-oxidation processes.27 PPARα gene depletion in the PPARα null mice leads to lower mitochondrial fatty acid metabolizing enzymes and abnormal hepatic lipid accumulation.28,29 CPT1, one of the variables controlled by PPARα, plays a key role in the post- transcriptional regulation of fatty acid β-oxidation. PPARα reduces the activity of its chemical inhibitor malonyl-CoA, thus boosts the production of CPT1, which in turn encourages the oxidation of fatty acids and lowers the fatty acid level.26 Acox1 is an enzyme participating in the first and rate-limiting step of the fatty acid β-oxidation process and is dedicated to catalyzing straight-chain fatty acids in the peroxisome. Inhibition of its expression attenuates the fatty acid β-oxidation process and results in microvesicular steatohepatitis.30 HSL is a pivotal enzyme involved in basal and stimulated lipolysis. In obese patients, enlarged adipocytes usually represent increased HSL activity, accelerated lipolysis process, and as a result a detrimental fat deposit. Besides, there are other enzymes associated with lipid metabolism, for example, FAS and ACC1, two rate-limiting enzymes stored in the liver. Upregulating the expression of FAS and ACC1 promotes lipogenesis and exacerbates hepatic steatosis.31 In the present study, we observed the protective effect of DOMC on hyperlipidemia in db/db mice. We measured the expression of β-oxidation, lipolysis, and lipogenesis associated enzymes and genes in the adipose and liver. Compared to the db/m mice, the expressions of lipolysis and β-oxidation process related factors in the db/db mice decreased significantly, and DOMC application increased their expressions slightly. Lipogenesis-associated factors increased in the db/db group and decreased in the db/db+DOMC group. The results implied that DOMC reduced lipid levels by regulation of lipolysis, β-oxidation, and lipogenesis process.
Adiponectin is a major insulin-sensitizing adipokine modulating both glucose metabolism and fatty acid oxidation.32 Results presented a positive effect of DOMC on adiponectin expression and further on glucose homeostasis. As reported that lipid toxicity accelerates the apoptosis of pancreatic β-cell and leads to the loss of pancreatic mass and function and T2DM progression,23,33,34 we further explored the relationship among DOMC, lipid metabolism and glucose metabolism. We measured pancreatic β-cell, however, pathological staining showed no difference in pancreatic islet β-cell between the db/db and db/db+DOMC groups with a 4-week administration of DOMC. After extending the application duration, the area of pancreatic area and the number of pancreatic β-cell showed an obvious enhancement, as well as glucose homeostasis. DOMC treatment inhibited the apoptosis of pancreatic islet β-cell, postponed pancreatic shrinkage, and had a protective effect on glucose homeostasis in db/db mice. We considered that the improvement of DOMC on glucose homeostasis might have something to do with its regulation of lipid metabolism. However, there were some limitations. First, the data on glucose levels was inconsistence with the IPGTT results. Although IPGTT implied improved glucose tolerance in the db/db+DOMC group, there was no significant difference in glucose level between the db/db and db/db+DOMC group after 4 weeks’ and 12 weeks’ experiments. The similar glucose levels in the two groups might be attributed to uncontrollable diet, stress, for its high sensitivity to the environment, hormones and so on. Second, we observed shrunk pancreatic islet area in db/db mice, and with DOMC administration, the area increased. However, we focused on the apoptosis of pancreatic islet β-cell rather than the proliferation. Third, more experiments need be done to research the relationship among DOMC, lipid metabolism and glucose homeostasis, including the specific mechanism of DOMC related lipid metabolism to glucose homeostasis. Otherwise, further research is needed to explore the specific effect of DOMC on clinical anti-diabetic therapy.
Conclusions
In the present study, we demonstrated that DOMC reduced the level of plasma lipids and improved hepatic steatosis by regulation of lipolysis, lipogenesis, and fatty acid β-oxidation process, thus playing a protective role in pancreatic islet β-cell and glucose homeostasis in db/db mice.
Abbreviations
ACC, acetyl-coenzyme A carboxylase; ACC1, acetyl-coenzyme A carboxylase alpha; Acox1, acyl-coenzyme A oxidase 1; AMPK, 5’-adenosine monophosphate-activated protein kinase; AUC, area under the glucose curve; CPT1, carnitine palmitoyltransferase1; CPT1a, carnitine palmitoyltransferase1a; DSW, deep sea water; DOMC, deep ocean mineral concentrate; DM, diabetes mellitus; FAS, fatty acid synthase; GSP, glycosylated serum protein; HDL, high-density lipoprotein cholesterol; HE staining, hematoxylin-eosin staining; HSL, hormone-sensitive lipase; IPGTT, intraperitoneal glucose tolerance test; LDL, low-density lipoprotein cholesterol; MACD, medium-chain acyl-CoA dehydrogenase; PPARα, peroxisome proliferator-activated receptor alpha; PPARγ, peroxisome proliferator-activated receptor gamma; RT-qPCR, real-time quantitative polymerase chain reaction; TC, total cholesterol; TG, triglyceride; T2DM, type 2 diabetes mellitus.
Acknowledgments
The authors greatly appreciate all individuals involved in this study. We are grateful to Shenzhen Aquamarine Minerals Technology Co., LTD (Shenzhen, P.R.C) for offering deep ocean mineral concentrate.
Author Contributions
All authors made a significant contribution to the work reported, whether that is in the conception, study design, execution, acquisition of data, analysis and interpretation, or in all these areas; took part in drafting, revising or critically reviewing the article; gave final approval of the version to be published; have agreed on the journal to which the article has been submitted; and agree to be accountable for all aspects of the work.
Funding
This work was financially supported by the National Natural Science Foundation of China (Grants 82170701, 81974087, and 81770684) and the Wuhan health and family planning commission (grant 2021080).
Disclosure
All authors report Shenzhen Aquamarine Minerals Technology Co., LTD offered deep ocean mineral concentrate. The authors declared that they have no other conflicts of interest.
References
1. American Diabetes A. Diagnosis and classification of diabetes mellitus. Diabetes Care. 2014;37(Suppl 1):S81–90. doi:10.2337/dc14-S081
2. Saeedi P, Petersohn I, Salpea P, et al. Global and regional diabetes prevalence estimates for 2019 and projections for 2030 and 2045: results from the international diabetes federation diabetes atlas. Diabetes Res Clin Pract. 2019;157:107843. doi:10.1016/j.diabres.2019.107843
3. Taylor SI. Deconstructing type 2 diabetes. Cell. 1999;97(1):9–12. doi:10.1016/s0092-8674(00)80709-6
4. Sramek J, Nemcova-Furstova V, Kovar J. Molecular mechanisms of apoptosis induction and its regulation by fatty acids in pancreatic beta-cells. Int J Mol Sci. 2021;22(8):4285. doi:10.3390/ijms22084285
5. Mohd Nani SZ, Majid FA, Jaafar AB, Mahdzir A, Musa MN. Potential health benefits of deep sea water: a review. Evid Based Complement Alternat Med. 2016;2016:6520475. doi:10.1155/2016/6520475
6. Chang WT, Lu TY, Cheng MC, Lu HC, Wu MF, Hsu CL. Deep sea water improves abnormalities in lipid metabolism through lipolysis and fatty acid oxidation in high-fat diet-induced obese rats. Mar Drugs. 2017;15(12):386. doi:10.3390/md15120386
7. Ha BG, Park JE, Shin EJ, Shon YH. Effects of balanced deep-sea water on adipocyte hypertrophy and liver steatosis in high-fat, diet-induced obese mice. Obesity. 2014;22(7):1669–1678. doi:10.1002/oby.20740
8. Bak JP, Kim YM, Son J, Kim CJ, Kim EH. Application of concentrated deep sea water inhibits the development of atopic dermatitis-like skin lesions in NC/Nga mice. BMC Complement Altern Med. 2012;12:108. doi:10.1186/1472-6882-12-108
9. Sheu MJ, Chou PY, Lin WH, et al. Deep sea water modulates blood pressure and exhibits hypolipidemic effects via the AMPK-ACC pathway: an in vivo study. Mar Drugs. 2013;11(6):2183–2202. doi:10.3390/md11062183
10. Chen PC, Lee YC, Jao HY, et al. Supplementation of nanofiltrated deep ocean water ameliorate the progression of osteoporosis in ovariectomized rat via regulating osteoblast differentiation. J Food Biochem. 2020;44(7):e13236. doi:10.1111/jfbc.13236
11. de Baaij JH, Hoenderop JG, Bindels RJ. Magnesium in man: implications for health and disease. Physiol Rev. 2015;95(1):1–46. doi:10.1152/physrev.00012.2014
12. Ha BG, Park JE, Shin EJ, Shon YH. Modulation of glucose metabolism by balanced deep-sea water ameliorates hyperglycemia and pancreatic function in streptozotocin-induced diabetic mice. PLoS One. 2014;9(7):e102095. doi:10.1371/journal.pone.0102095
13. Ha BG, Shin EJ, Park JE, Shon YH. Anti-diabetic effect of balanced deep-sea water and its mode of action in high-fat diet induced diabetic mice. Mar Drugs. 2013;11(11):4193–4212. doi:10.3390/md11114193
14. Hummel KP, Dickie MM, Coleman DL. Diabetes, a new mutation in the mouse. Science. 1966;153(3740):1127–1128. doi:10.1126/science.153.3740.1127
15. Wang Y, Han C, Zhu W, Wu Z, Liu Y, Chen L. An optical method to evaluate both mass and functional competence of pancreatic alpha- and beta-cells. J Cell Sci. 2016;129(12):2462–2471. doi:10.1242/jcs.184523
16. Macek C. Bihormonal theory of diabetes gets solid backing. JAMA. 1982;247(12):1685. doi:10.1001/jama.1982.03320370007003
17. Forbes JM, Cooper ME. Mechanisms of diabetic complications. Physiol Rev. 2013;93(1):137–188. doi:10.1152/physrev.00045.2011
18. Defronzo RA, Lecture B. From the triumvirate to the ominous octet: a new paradigm for the treatment of type 2 diabetes mellitus. Diabetes. 2009;58(4):773–795. doi:10.2337/db09-9028
19. Madsbad S. The role of glucagon-like peptide-1 impairment in obesity and potential therapeutic implications. Diabetes Obes Metab. 2014;16(1):9–21. doi:10.1111/dom.12119
20. Bensellam M, Laybutt DR, Jonas JC. The molecular mechanisms of pancreatic beta-cell glucotoxicity: recent findings and future research directions. Mol Cell Endocrinol. 2012;364(1–2):1–27. doi:10.1016/j.mce.2012.08.003
21. Ritzel RA, Meier JJ, Lin CY, Veldhuis JD, Butler PC. Human islet amyloid polypeptide oligomers disrupt cell coupling, induce apoptosis, and impair insulin secretion in isolated human islets. Diabetes. 2007;56(1):65–71. doi:10.2337/db06-0734
22. Roma LP, Pascal SM, Duprez J, Jonas JC. Mitochondrial oxidative stress contributes differently to rat pancreatic islet cell apoptosis and insulin secretory defects after prolonged culture in a low non-stimulating glucose concentration. Diabetologia. 2012;55(8):2226–2237. doi:10.1007/s00125-012-2581-6
23. Janikiewicz J, Hanzelka K, Kozinski K, Kolczynska K, Dobrzyn A. Islet beta-cell failure in type 2 diabetes--Within the network of toxic lipids. Biochem Biophys Res Commun. 2015;460(3):491–496. doi:10.1016/j.bbrc.2015.03.153
24. Fu ZY, Yang FL, Hsu HW, Lu YF. Drinking deep seawater decreases serum total and low-density lipoprotein-cholesterol in hypercholesterolemic subjects. J Med Food. 2012;15(6):535–541. doi:10.1089/jmf.2011.2007
25. Hwang HS, Kim SH, Yoo YG, et al. Inhibitory effect of deep-sea water on differentiation of 3T3-L1 adipocytes. Mar Biotechnol. 2009;11(2):161–168. doi:10.1007/s10126-008-9131-8
26. Houten SM, Violante S, Ventura FV, Wanders RJ. The biochemistry and physiology of mitochondrial fatty acid beta-oxidation and its genetic disorders. Annu Rev Physiol. 2016;78:23–44. doi:10.1146/annurev-physiol-021115-105045
27. Wang N, Liu Y, Ma Y, Wen D. High-intensity interval versus moderate-intensity continuous training: superior metabolic benefits in diet-induced obesity mice. Life Sci. 2017;191:122–131. doi:10.1016/j.lfs.2017.08.023
28. Aoyama T, Peters JM, Iritani N, et al. Altered constitutive expression of fatty acid-metabolizing enzymes in mice lacking the peroxisome proliferator-activated receptor alpha (PPARalpha). J Biol Chem. 1998;273(10):5678–5684. doi:10.1074/jbc.273.10.5678
29. Lee SS, Pineau T, Drago J, et al. Targeted disruption of the alpha isoform of the peroxisome proliferator-activated receptor gene in mice results in abolishment of the pleiotropic effects of peroxisome proliferators. Mol Cell Biol. 1995;15(6):3012–3022. doi:10.1128/mcb.15.6.3012
30. Fan CY, Pan J, Chu R, et al. Hepatocellular and hepatic peroxisomal alterations in mice with a disrupted peroxisomal fatty acyl-coenzyme A oxidase gene. J Biol Chem. 1996;271(40):24698–24710. doi:10.1074/jbc.271.40.24698
31. Sampath H, Ntambi JM. Stearoyl-coenzyme A desaturase 1, sterol regulatory element binding protein-1c and peroxisome proliferator-activated receptor-alpha: independent and interactive roles in the regulation of lipid metabolism. Curr Opin Clin Nutr Metab Care. 2006;9(2):84–88. doi:10.1097/01.mco.0000214564.59815.af
32. Fang H, Judd RL. Adiponectin Regulation and Function. Compr Physiol. 2018;8(3):1031–1063. doi:10.1002/cphy.c170046
33. Biden TJ, Boslem E, Chu KY, Sue N. Lipotoxic endoplasmic reticulum stress, beta cell failure, and type 2 diabetes mellitus. Trends Endocrinol Metab. 2014;25(8):389–398. doi:10.1016/j.tem.2014.02.003
34. Vilas-Boas EA, Almeida DC, Roma LP, Ortis F, Carpinelli AR. Lipotoxicity and beta-cell failure in type 2 diabetes: oxidative stress linked to NADPH oxidase and ER stress. Cells. 2021;10(12):3328. doi:10.3390/cells10123328
 © 2023 The Author(s). This work is published and licensed by Dove Medical Press Limited. The
full terms of this license are available at https://www.dovepress.com/terms
and incorporate the Creative Commons Attribution
- Non Commercial (unported, 3.0) License.
By accessing the work you hereby accept the Terms. Non-commercial uses of the work are permitted
without any further permission from Dove Medical Press Limited, provided the work is properly
attributed. For permission for commercial use of this work, please see paragraphs 4.2 and 5 of our Terms.
© 2023 The Author(s). This work is published and licensed by Dove Medical Press Limited. The
full terms of this license are available at https://www.dovepress.com/terms
and incorporate the Creative Commons Attribution
- Non Commercial (unported, 3.0) License.
By accessing the work you hereby accept the Terms. Non-commercial uses of the work are permitted
without any further permission from Dove Medical Press Limited, provided the work is properly
attributed. For permission for commercial use of this work, please see paragraphs 4.2 and 5 of our Terms.