Back to Journals » Diabetes, Metabolic Syndrome and Obesity » Volume 13
Deep Learning-Based Method of Diagnosing Hyperlipidemia and Providing Diagnostic Markers Automatically
Authors Liu Y ![]() , Zhang Q, Zhao G, Liu G, Liu Z
, Zhang Q, Zhao G, Liu G, Liu Z
Received 16 December 2019
Accepted for publication 26 February 2020
Published 11 March 2020 Volume 2020:13 Pages 679—691
DOI https://doi.org/10.2147/DMSO.S242585
Checked for plagiarism Yes
Review by Single anonymous peer review
Peer reviewer comments 2
Editor who approved publication: Prof. Dr. Antonio Brunetti
Yuliang Liu,1,* Quan Zhang,1,* Geng Zhao,2,* Guohua Liu,3,4 Zhiang Liu5
1College of Electronic Information and Automation, Tianjin University of Science and Technology, Tianjin 300222, People’s Republic of China; 2Tianjin Medical University Hospital for Metabolic Disease, Tianjin 300134, People’s Republic of China; 3College of Electronic Information and Optical Engineering, Nankai University, Tianjin 300350, People’s Republic of China; 4Tianjin Key Laboratory of Optoelectronic Sensor and Sensing Network Technology, Nankai University, Tianjin 300350, People’s Republic of China; 5School of Electrical Engineering and Automation, Harbin Institute of Technology, Harbin 150001, People’s Republic of China
*These authors contributed equally to this work
Correspondence: Yuliang Liu; Guohua Liu
Email [email protected]; [email protected]
Introduction: The research of auxiliary diagnosis has always been one of the hotspots in the world. The implementation of auxiliary diagnosis support algorithm for medical text data faces challenges with interpretability and creditability. The improvement of clinical diagnostic techniques means not only the improvement of diagnostic accuracy but also the further study of diagnostic basis. Traditional research methods for diagnostic markers often require a large amount of time and economic costs. Research objects are often dozens of samples, and it is, therefore, difficult to synthesize large amounts of data. Therefore, the comprehensiveness and reliability of traditional methods have yet to be improved. Therefore, the establishment of a model that can automatically diagnose diseases and automatically provide a diagnostic basis at the same time has a positive effect on the improvement of medical diagnostic techniques.
Methods: Here, we established an auxiliary diagnostic tool based on attention deep learning algorithm to diagnostic hyperlipemia and automatically predict the corresponding diagnostic markers using hematological parameters. In this paper, we not only demonstrated the ability of the proposed model to automatically diagnose diseases using text-based medical data, such as physiological parameters, but also demonstrated its ability to forecast disease diagnostic markers. Human physiological parameters are used as input to the model, and the doctor’s diagnosis results as an output. Through the attention layer, the degree of attention of the model to different physiological parameters can be obtained, that is, the model provides a diagnostic basis.
Results: It achieved 94% ACC, 97.48% AUC, 96% sensitivity and 92% specificity with the test dataset. All the above samples are drawn from clinical practice. Moreover, the model predicted the diagnostic markers of hyperlipidemia by the attention mechanism, and the results were fully agreeable to the golden criteria.
Discussion: The auxiliary diagnosis system proposed in this paper not only achieves the accurate and robust performance, and can be used for the preliminary diagnosis of patients, but also showing its great potential to discover new diagnostic markers. Therefore, it not only can improve the efficiency of clinical diagnosis but also shorten the research period of researching a diagnosis basis to an extent. It has a positive significance to the development of the medical diagnosis level.
Keywords: automatic predictive diagnostic markers, automatic diagnosis, attention mechanism, hyperlipemia, artificial intelligence
Introduction
In recent years, with the gradual awakening of global health awareness, human beings have shown an urgent need for further development of the medical level.1–3 Artificial intelligence (AI) has great potential to promote the further development of medical diagnostic technology because of its excellent performance in the field of data processing beyond human experts. Despite it has an excellent performance in the field of automatic diagnosis using medical images, the interpretability and text-based medical data analyzability of AI still faces great challenges.4,5,45
In order to solve the problems above, on the global scale, researchers have gradually integrated deep learning technology with a medical diagnosis. Edward Choi and his colleagues used a recurrent neural network to process electronic health records (EHR) for diagnosing heart failure onset.6 Laila Rasmy et al used recurrent neural networks to predict the risk of heart failure based on a large number of mixed EHR data.7 Sasank Chilamkurthy et al used natural language processing model to recognize non-contrast head CT scan to identify various head diseases, such as intracranial haemorrhages and cranial fractures et al.8 Kang Zhang et al used transfer learning algorithm and Google’s Inception-V3 model to rapidly diagnose many kinds of diseases of eye and children pulmonary diseases.9 Michael A. Schwemmer et al used a deep neural network decoding framework to classify intracortical recording, and then controlled the motor to help patients complete corresponding actions, according to the classification results.10 Although deep learning technology has shown a strong competitive advantage in the field of automatic diagnosis using medical images, it still faces many major challenges, such as processing medical text information. In the actual clinical diagnosis processing, in addition to the diseases that can be diagnosed by medical images, there are many diseases that need to be diagnosed by medical text data, such as hyperlipidemia, diabetes, etc.11,12
In order to realize the purpose of automatically diagnosing diseases using text-based medical data, long-short time memory (LSTM) neural network was proposed.13,14 The physiological parameters obtained in the clinic are usually a vector rather than image data. Sequential data also play an important role in clinical diagnosis. Convolutional neural network (CNN) is more suitable for processing image data because of its translation invariance. Because of the need to learn the interrelationship between different physiological parameters, LSTM is a good choice when processing sequence data.
LSTM mentioned above relying on memory cells to learn long-range dependence information. As we know, each human physiological parameter is not independent, they are interrelated, and this relationship is difficult to be found by simple coding or logistic regression algorithm. Therefore, we need a deep learning model that can learn the relationship better of far apart data to complete the task of processing text-based medical data. Simply, the LSTM neural network takes the original text-based medical data as input, and then use many special neurons to extract the joint features automatically from the original data, and finally use the classification function to classify the samples automatically to achieve the purpose of automatic diagnosis of diseases. This architecture makes it possible to process medical text data which have complex internal relationships, deep learning technology has been widely used in various fields.15,16
The deep learning technology-based text data classification method replaces the mathematical distance-based traditional clustering method, which greatly improves the performance of the model in processing text data. The key elements of traditional automatic diagnosis method using medical text data are: (1) patient description pathological characteristics, (2) researchers extract features manually based on patient descriptions or patient’s EHR, (3) the extracted features are encoded according to the requirements, (4) classification algorithm is used to classify the coded physiological features.17 The traditional automatic diagnosis method needs to extract features manually, and the quality of extracted feature vectors is greatly affected by the researcher’s clinical experience and professional level, so it has uncertainty. At the same time, the traditional method will lose some original information artificially in the process of feature extraction, which may lose some joint features of physiological parameters, so the traditional method also has a degree of one-sidedness. Although it is not only the pathological features described by patients, EHR are also widely used in the research of automatic diagnosis. But there is no objective and unified standard to evaluate the quality of EHR. This is one of the important factors that limit the performance of automatic diagnosis algorithms using EHR.18,20 Deep learning algorithm has the ability of feature extraction automatically, so it overcomes the one-sidedness caused by manual feature extraction, saves labor resources and improves the efficiency and accuracy of automatic diagnosis.20–22
Another challenge in applying deep learning algorithms to auxiliary diagnosis is the interpretability. Up to now, the deep learning model is still a black-box model, which cannot explain exactly which kind of physiological parameters plays a vital role in the process of data processing. The development of disease diagnosis technology depends not only on the improvement of diagnostic accuracy but also on the discovery of more effective diagnostic markers and the relationship between different physiological parameters (diseases). It is difficult to meet the requirements above by the auxiliary diagnosis system which only gives the diagnosis results. As we know, the human brain tends to have an attention focus when processing things, and it is able to find out important features purposefully according to the environment, this mechanism is called the attention mechanism. The combination of attention mechanism and deep learning model can imitate the functions of the human brain mentioned above, which has been proved to have the ability to focus on important features and has been applied in many fields such as image recognition and semantic recognition.23–25 Therefore, in order to solve the above problems, this paper not only studies the automatic diagnosis of diseases with human physiological parameters, but also applies the attention mechanism to the auxiliary diagnosis model. This method gives the importance of different physiological parameters for disease diagnosis while automatically diagnosing diseases, enhances the interpretability of the model, and further enhances the assistant ability of the auxiliary diagnosis system for clinical research. This algorithm is called attention deep learning.
The advancement of medical diagnostic techniques should not rely solely on the improvement of diagnostic accuracy, but should also rely on the study of diagnostic markers or diagnostic basis that are more effective. Therefore, research on the prediction of diagnostic markers is of great significance. The traditional method of studying diagnostic markers is often to collect dozens of sample data, and to predict the diagnostic markers according to the regression model, it is difficult to synthesize large quantities of samples. The above situation has caused the traditional research methods to have certain blindness and subjectivity. In order to solve the above series of problems, an auxiliary diagnostic system that can automatically provide disease markers while automatically diagnosing diseases is of positive significance for the development of medical level.
Hyperlipidemia refers to the excessive level of blood lipids, which can directly cause some diseases that seriously endanger human health, such as coronary heart disease, atherosclerosis and so on. However, due to the absence of obvious symptoms and abnormal signs, the diseases mentioned above have strong concealment and are difficult to be detected purposefully. At the same time, with the continuous development of medical level, researchers have found that more and more diseases are highly related to hyperlipidemia, such as AIDS, depression and so on.26,27 Therefore, in the world, hyperlipidemia has become one of the most important diseases threatening human life and health to a large extent. Although there is no uniform international standard for the diagnosis of hyperlipidemia, hematological parameters are widely used in the diagnosis of hyperlipidemia and the evaluation of treatment methods, which is capable of use hematological parameters to automatically diagnose hyperlipidemia.28–31
In this paper, we sought to propose an auxiliary diagnosis algorithm that can not only diagnose hyperlipidemia rapidly and accurately according to human hematological parameters but also provide diagnostic markers automatically, which improves the objectivity of traditional methods and the interpretability of deep learning model algorithm. Compared with previous work, our proposed new model not only automatically determines the patient’s health but also automatically provides diagnostic markers. Compared with the auxiliary diagnostic system that only provides the diagnosis result, the new model proposed in this paper has higher interpretability and credibility. Therefore, the above model can not only speed up the patient’s medical treatment process but also further improve research efficiency of diagnostic markers, and have great potential for discovering new diagnostic markers. Artificial intelligence aided diagnosis system can effectively simplify the process of patients seeking medical treatment, alleviate the contradiction of lack of medical resources, and improve the survival rate of emergency patients, as shown in Figure 1.
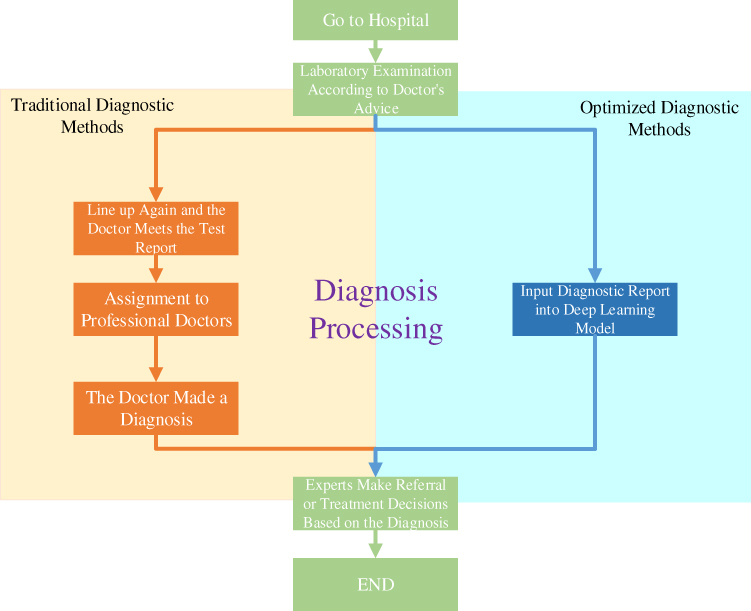 |
Figure 1 Traditional diagnostic process and optimized diagnostic process. |
Further, the improvement of medical diagnostic technology depends not only on the improvement of diagnostic accuracy but also on the research of diagnostic markers. Traditional research methods for diagnostic markers are usually difficult to synthesize hundreds and thousands of samples, the research cycle is long and the cost is high. The research method of diagnostic markers based on deep learning technology proposed in this paper can not only automatically synthesize large quantities of data but also effectively simplify the research process, thus reducing the research cost, as shown in Figure 2.
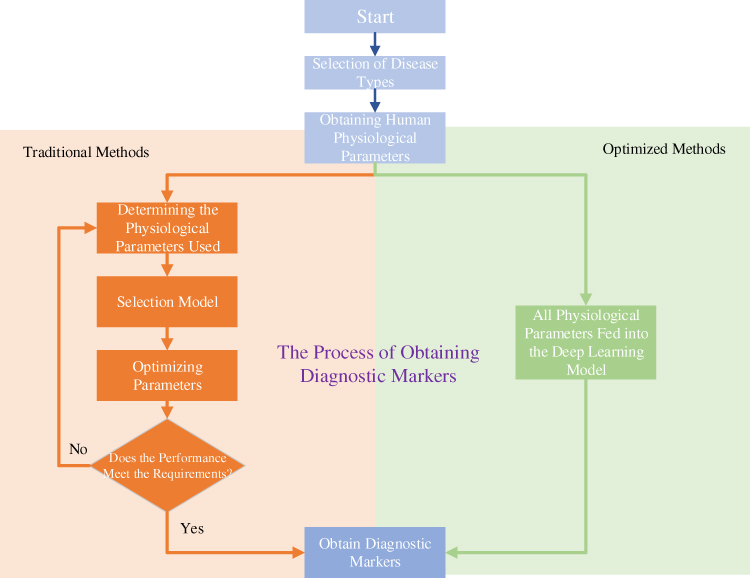 |
Figure 2 Methods for studying diagnostic markers before and after optimization. |
In this paper, the attention deep learning algorithm is preliminarily illustrated with human hematological data, and the performance of different algorithms are compared. Compared with EHR without unified evaluation standards, this paper used human hematological parameters which had unified standards as training data, so that the algorithm has higher reliability. Our attention deep learning algorithm has been preliminarily applied to the automatic diagnosis of hyperlipidemia with hematological parameters; the corresponding diagnostic markers and the significance of different markers are given at the same time. The hematological parameters used in this study include cholesterol, triglyceride, high-density lipoprotein, low-density lipoprotein, hemoglobin and red blood cells. Despite different blood parameters are often obtained by different methods, their acquisition methods have a unified standard. These parameters can reflect different health conditions of human body.32,33 At the same time, compared with the auxiliary diagnostic method which only provides diagnostic results, the algorithm proposed by this paper can also predict the diagnostic markers of diseases and the corresponding importance automatically, which improve the possibility of finding more effective new diagnostic markers, and accelerate the development of medical diagnostic technology further. This paper compares the results of the model’s automatic prediction with the gold standard. Although no new diagnostic markers were obtained using limited data, it proved that the model has the potential to reasonably predict the diagnostic basis. Our work is the first time to systematically study an artificial intelligence aided diagnosis system that integrates automatic diagnosis and automatic prediction diagnostic markers, which is of great significance to the development of medical level. The improvement of recognition accuracy does not mean the improvement of medical diagnosis, but also the explanation of disease mechanism. Increasing the interpretability of the model will further improve the diagnostic level of the disease.34 In addition, a method that can automatically process a large number of samples and provide biomarkers can speed up the study of disease mechanism. In conclusion, the combination of deep learning technology and medical diagnostic technology is of great significance for disease research.
Methods and Subject
Method
The deep learning model used in this paper is the LSTM network which combined with the attention mechanism. The eigenvector composed of human hematological parameters is fed to the LSTM layer after it was processed by the attention layer. The LSTM layer can extract the joint features hidden in the original data automatically. Finally, the extracted joint features are processed by the classification function to achieve the purpose of the automatic classification of samples. From the attention layer, we can know which physiological parameters play a decisive role in the diagnosis of the disease, and we can get the influence degree of different physiological parameters on the disease. The global parameter of the model was updated by Adam algorithm,35 and as it is a binary classification task, the sigmoid function was used as a classification function.
LSTM
LSTM is the core of attention deep learning algorithm. It can learn the features of the data far apart in the text data, which provides support for learning the relationship between physiological parameters mentioned above, and improves the performance of the auxiliary diagnostic model. The purpose of LSTM is to study the joint representation of different physiological parameters. In clinical practice, disease-related physiological parameters are not independent, so LSTM is more suitable for analyzing textual medical data with joint characteristics than traditional methods. The schematic diagram of LSTM layer is shown in Figure 3.
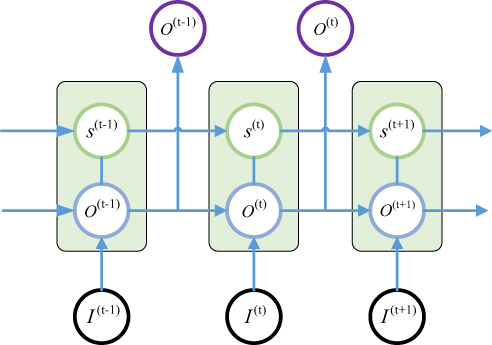 |
Figure 3 Schematic of LSTM Layer (unfolded-drawing). |
where  is the current input of LSTM cell,
  is the current output of LSTM cell,
  is the current status of the LSTM cell. The key element of LSTM is to use three control switches to control the long-term state of cell. The names of the three gates mentioned above are Forgotten Gate, Input Gate and Output Gate. The control principle is shown in Figure 4.
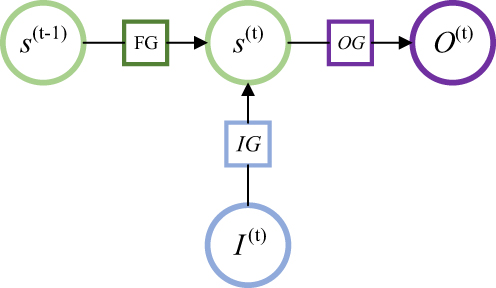 |
Figure 4 The control principle of LSTM. |
where FG is Forgotten Gate, OG is Output Gate, IG is Input Gate. The updating principle of LSTM long-term state is shown in Equation 1.
(1)
In this equation, (2) are bias, the input weight and forgotten gate’s loop weight of LSTM cell, respectively. The output of LSTM is shown in Equation 2.
Attention Mechanism
The purpose of using attention mechanism is to make task processing system focus more on finding useful information that is significantly related to the target output in the input data, so as to improve the quality of output. In other words, attentional mechanisms are used to search for disease-related physiological parameters in the hope of finding more disease-related biomarkers. This is significantly useful information that can be used to identify diagnostic markers of disease. Just as the human brain processes information, it is purposefully focused on the information most relevant to the purpose and ignores other things that do not matter. Disease biomarkers can be identified by visualizing these levels of concern for different physiological parameters. The principle is shown in Equation 3 and Equation 4.
(3) (4)

iwhere (5) is attention vector,
  is the encoding function of the original data,
  is raw data,
  is the input data of the LSTM layer. The possibility that the target output is related to each input physiological parameter is obtained by coding process F. Then, the output of the coding process is normalized by Softmax to obtain the attention distribution probability value that conforms to the probability distribution value range. The use of attention mechanisms provides more information on which physiological parameters are more important for the diagnosis of the target disease. At the same time, the attention mechanism helps the model to process effective information and discards useless data, improving the model’s ability to process more complex information. The Softmax function is shown in Equation 5.
Adam Algorithm
Adam algorithm is different from the traditional stochastic gradient descent algorithm. Adam algorithm designs independent self-adaptive learning rates for different parameters by first-moment estimation and second-moment estimation of the gradient. ADAM is an adaptive learning algorithm. Compared with the traditional stochastic gradient descent algorithm, ADAM can automatically adjust the learning rate to make the model converge to a better value faster. The updating method of global parameters of the deep learning model is shown in Equation 6.
(6)
In this equation, (7) is global parameters,
  is learning rate,
  is corrected first moment,
  is corrected second moment.
  is a very small value; its function is to ensure that the denominator is not zero. The gradient of small-batch data, as shown in Equation 7.
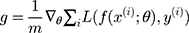
where  is the size of small-batch data,
  is the loss function,
  is the input data, and
  is the target output. Cross entropy loss function is used in this paper.
Subject
All the data involved in this experiment were collected from the Metabolic Disease Hospital of Tianjin Medical University. The data were collected from December 15, 2017 to January 20, 2018 and from March 1, 2018 to May 20, 2018. All the samples in the experiment came from patients who went to the hospital for health testing. We obtained permission from the Metabolic Disease Hospital of Tianjin Medical University Ethics Committee and written informed consent from patients. Before analyzing the data, we anonymous the patient’s name and other basic information.
We collected 600 data, each consisting of triglyceride (TG), cholesterol, low-density lipoprotein (LDL), high-density lipoprotein (HDL), hemoglobin (HB), red blood cell (RBC) and diagnostic results. All data included 348 males (58%) and 252 females (42%), aged 21–87, the average age was 55.6 years. There were 321 hyperlipidemia patients (53.5%) in the entire data. Subjects excluded pregnant women, lactation and patients who long-term taking anti-hyperlipidemia drugs. All hematological parameters were obtained by a fellowship-trained laboratory physician according to the golden criteria. All diagnostic results were determined by an endocrinologist with 8–10 years of clinical experience. Five hundred samples were used to train model and remaining 100 samples were used to evaluate the model’s performance; two parts above are independent of each other. There are 50 hyperlipidemia samples (50%) and 50 healthy samples (50%) in the testing dataset to ensure the sample balance (64 male patients (64%) and 36 female (36%) patients in the testing dataset). A completely independent testing dataset can evaluate the system’s performance to identify data not in the training dataset.
The raw data are multidimensional vector, it consists of hematological parameters urological parameters and doctors’ diagnostic results. It is shown in Figure 5. The raw data include blood routine parameters, biochemical test parameters, blood sugar parameters, glycosylated hemoglobin parameters and urine routine parameter. We extracted the above hematological data and diagnostic results as training vectors, and will consider adding more types of parameters in future work.
Diagnostic results of hyperlipidemia samples were quantified as 1, and health was 0. The parameter order of the feature sequence has not been specially designed. LSTM model can automatically learn the joint features between parameters that are close or far apart. Because there are complex internal relations between different physiological parameters, the LSTM model is a better choice.
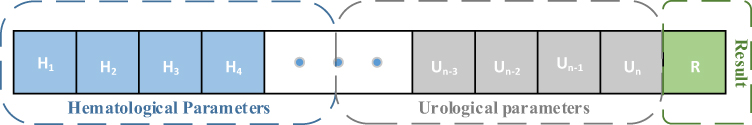 |
Figure 5 Schematic diagram of the original data format ( |


Experiment and Result
We used 500 data to train the deep learning model, and the remaining 100 data were used to test the final performance of the model. The physiological characteristic sequence was fed to train the model. The training data mentioned above were divided into two parts: (1) Training-Sample: 90% of the training data was used to optimize the global parameters of the model and (2) Hyperparameters-Sample: the remaining 10% of the training data was used to fine-tune the hyperparameters of the model (such as the number of neurons), and this part of the data maintains sample balance. The schematic diagram of attention deep learning algorithm is shown in Figure 6.
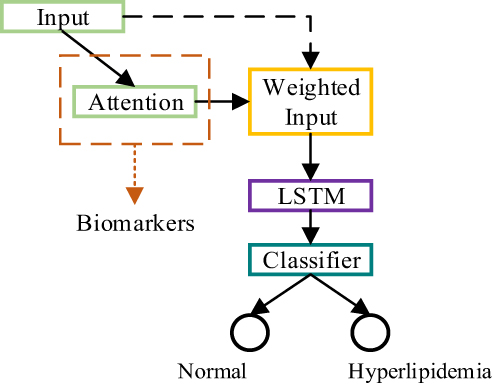 |
Figure 6 Principle diagram of attention deep learning algorithm. |
The model was built and trained by Keras using TensorFlow as backend. The experimental platform is Ubuntu 16.04 computer with NVIDIA GTX 1080 GPU. The test dataset and training dataset are completely independent and do not cross each other. The test dataset contains 50 hyperlipidemia samples (50%). In the test dataset, there are 64 male patients (64%) and 36 female patients (36%). We kept the test set in a sample equilibrium state so that any health condition can be verified with the same probability.
During the training process, the size of mini-batch was 20, the loss function was the cross-entropy cost function, and Adam algorithm was used to optimize the global parameters ( (8) =0.001,
 =0.9,
=0.9, =0.999,
  =
= ). At the same time, one-hot technology was also applied to the representation of data labels. Each dimension of the output vector represents a different health condition, only the corresponding element is 1 and the rest is 0. Because this paper distinguished two kinds of health conditions, the two-dimensional vector was used to code the data label, the normal diagnosis result was coded to 10, and the diagnosis result of hyperlipidemia was coded to 01. One-hot technology is helpful to improve the robustness of the model. At the same time, the sigmoid function was used in the classification function, because of the binary classification task. As mentioned above, the cross-entropy was used as loss function, the principle of cross-entropy is shown in Equation 8.
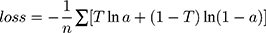
In Equation 11,  is the target output,
  is the actual output,
  is the number of samples. The training process of the model is shown in Figure 7.
 |
Figure 7 Plotting the performance of the model on the validation set and the training set ((A) is the accuracy of the model on the validation set and the training set, and (B) is the loss of the model on the validation set and the training set, respectively). |
The model achieved a 94% ACC performance in the test set. From the training images, we could find that the performance of the model on the training set is similar to that on the test set, this phenomenon proved that the model had good robustness. The model can not only judge the health condition of samples in training set but also diagnosis unknown samples. ROC curve was also used to evaluate the model’s ability in diagnosing diseases, the ROC curve of the model mentioned above is shown in Figure 8.
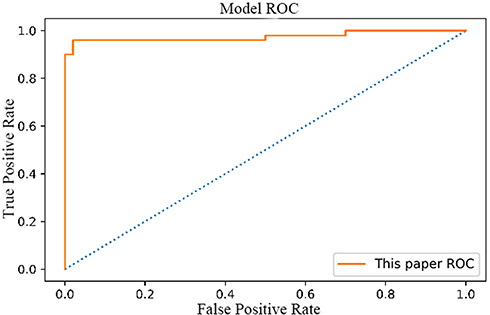 |
Figure 8 ROC Curve of attention deep learning algorithm. |
The area under the ROC curve is 97.48%. The confusion matrix for the model is shown in Figure 9.
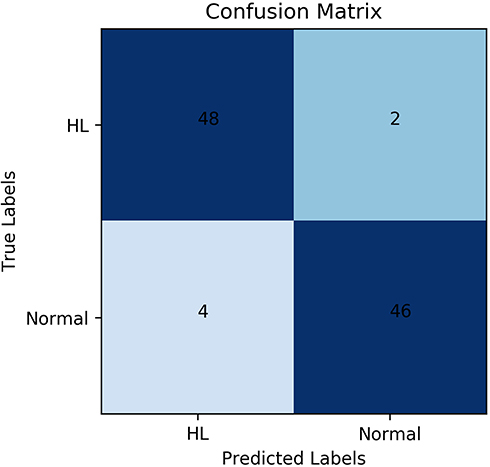 |
Figure 9 Confusion matrix of attention deep learning algorithm. Abbreviation: HL, Hyperlipidemia |
According to the confusion matrix, the specificity and sensitivity of the model can be obtained. The model achieved 92% specificity and 96% sensitivity in the test set. In conclusion, it can be proved that our attention deep learning model achieved a better performance, it can diagnose hyperlipidemia automatically and accurately, even faced with samples that do not exist in the training set.
Diagnostic markers of hyperlipidemia can be predicted by the model automatically, the result is shown in Figure 10.
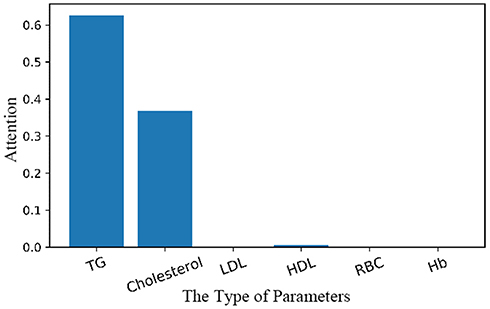 |
Figure 10 Prediction of diagnostic markers and their importance by attention deep learning algorithm. Abbreviation: TG, Triglyceride; LDL, Low-density lipoprotein; HDL, Low-density lipoprotein; RBC, Red blood cell; Hb, Hemoglobin |
Discussion
In this study, our work is the first systematic study on the auxiliary diagnostic system that used human hematological data to automatically diagnose hyperlipidemia and provide the relevant diagnostic basis (automatically prompt diagnostic markers). Experimental results show that our attention deep learning algorithm can not only accurately and automatically diagnose hyperlipidemia but also automatically provide the diagnostic markers of hyperlipidemia and the importance of different diagnostic markers. As shown in Figure 7, the model achieved good and similar performance on both the training set and the validation set, and the model achieved 94% ACC with a completely independent test dataset. Therefore, this phenomenon can be proved that our model has good generalization ability, and it can still achieve better performance in the facing of data that does not exist in the training set. As shown in Figures 8 and 9, the model achieved 97.48% AUC, 92% specificity and 96% sensitivity. It can be proved that the model not only achieves better diagnostic accuracy but also has the good distinguishing ability and high reliability in the facing of different health conditions. An AI system which can auxiliary diagnosis of disease can alleviate the problem of uneven distribution of medical resources and improve the medical level in areas where medical resources are scarce. At the same time, the auxiliary diagnosis system can also speed up the patient’s medical treatment process and enhance the patient’s medical experience. Because the AI system proposed in this paper does not have the segment of manual feature extraction, it has higher comprehensiveness and objectivity, and reduces the dependence of diagnostic results in the professional level of doctors.
In a limited range, we found similar work. Edward Choi and his colleagues used recurrent neural networks to process electronic health records of varying lengths for early diagnosis of heart failure, reaching 88.3% of AUC.6 Michael A. Schwemmer et al used a deep neural network decoding framework to classify intracortical recording, reaching 93.78% ACC.10 Oliver Faust et al used LSTM neural network to process RR interval signals for automatic diagnosis of atrial fibrillation.36 All the work had achieved better performance in the test set. Although EHR data are widely used in the research of auxiliary diagnostic system, there is no unified standard to evaluate the quality of EHR data at present. The EHR data include artificial description, which limits the credibility of EHR data, which is also one of the important factors limiting the further improvement of model performance. Moreover, because EHR data does not have a uniform format, it is necessary to extract features manually before data are utilized, which not only causes the loss of original information but also increases labor costs. In the training process of this model, physiological parameters with standardized criteria were applied to the training of the model, and there was no manual description process. At the same time, the proposed model does not need to manually extract features, so that the model can obtain more potentially useful information, thus improving the performance of the model and increasing the reliability of the model. In addition, the explanation of disease mechanism and biomarker should be added. Only the improvement of diagnostic accuracy can be used to prove that the improvement of medical diagnostic technology is not very comprehensive. The accuracy of diagnosis is difficult to represent the level of comprehensive diagnosis.
We also compared the performance of SVM and fully connected neural network with our model. The type of SVM is C-SVC, and the kernel function is RBF. It achieved 63% ACC with the same testing dataset. The SVM which used sigmoid kernel function polynomial kernel achieved 50% ACC and 81% ACC in the same testing data, respectively. Fully connected neural network achieved 89% ACC with test data mentioned above. We speculated that it is due to the fact that the traditional classification method is difficult to learn the relationship between different physiological parameters and cannot learn the importance of different physiological parameters for disease. Each physiological parameter is not independent. Actually, the parameters interact with each other. One physiological parameter is the same, while the other physiological parameters are different, which may reflect different health conditions. Different physiological parameters are interrelated in physiological mechanism. Like the semantic environment, the same words have different interpretations in different semantic environments. For example, when both lipids and HDL are high, patients may experience a temporary increase in blood lipids due to diet rather than hyperlipidemia. Moreover, HDL reflects the synthesis of lipid metabolism, and it is not the higher the better. We also compared the performance of the simple recurrent neural network (RNN) with the model proposed by this paper. This RNN model also used the Adam algorithm to update global parameters. It achieved 93% ACC in the test dataset mentioned above. The performance of these two models is very close. However, LSTM can better synthesize the relationship between different physiological parameters to give a judgment, and the simple RNN model only considers the state at the nearest moment. The more complex the data processed, the more obvious the difference in performance between the two models. We also found similar work in the limited range. Manjeevan Seeraa37 and his colleges classify transcranial Doppler signals using individual and ensemble RNN, it archives 85.52% AUC. These works have also achieved good results in the test set. However, we speculate that human physiological features are not independent, it is not sufficient to consider only one parameter which is the reason for the better performance of LSTM that can analyze joint characteristics.38,40 Therefore, LSTM is a better choice for dealing with physiological parameter sequences with complex intrinsic relationships, similar to the recognition of semantic environments or voice signals.
Further, the above studies on the auxiliary diagnostic system show good performance in the test set, but do not provide the basis for model classification data. The development of medical diagnosis depends not only on the improvement of diagnosis accuracy but also on the researching diagnostic markers, diagnostic basis or the influence of different physiological parameters on diseases. Compared with previous work, this paper proposed a deep learning model that integrated the attention mechanism. By using the attention mechanism, we could observe which physiological parameters are more important for disease diagnosis. Model can automatically provide disease diagnostic markers while diagnosing diseases. When using only LSTM, we found that the model reached 92% ACC in the same test dataset. We suspect that this is because the use of the attentional mechanism can help the model process more efficient information purposefully, thus alleviating the problem of over-fitting. In addition, the use of attention mechanism is more convenient for the study of diagnostic markers, which can effectively reflect the importance of different physiological parameters for disease diagnosis. The performance is very close. We speculate that this is because the data is not very complex. In the future, we will study and use more types of physiological parameters to identify more complex diseases. As shown in Figure 10, in the process of diagnosing hyperlipidemia, the model mainly judged hyperlipidemia according to cholesterol and triglyceride. This phenomenon coincides with the diagnostic criteria of hyperlipidemia. At the same time, HDL was also found to be associated with hyperlipidemia. We speculate that this phenomenon is due to the fact that HDL functions as a carrier of cholesterol in the surrounding tissues, so it has a close relationship with hyperlipidemia.40,41 The model mentioned above not only shows a high correlation between hyperlipidemia and direct markers, but also provide indirect markers. This phenomenon not only shows that the model proposed in this paper can learn the relationship between different physiological parameters but also shows that the model has great potential to discover new diagnostic markers. Although the model does not give new diagnostic markers using limited data, the prediction results of the model are in line with the gold standard, which proves the reliability of the model, and the model has the potential to reasonably analyze more evidence for disease diagnosis. As shown in Figure 10, although the model pays little attention to the remaining items, in fact, the attention is not zero. We speculate that this is due to there is a correlation between human different physiological parameters. The model shows a strong concern for the physiological parameters directly related to disease, but does not give high attention to the physiological parameters not related to disease, such as red blood cells, which further proves the reliability of the model. By using the visualization method, the diagnostic basis of the auxiliary diagnostic model can be clearly presented, which improve a certain degree of transparency to the black-box model. The AI diagnosis system proposed in this paper not only provided accurate and robust diagnosis results but also provided the diagnostic basis of diseases (94% ACC, 97.48% AUC, 96% sensitivity and 92% specificity with test dataset). It not only increases the intelligence of the model but also broadens the application scope of the system, such as medical teaching (provide recommended diagnosis results and evidence to inexperienced physicians). Most importantly, the traditional method of researching diagnostic markers is often to observe the clinical manifestations of dozens or hundreds of patients artificially, and then find the diagnostic markers of diseases according to the method of statistics. The traditional methods mentioned above are often difficult to synthesize large quantities of data and have a long research cycle.42,43 Andrei M. Beliaevc et al used 96 patients samples to discover diagnostic markers of acute cholangitis. Akihiko Yuki et al found CADM1 is a diagnostic marker in early-stage mycosis fungoides with 58 cases.44 Their research results have achieved good performance. Artificial analysis of limited data (dozens of samples) has the characteristics of one-sidedness and long research time, which undoubtedly increases the difficulty of researching diagnostic markers. The auxiliary diagnostic system proposed in this paper can automatically provide diagnostic markers by integrating a large amount of clinical data, which reduces the blindness of researching diagnostic markers and speeds up the discovery process of new diagnostic markers to a certain extent. In addition, automatic analysis of large quantities of samples can improve the reliability of the model and reduce the contingency caused by small quantities of samples.
Despite it is potential, it still has limitations. One limitation of our study is that the data we used included only a few human hematological parameters. Some diseases can not only be determined by these parameters but also need other information, such as biochemical testing and so on. Diseases may also be associated with other physiological parameters that are not part of the training set. Another limitation is that the diagnosis of many chronic diseases is also related to many other types of information, such as sex, age, disease history, family history and so on. Finally, because the experimental data were collected in the metabolic disease hospital, there were many samples with metabolic diseases in the training data, which was also a factor limiting the further improvement of the performance of the model. Therefore, in the future work, we will study how to add more types of parameters to the auxiliary diagnostic system and collect more samples of different health status, so as to further improve the performance of the model. In the future work, we will also research more types of model in order to find more effective model can process human physiological parameters.
Conclusion
In this paper, an algorithm of attention deep learning is proposed which has the potential to automatically diagnose hyperlipidemia with human hematological parameters and provide the diagnostic markers and the importance of different markers for the diagnosis results at the same time. It achieved 97.48% AUC, 92% specificity and 96% sensitivity with the test dataset.
A new method proposed can accurately and automatically diagnose hyperlipidemia and provide disease diagnostic markers at the same time. The visualization of the model diagnosis basis enhances the transparency of the black-box model, increases the interpretability of deep learning algorithm, and enhances the credibility of the model. The attention deep learning algorithm proposed in this paper realizes the providing diagnostic basis while diagnosing disease. This phenomenon proves that it has the potential to discover new diagnostic markers, and expands the application scope of the auxiliary diagnostic system. At the same time, the experimental results show that the algorithm also has the capability to learn the relationship between different physiological parameters, so it has a high generalization ability. Therefore, it can save medical resources, speed up the researching process of diagnostic markers to a certain extent, speed up the work efficiency of the hospital, and enhance the patient’s medical experience. Increasing the explanatory power of the model can effectively increase the research on biomarkers.34
The future work is still around to improve the performance of the auxiliary diagnostic system. In order to further improve the accuracy of the model, we will consider how to input more types of data into the model, such as patient history, etc. At the same time, in order to diagnose more kinds of diseases, we will collect more data to expand our existing data set. Because there are some complex diseases that require a joint judgment of multiple types of diagnostic information, we will study how to use cross-media diagnostic data as an input training model in the next step. Due to the limited data types, no new diagnostic markers are proposed in this model. Although the experiment confirmed that the diagnostic markers predicted by the model were the same as the gold standard, we will add more physiological parameter types and multiple diseases in the future work, with a view to finding more disease-related biomarkers. Not only in medicine but also from the perspective of engineering, we will further study the optimization methods of auxiliary diagnostic systems, such as the adjustment methods of hyperparameters. We will also further expand the sample data, consider more factors that may influence the diagnosis of the disease such as different races, diverse age groups et al to further enhance the reliability of the model.
Acknowledgment
Yuliang Liu and Quan Zhang are co-first authors, they contributed equally to this work. This work was funded by the Tianjin University of Science and Technology's New Coronavirus Prevention and Control Research Project and Ministry of Education Fund of China (2018A03033).
Author Contributions
All authors contributed to data analysis, drafting or revising the article, gave final approval of the version to be published, and agree to be accountable for all aspects of the work.
Disclosure
The authors declare no conflicts of interest in this work.
References
1. Leachman SA, Merlino G. The final frontier in cancer diagnosis. Nature. 2017;542:36. doi:10.1038/nature21492
2. Webb S. Deep learning for biology. Nature. 2018;554(7693):555–557. doi:10.1038/d41586-018-02174-z
3. Camacho DM, Collins KM, Powers RK, et al. Next-generation machine learning for biological networks. Cell. 2018;173(7):1581–1592. doi:10.1016/j.cell.2018.05.015
4. Lim E-C, Park JH, Jeon HJ, et al. Developing a diagnostic decision support system for benign paroxysmal positional vertigo using a deep-learning model. J Clin Med. 2019;8(5):633. doi:10.3390/jcm8050633
5. Kolachalama VB, Garg PS. Machine learning and medical education. Npj Digital Med. 2018;1(1):54. doi:10.1038/s41746-018-0061-1
6. Choi E, Schuetz A, Stewart WF, Sun J. Using recurrent neural network models for early detection of heart failure onset. J Am Med Inf Assoc Jamia. 2016;24(2):361.
7. Rasmy L, Yonghui W, Wang N, et al. A study of generalizability of recurrent neural network-based predictive models for heart failure onset risk using a large and heterogeneous EHR data set. J Biomed Inform. 2018;84:11–16. doi:10.1016/j.jbi.2018.06.011
8. Chilamkurthy S, Ghosh R, Tanamala S, et al. Deep learning algorithms for detection of critical findings in head CT scans: a retrospective study. Lancet. 2018;392(10162):2388–2396. doi:10.1016/S0140-6736(18)31645-3
9. Kermany DS, Goldbaum M, Cai W, et al. Identifying medical diagnoses and treatable diseases by image-based deep learning. Cell. 2018;172(5):1122–1131.e9. doi:10.1016/j.cell.2018.02.010
10. Schwemmer Michael A, Skomrock Nicholas D, Sederberg Per B, et al. Meeting brain–computer interface user performance expectations using a deep neural network decoding framework. Nat Med. 2018;24:1669–1676. doi:10.1038/s41591-018-0171-y
11. Kaysen G, Gambertoglio J, Felts J, Hutchison F. Albumin synthesis, albuminuria and hyperlipemia in nephrotic patients. Kidney Int. 1987;31:1368–1376. doi:10.1038/ki.1987.151
12. Lupattelli G, Pirro M, Siepi D, et al. Non-cholesterol sterols in different forms of primary hyperlipemias. Nutr Metab Cardiovasc Dis. 2012;22(3):231–236. doi:10.1016/j.numecd.2010.05.010
13. Zhao J, Mao X, Chen L. Speech emotion recognition using deep 1D & 2D CNN LSTM networks. Biomed Signal Process Control. 2019;47:312–323. doi:10.1016/j.bspc.2018.08.035
14. Reddy BK, Delen D. Predicting hospital readmission for lupus patients: an RNN-LSTM-based deep-learning methodology. Comput Biol Med. 2018;101:199–209. doi:10.1016/j.compbiomed.2018.08.029
15. Qiu TS, Shi X, Wang JF, et al. Deep learning: a rapid and efficient route to automatic metasurface design. Adv Sci. 2019;6:1900128. doi:10.1002/advs.v6.12
16. Tanveer MS, Hasan MK. Cuffless blood pressure estimation from electrocardiogram and photoplethysmogram using waveform based ANN-LSTM network. Biomed Signal Process Control. 2019;51:382–392. doi:10.1016/j.bspc.2019.02.028
17. Alexander T, Nguyen DS, Greenfield AS, Bhakta JL, Feuer WJ. Detecting glaucoma progression using guided progression analysis with OCT and visual field assessment in eyes classified by international classification of disease severity codes. Ophthalmol Glaucoma. 2019;2(1):36–46. doi:10.1016/j.ogla.2018.11.004
18. Nicole Gray W, Chunhua WJJOTAMIAJ. Methods and dimensions of electronic health record data quality assessment: enabling reuse for clinical research. J Am Med Inf Assoc. 2013;20(1):144–151. doi:10.1136/amiajnl-2011-000681
19. Ben-assuli O, Sagi D, Leshno M, et al. Improving diagnostic accuracy using EHR in emergency departments: a simulation-based study. J Biomed Inform. 2015;55:31–40. doi:10.1016/j.jbi.2015.03.004
20. Liu Y, Zhang Q, Geng Z, et al. Detecting diseases by human-physiological-parameter-based deep learning. IEEE Access. 2019;7:22002–22010. doi:10.1109/ACCESS.2019.2893877
21. Zhang Q, Liu Y, Liu G, Zhao G, Qu Z, Yang W. An automatic diagnostic system based on deep learning, to diagnose hyperlipidemia. Diabetes Metab Syndrome Obesity. 2019;12:637–645. doi:10.2147/DMSO.S198547
22. Coudray N, Ocampo PS, Sakellaropoulos T, et al. Classification and mutation prediction from non–small cell lung cancer histopathology images using deep learning. Nat Med. 2018;24:1559–1567. doi:10.1038/s41591-018-0177-5
23. Hedge C, Stothart G, Jones JT, Frías PR, Magee KL, Brooks JCW. A frontal attention mechanism in the visual mismatch negativity. Behav Brain Res. 2015;293:173–181. doi:10.1016/j.bbr.2015.07.022
24. Liu G, Guo J. Bidirectional LSTM with attention mechanism and convolutional layer for text classification. Neurocomputing. 2019;337:325–338. doi:10.1016/j.neucom.2019.01.078
25. Ståhl N, Mathiason G, Falkman G, Karlsson A. Using recurrent neural networks with attention for detecting problematic slab shapes in steel rolling. Appl Math Model. 2019;70:365–377. doi:10.1016/j.apm.2019.01.027
26. Tsai F-J, Li T-M, Cheng C-F, et al. Effects of Chinese herbal medicine on hyperlipidemia and the risk of cardiovascular disease in HIV-infected patients in Taiwan. J Ethnopharmacol. 2018;219:71–80. doi:10.1016/j.jep.2018.03.006
27. Lim S-W, Nyam T-TE, Ho C-H, et al. Increased risk of anxiety or depression after traumatic spinal cord injury in patients with preexisting hyperlipidemia: a population-based study. World Neurosurg. 2017;106:402–408. doi:10.1016/j.wneu.2017.06.182
28. Yang Q, Wang J-H, Huang D-D, et al. Clinical significance of analysis of the level of blood fat, CRP and hemorheological indicators in the diagnosis of elder coronary heart disease. Saudi J Biol Sci. 2018;25(8):1812–1816. doi:10.1016/j.sjbs.2018.09.002
29. Lupattelli G, Siepi D, De Vuono S, et al. Cholesterol metabolism differs after statin therapy according to the type of hyperlipemia. Life Sci. 2012;90(21–22):846–850. doi:10.1016/j.lfs.2012.03.038
30. Georgescu A, Alexandru N, Constantinescu E, Popov D. Effect of gap junction uncoupler heptanol on resistance arteries reactivity in experimental models of diabetes, hyperlipemia and hyperlipemia-diabetes. Vascul Pharmacol. 2006;44(6):513–518. doi:10.1016/j.vph.2006.03.005
31. Lan J, Zhao Y, Dong F, et al. Meta-analysis of the effect and safety of berberine in the treatment of type 2 diabetes mellitus, hyperlipemia and hypertension. J Ethnopharmacol. 2015;161:69–81. doi:10.1016/j.jep.2014.09.049
32. Goede V, Stauder R. Multidisciplinary care in the hematology clinic: implementation of geriatric oncology. J Geriatr Oncol. 2018.10(3):497–503.
33. Navder KP, Baraona E, Lieber CS. Polyenylphosphatidylcholine decreases alcoholic hyperlipemia without affecting the alcohol-induced rise of HDL-cholesterol. Life Sci. 1997;61(19):1907–1914. doi:10.1016/S0024-3205(97)00830-8
34. Liu Y, Liu G, Zhang Q. Deep learning and medical diagnosis. Lancet. 2019;394(10210):1709–1710. doi:10.1016/S0140-6736(19)32501-2
35. Kingma DP, Ba JL. ADAM: a method for stochastic optimization. arXiv:1412.6980. 2014.
36. Faust O, Shenfield A, Kareem M, San TR, Fujita H, Rajendra Acharya U. Automated detection of atrial fibrillation using long short-term memory network with RR interval signals. Comput Biol Med. 2018;102:327–335. doi:10.1016/j.compbiomed.2018.07.001
37. Seera M, Lim CP, Tan KS, Liew WS. Classification of transcranial Doppler signals using individual and ensemble recurrent neural networks. Neurocomputing. 2017;249:337–344. doi:10.1016/j.neucom.2016.05.117
38. Stephen W, Liu S, Sohn S, et al. Modeling asynchronous event sequences with RNNs. J Biomed Inform. 2018;83:167–177. doi:10.1016/j.jbi.2018.05.016
39. Singh S, Pandey SK, Pawar U, Janghel RR. Classification of ECG Arrhythmia using Recurrent Neural Networks. Procedia Comput Sci. 2018;132:1290–1297. doi:10.1016/j.procs.2018.05.045
40. Rader DJ, Kees Hovingh G. HDL and cardiovascular disease. Lancet. 2014;384(9943):618–625. doi:10.1016/S0140-6736(14)61217-4
41. Sasso FC, Pafundi PC, Gelso A, et al. High HDL cholesterol: a risk factor for diabetic retinopathy? Findings from NO BLIND study. Diabetes Res Clin Pract. 2019;150:236–244. doi:10.1016/j.diabres.2019.03.028
42. Beliaev AM, Booth M, Rowbotham D, Bergin C. Diagnostic inflammatory markers in acute cholangitis. J Surg Res. 2018;228:35–41. doi:10.1016/j.jss.2018.02.048
43. Hua M, Bandos AI, Gur D. Informativeness of diagnostic marker values and the impact of data grouping. Comput Stat Data Anal. 2018;117:76–89. doi:10.1016/j.csda.2017.07.008
44. Yuki A, Shinkuma S, Hayashi R, et al. CADM1 is a diagnostic marker in early-stage mycosis fungoides: multicenter study of 58 cases. J Am Acad Dermatol. 2018;6(79):1039–1046. doi:10.1016/j.jaad.2018.06.025
45. Rajendra Acharya U, Faust O, Adib Kadri N, Suri JS, Yu W. Automated identification of normal and diabetes heart rate signals using nonlinear measures. Comput Biol Med. 2013;43(10):1523–1529. doi:10.1016/j.compbiomed.2013.05.024
 © 2020 The Author(s). This work is published and licensed by Dove Medical Press Limited. The
full terms of this license are available at https://www.dovepress.com/terms
and incorporate the Creative Commons Attribution
- Non Commercial (unported, 3.0) License.
By accessing the work you hereby accept the Terms. Non-commercial uses of the work are permitted
without any further permission from Dove Medical Press Limited, provided the work is properly
attributed. For permission for commercial use of this work, please see paragraphs 4.2 and 5 of our Terms.
© 2020 The Author(s). This work is published and licensed by Dove Medical Press Limited. The
full terms of this license are available at https://www.dovepress.com/terms
and incorporate the Creative Commons Attribution
- Non Commercial (unported, 3.0) License.
By accessing the work you hereby accept the Terms. Non-commercial uses of the work are permitted
without any further permission from Dove Medical Press Limited, provided the work is properly
attributed. For permission for commercial use of this work, please see paragraphs 4.2 and 5 of our Terms.