
Back to Journals » Journal of Healthcare Leadership » Volume 17
Data-Driven Leadership in Internal Medicine Clinics: A DES–DOE Framework for Optimizing Patient Flow and Turnaround Time
Authors Boonmee C  , Thamtrakul W
Received 1 July 2025
Accepted for publication 8 November 2025
Published 21 November 2025 Volume 2025:17 Pages 749—777
DOI https://doi.org/10.2147/JHL.S543508
Checked for plagiarism Yes
Review by Single anonymous peer review
Peer reviewer comments 2
Editor who approved publication: Dr Pavani Rangachari
Chawis Boonmee,1,2 Wipada Thamtrakul3
1Humanitarian Logistics and Crisis Operations Research Unit, Department of Industrial Engineering, Faculty of Engineering, Chiang Mai University, Chiang Mai, Thailand; 2Advanced Technology and Innovation Management for Creative Economy Research Group, Chiang Mai University, Chiang Mai, Thailand; 3Department of Industrial Engineering, Faculty of Engineering, Chiang Mai University, Chiang Mai, Thailand
Correspondence: Chawis Boonmee, Department of Industrial Engineering, Faculty of Engineering, Chiang Mai University, Chiang Mai, Thailand, Email [email protected]
Purpose: Efficient leadership in healthcare requires actionable insights to improve both service quality and patient outcomes. This study aims to enhance outpatient service efficiency by applying a data-driven decision-support framework that integrates Discrete Event Simulation (DES) with Design of Experiments (DOE). The focus is on optimizing patient flow and reducing turnaround time in an internal medicine clinic of a Thai public hospital.
Methods: A hybrid DES–DOE model was developed to replicate the clinic’s real-world processes and assess the impact of key operational factors. The DES model, built in Arena, captured detailed workflows and resource constraints. A full factorial DOE design evaluated five critical variables: patient arrival patterns, physician availability, consultation start-time delays, pre-appointment blood testing, and proportions of patient categories (eg, cardiovascular, neurological, endocrine). A total of 32 scenarios were tested and analyzed using ANOVA.
Results: All five factors significantly influenced turnaround time, with patient category proportions showing the strongest effect. The optimized scenario resulted in a 10.46% reduction in average turnaround time. These findings suggest that targeted, evidence-based adjustments can substantially improve patient throughput and clinic performance.
Conclusion: This research provides healthcare leaders with a validated, replicable framework for improving operational efficiency through simulation-based experimentation. It demonstrates how integrating DES and DOE can support strategic planning, workforce management, and service design, ultimately contributing to better patient experiences and more resilient healthcare systems.
Keywords: discrete event simulation, design of experiments, turnaround time, healthcare systems modelling, simulation-based optimization, outpatient service efficiency
Introduction
Efficient management of outpatient services in hospital departments is critical to ensuring timely and quality healthcare delivery. Delays and inefficiencies in outpatient clinics not only affect patient satisfaction but can also compromise the overall quality of care.1 In real-life settings, these inefficiencies may lead to overcrowded waiting rooms, increased stress for healthcare staff, and delayed diagnosis and treatment, ultimately impacting patient outcomes.2 Given the growing demand for outpatient services due to aging populations and the increasing prevalence of chronic diseases globally, addressing these challenges is paramount.3 A key aspect of effective outpatient care is minimizing unnecessary waiting times and delays, while recognizing that certain processes, consultations, and tests may require additional time based on the patient’s specific medical needs. Improving healthcare efficiency often involves reducing patient wait times and the overall turnaround time, which encompasses the total time a patient spends in the outpatient system from arrival to discharge.4 Although turnaround time is traditionally associated with inpatient settings, it has been successfully applied to outpatient performance evaluation, as demonstrated in studies by Baril et al and Aroua and Abdulnour.5,6
Efficient outpatient service management is vital for timely, quality care. The Internal Medicine Clinic (MED clinic) plays a unique role by managing complex conditions such as neurological and cardiovascular disorders. Unlike general clinics handling minor issues or follow-ups, the MED clinic requires coordinated diagnostic and treatment efforts. Its broad scope and patient complexity highlight the need for improved operational efficiency to meet diverse needs and ensure high standards of care within the hospital outpatient system.
Improving efficiency in the MED clinic is crucial, as it serves a diverse patient population with a broad range of medical conditions.7 The hospital in this case study operates under an open-access model, where patients are free to choose their healthcare provider, unlike systems with fixed catchment areas. This flexibility attracts a high and varied volume of patients from multiple regions, increasing the complexity of demand management and resource allocation. The hospital offers numerous services—including internal medicine, orthopedics, pediatrics, ophthalmology, psychiatry, dermatology, surgery, and otolaryngology—making it a comprehensive care facility. The MED clinic, in particular, accounts for a significant portion of outpatient visits. With outpatient volumes rising steadily, as reported by the Ministry of Public Health, the hospital must develop effective strategies to maintain service quality and efficiency.8 This includes understanding patient flow, forecasting demand, and improving operational workflows. Hospital leadership plays an active role in this process by conducting performance reviews, identifying bottlenecks, and implementing data-driven improvements. These efforts align with the hospital’s broader goals of delivering high-quality, patient-centered care while adapting to the increasing demands placed on outpatient services.9–11
To address growing challenges in outpatient service delivery, this study analyzes patient flow, identifies bottlenecks, and proposes evidence-based strategies to improve efficiency. The goal is to enhance time management and ensure timely, effective care—ultimately improving patient satisfaction and outcomes. This research integrates Discrete Event Simulation (DES) and Design of Experiments (DOE) to achieve these objectives. DES enables the development of a realistic, computer-based model of outpatient operations, allowing for detailed analysis of patient flow, resource use, and decision-making within the Internal Medicine Clinic.12 DOE provides a structured method to vary and test operational factors, revealing both individual and interactive effects on turnaround time and efficiency.13–15 While the use of DES and DOE is well-established in healthcare modeling, this study presents a novel application tailored to the specific challenges of a Thai private hospital’s MED clinic. By reflecting the real operational environment, this hybrid approach generates practical insights and recommendations that are both context-specific and replicable in similar healthcare settings.5
Recent studies have focused on intelligent real-time scheduling and predictive resource planning to improve outpatient service efficiency. For instance, Munavalli et al16 proposed an integral patient scheduling model using hybrid ant agent algorithms to dynamically assign patients to optimal pathways based on real-time clinic status. In a related effort, Munavalli et al17 implemented a robust predictive planning framework using Takt time to allocate resources in response to demand variability, demonstrating significant reductions in patient waiting and cycle times. Furthermore, multi-agent systems have been used for real-time capacity management, transforming clinics from open-loop to closed-loop systems that adapt to stochastic demand.18 While these approaches emphasize real-time control and intelligent coordination, they often lack a systematic experimental framework for understanding the influence of multiple interacting variables on operational performance. This study addresses that gap by integrating DES with DOE to support leadership-driven performance optimization in outpatient clinics.
Patient characteristics, resource allocation, and process readiness—defined here as the preparedness of staff, equipment, and facilities to begin patient care processes promptly—will be carefully assessed within the simulation model.19 Statistical analyzes, such as ANOVA, will be utilized to determine the significance of factors and potential interactions, enabling the development of effective guidelines. The proposed guidelines will not only enhance the patient experience by reducing outpatient service time and streamlining processes but also optimize resource utilization, resulting in improved operational efficiency within the Outpatient Department (OPD) in the MED clinic.
While several studies in healthcare OR provide strong academic contributions, such as Atalan and Dönmez,20 there is limited evidence of direct implementation in real healthcare environments. Recognizing this gap, our study not only builds upon these academic models but also engages directly with stakeholders to ensure that our recommendations are feasible and actionable within the specific context of the OPD in the MED clinic. This approach aims to contribute both theoretically and practically by offering solutions that can be realistically applied to improve outpatient service efficiency. While Vahdat et al21 effectively used DES to reduce patient lengths of stay in ambulatory care clinics in the northeast region of the United States, their dynamic room allocation policies have not been extensively explored in the context of outpatient departments, particularly in Thai hospitals. Additionally, Gabriel et al22 showcased the benefits of combining DES with Lean Healthcare principles in a Canadian emergency department, yet there remains a gap in understanding how these principles can improve OPD efficiency and patient outcomes in different healthcare environments. Weerawat et al23 applied DES to identify bottlenecks in an orthopedic outpatient department in Thailand, highlighting the potential of DES as a decision-support tool. However, their study did not integrate DOE to further enhance resource allocation and service efficiency. This research addresses these research gaps by proposing an integrated DES and DOE approach to improve outpatient services in the MED clinic. By doing so, it aims to provide comprehensive decision-support tools for hospital management, enabling better resource allocation and improved patient outcomes. While Atalan and Dönmez20 demonstrated the effectiveness of DES and DOE integration in an emergency department setting, our study applies this approach within an OPD at the MED clinic of a Thai hospital. This focus introduces unique operational challenges, such as managing routine patient flows and optimizing resource allocation for diverse outpatient services, which differ from the immediate response needs of an emergency department. Our model is tailored to address specific outpatient factors like patient arrival patterns and doctor availability, providing decision-support tools aimed at enhancing resource efficiency and patient satisfaction within the OPD setting.
Integrating DES and DOE not only supports operational optimization but also serves as a strategic approach for quality improvement and service evaluation. These tools offer a risk-free, virtual environment to test interventions, assess their impacts, and identify potential improvements—without disrupting real-world operations. This aligns with the goal of healthcare institutions to maintain high-quality services while adapting to fluctuating patient demands and operational challenges.
In this study, “optimization” refers specifically to enhancing patient flow, improving resource allocation, and increasing efficiency within the outpatient setting—particularly in the MED clinic. It is not intended as a blanket solution for all healthcare processes but rather as a simulation-based, context-specific tool for evidence-driven decision-making.
This research contributes new insights by applying proven methods in a novel context, highlighting the adaptability of DES and DOE in diverse healthcare environments. The outcomes will help fill current practice gaps and inform strategies for more efficient outpatient care delivery.
The proposed contributions of this research are fourfold:
- Evidence-based guidelines to reduce patient turnaround time, streamline clinical processes, and optimize resource utilization—ultimately enhancing patient satisfaction and service quality.
- A hybrid DES–DOE framework that allows a comprehensive analysis of operational variables and their interactions, generating robust and actionable insights.
- Demonstration of real-world applicability, showcasing how simulation can support better resource management and operational decisions in outpatient services.
- Practical recommendations for healthcare leaders, supported by rigorous statistical analysis (eg, ANOVA), ensuring reliability and facilitating strategic improvements in outpatient department performance.
The structure of the paper is as follows: the next part reviews the related literature, followed by the problem description and methodology. The results are then presented, after which the findings, insights, limitations, and future research directions are discussed. A subsequent part offers further discussion and analysis. Finally, the paper concludes with a summary of the key contributions.
Literature Review
Various studies have been dedicated to enhancing the efficiency of healthcare services, employing a range of tools such as simulation,24 lean,22 value stream mapping,25 optimization,26 and Kaizen.27 Simulation tools, in particular, have proven to be powerful in identifying and resolving issues within hospital systems. From past literature reviews, simulation has been found to effectively address patient waiting times and improve resource utilization in healthcare services.28 Chalk29 utilized a simulation model to evaluate the benefits of expanding and extending operating hours in an Ambulatory Emergency Care (AEC) unit at Derriford Hospital in United Kingdom. Extending operating hours demonstrated a significant impact on treatment capacity and efficiency, outweighing the effects of expanding the unit’s size. Consequently, the hospital utilized this evidence to support the extension of AEC unit hours, including weekends. In the comprehensive guide by Gunal,30 various simulation methods, such as DES, system dynamics, and agent-based simulation, were evaluated to emphasize the importance of Operational Research/Management Science in hospital planning and management. By allowing healthcare practitioners to model complex processes, these methods help in optimizing resource allocation, improving patient flow, and reducing bottlenecks, thereby enhancing service provision while maintaining high-quality standards. Weerawat et al23 applied DES to model an orthopedic outpatient department ward in a Thai public hospital, identifying bottlenecks and prioritizing resource-critical clinics through key performance indicators. The DES model demonstrated the potential as a decision-support tool for hospital management across various OPDs. Vahdat et al21 addressed prolonged patient lengths of stay in ambulatory care clinics by implementing flexible and dynamic room allocation policies for providers. Their DES model revealed that a compromise room allocation approach effectively reduced patient lengths of stay and physician idle time, requiring fewer organizational changes within the clinic. Teymourifar31 introduces a simulation-based optimization model for sectorization to balance healthcare accessibility, using a bi-objective function focusing on quality and accessibility. While the model effectively addresses regional imbalances, gaps remain in exploring dynamic patient demands, adaptability to evolving healthcare needs, and integration of qualitative factors such as patient satisfaction and resource utilization efficiency. Demir et al32 introduces SimulEQUITY, a simulation-based framework addressing healthcare inequalities at the hospital level by modeling socio-economic variations in patient pathways. While it holistically examines inpatient, outpatient, and emergency services, the study primarily focuses on macro-level health equity. It lacks specific exploration of operational metrics like turnaround time or resource allocation optimization, which are central to improving service efficiency in outpatient clinics. Ngaorungsi and Chutima33 effectively explore outpatient department improvements at a community hospital by integrating Lean principles with simulation techniques. It identifies key issues like doctor unavailability and insufficient staff for document handling. However, research gaps include a lack of focus on patient experience, limited exploration of qualitative human resource factors, and insufficient analysis of technology integration. Additionally, the findings may not be generalizable across different settings, and the long-term sustainability of proposed improvements remains unassessed. While Ngaorungsi and Chutima33 identify gaps such as patient experience, qualitative human resource factors, and technology integration, our study directly addresses patient experience by focusing on turnaround time and waiting times, which are critical to patient satisfaction. Additionally, we examine resource allocation and human resource factors in depth, providing actionable insights into staffing and workflow management. Although technology integration is not a primary focus of our study, the proposed framework could be adapted to include such elements in future research. Rasoli and Sheikhalishahi34 combined business process modeling and DES to optimize patient admission processes, achieving a 29% reduction in work-in-process and a 6% decrease in waiting time. However, gaps remain in addressing broader operational challenges, such as dynamic patient arrival variability, staff adaptability, and patient satisfaction beyond admission efficiency metrics. Taleb et al35 proposed an integrated approach combining DES and data envelopment analysis to evaluate and optimize resource allocation in emergency departments. The study identified 21 efficient resource configurations to enhance emergency department performance. However, gaps remain in exploring real-time adaptability of resource allocation, integrating patient flow variability during peak times, and assessing the impact of external factors, such as seasonal demand fluctuations and pandemic-specific challenges, on ED efficiency. By integrating simulation and other methodologies, these studies highlight the significance of improvement tools in healthcare service improvement. With these approaches, healthcare facilities can enhance efficiency and patient outcomes while optimizing resource allocation.
Simulation tools, particularly DES, have emerged as powerful tools to identify and solve problems in hospital systems.36 One notable study by Atalan and Dönmezm20 demonstrated the successful integration of DOE with DES in an ED setting. By applying DES with DOE, they achieved significant improvements, reducing the average patient waiting time by 75.48% and increasing the number of treated patients by 10.53% without requiring additional daily resources. This approach provides valuable insights for healthcare professionals in optimizing resource allocation and addressing the challenges posed by human factors in healthcare systems. While Atalan & Dönmezm20 successfully integrated DOE with DES in an emergency department setting, our study applies this approach within an OPD context in a MED clinic. This setting requires managing scheduled appointments, coordinating pre-appointment procedures, and addressing diverse patient categories. Unlike the ED, where immediate throughput is key, our model focuses on optimizing turnaround time and overall efficiency across multiple clinics within the outpatient structure, providing tailored guidelines for outpatient service improvement. Majid et al37 focused on enhancing hospital performance and patient safety through a DOE model based on computer simulation and response surface methodology. Their approach led to notable achievements, including risk mitigation in decision-making, reduced queue length, and patient waiting time. Another study by Atalan38 showcased the integration of central composite design and response surface methodology with DES techniques to improve product quality and company performance. By combining statistical optimization and DES, the study demonstrated the potential to achieve better results and enhance overall performance in quality engineering. Baesler et al39 applied simulation modeling to estimate the maximum possible demand increment in an emergency room of a hospital in Chile. Their research allowed for predictions of patient time in the system and the hospital’s capacity to handle increased demand, providing valuable insights for optimizing resource allocation and improving the efficiency of emergency room services. Gabriel et al22 utilized DES and Lean Healthcare principles to plan the expansion of a Canadian emergency department and address the demand from small, closed care centers—smaller healthcare facilities with limited operating hours or capacity, leading to patient overflow into emergency departments. By simulating the emergency department and implementing changes based on simulation results, the study achieved significant improvements in the number of treated patients and average Length of Stay (LOS), aligning with Lean principles. Aroua and Abdulnour6 evaluated various scenario policies to improve patient LOS in an emergency department. Using simulation and experimental design techniques, they analyzed the effects of different parameters on LOS, resulting in valuable insights for healthcare professionals seeking to improve patient flow and reduce waiting times. While Aroua and Abdulnour6 applied simulation and DOE to optimize patient flow in an emergency department setting, our study focuses on outpatient services in a MED clinic, which involves unique challenges like scheduled appointments, pre-appointment procedures, and coordination across multiple specialties. By employing a two-level factorial design, our approach also examines interactions among outpatient-specific factors, providing tailored recommendations for optimizing outpatient care. Pan et al40 aimed to improve specialist outpatient clinic (SOC) systems in Singapore through a DES model and DOE technique. Their research highlighted the impact of different improvement strategies on reducing turnaround time —the total time from patient entry to service completion—in the SOC, with one strategy successfully implemented in the actual SOC system, leading to promising improvements. Chand et al41 conducted an analysis and improvement study on patient flow at an outpatient clinic, successfully identifying sources of variability and improvement factors using process mapping and simulation modeling. Their recommended modifications resulted in improved patient wait times and higher physician utilization. Baril et al5 explored ambulatory patient LOS in an emergency department in Quebec. By utilizing DOE and DES, they identified factors affecting hospital performance and demonstrated how giving more responsibility to nurses could effectively reduce patient turnaround time and ease emergency department overcrowding. Jahangiri et al42 introduced a simulation-based optimization meta-model to minimize waiting times in emergency departments during COVID-19. By employing a full-factorial design, the study optimized resource allocation, reducing patient wait times and enhancing emergency department efficiency. However, it overlooks patient satisfaction metrics (eg, turnaround time) and qualitative factors such as staff scheduling. Corsini et al43 effectively utilizes simulation and DOE to improve outpatient chemotherapy oncology departments, revealing significant insights into resource allocation and patient flow. Additionally, exploring the impact of new constraints on service delivery could enhance the applicability of the findings in real-world settings. Overall, these studies highlight the importance of simulation and other management tools in enhancing healthcare service efficiency and patient outcomes. The integration of DOE with DES, Lean principles, and other methodologies offers valuable insights for healthcare professionals seeking to improve resource allocation and improve overall healthcare performance.
After a comprehensive literature review, several key factors influencing healthcare service improvement were identified. While each study emphasized different elements, most focused on emergency departments, with limited exploration of OPD MED clinics, as summarized in Table 1. Commonly used response metrics include waiting time and turnaround time, while quantitative inputs such as the number of physicians, nurses, and examination rooms dominate current models.
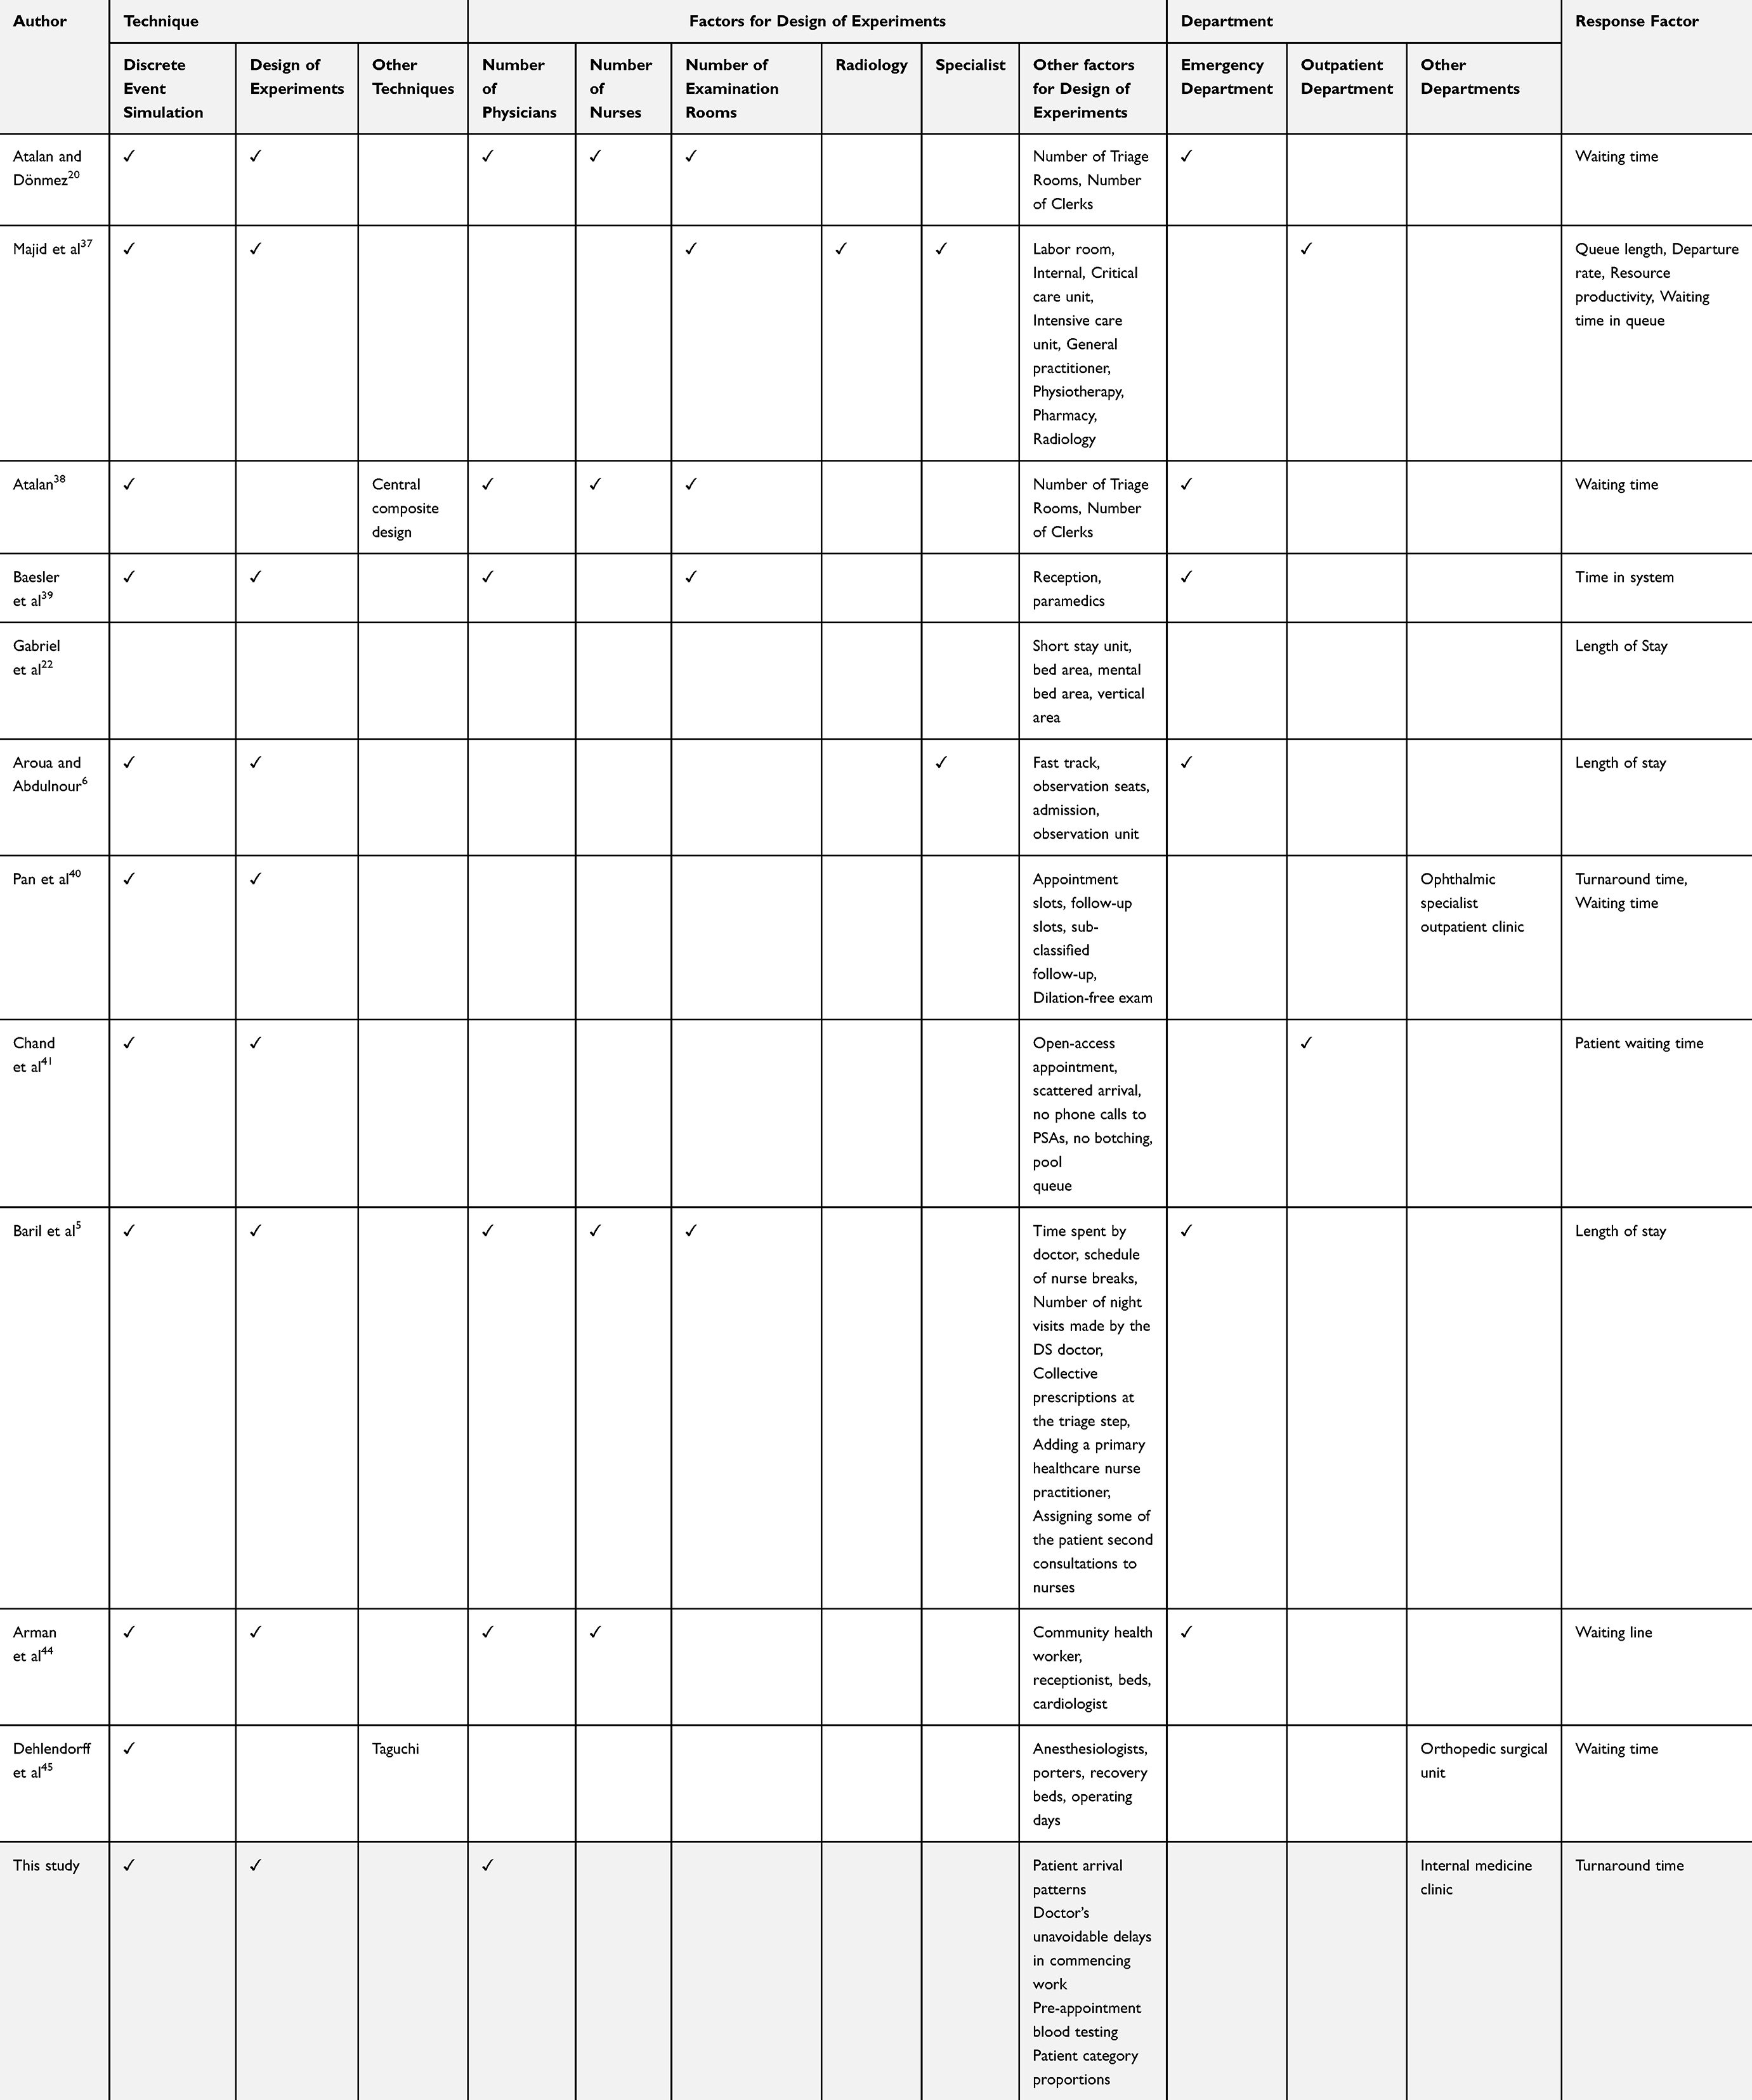 |
Table 1 Comprehensive Review of Application DES and DOE in Hospital |
Despite progress using simulation, lean, and value stream mapping, research gaps persist. Many studies prioritize quantitative over qualitative aspects of outpatient care. This study addresses these gaps by incorporating a broader range of variables, including patient arrival patterns, shifting patient category proportions, pre-appointment blood testing, varying physician availability, and common consultation delays—factors that more accurately reflect the complex OPD MED workflow.
Moreover, this study uniquely integrates DES with DOE to explore optimal resource allocation and workflow design under multiple interacting conditions. This hybrid approach allows for a more comprehensive understanding of system performance and generates data-driven, practical recommendations for operational improvement. Although DES and DOE have been extensively used in healthcare, their combined application within the OPD MED clinic context is still limited. This study fills that gap, offering a robust, transferable model that hospital administrators can adapt for performance enhancement and long-term service sustainability.
Problem Description and Methodology
Experimental design evaluates the impact of independent variables, such as resource allocation and schedule adjustments, on turnaround time at the OPD of the MED clinic. In this context, “patient trajectories” refer to the various paths and processes that patients go through during their visit, including registration, waiting periods, consultations, tests, and discharge. These trajectories are simulated using DES, enabling the application of DOE without disrupting actual clinic operations. The results are analyzed using statistical methods, such as variance analysis, to accurately assess the influence of these variables. The detailed steps involved in this process are presented below.5
Case Study: The OPD of the MED Clinic of a Regional Hospital
This study utilized data from the OPD of the MED clinic in a regional university-affiliated hospital. Operating as a private hospital, it provides healthcare services daily from 8:00 AM to 8:00 PM. Analysis of the collected data revealed that the OPD of the MED clinic is one of the busiest sections, catering to a significant number of patients. The study focused on the five largest sections within the clinic, which collectively account for approximately 82.5% of all patients treated. These sections include the endocrine system, cardiovascular system, respiratory system and pulmonary diseases, reproductive and urinary system, and the nervous system and brain. Figure 1 illustrates the patient flow diagram within the system.
 |
Figure 1 Patient flow diagram in the system of the case study. |
Upon entering the system, patients initiate contact with the patient administration department to confirm their appointment and complete the registration process. New patients may be asked to provide essential medical history details, including verification of treatment eligibility for insurance coverage. Following this, patients undergo vital signs assessment, weight measurement, and blood pressure checks to establish baseline data. If patients have scheduled examinations such as blood tests, urine tests, or electrocardiograms are required, patients are directed to the respective procedures. After these examinations, patients join the queue alongside those without appointments to await the doctor’s consultation. Following the medical diagnosis, patients proceed to the payment process, where they settle fees for examinations, procedures, and medications in a single transaction. Once payment is completed, patients can collect their prescribed medications from the hospital’s pharmacy department. For those requiring follow-up appointments, staff members issue appointment slips after payment. Upon completing this process, their treatment for the day is considered finished, and they are free to leave the system.
In this system, all patients, regardless of insurance status, follow a standardized registration process upon arrival. They confirm insurance eligibility and coverage, and all patients proceed to the payment section—whether fully insured or self-paying—to settle any fees or verify coverage before receiving medications.
The number of patients is a crucial dataset in this research. We obtained the data from the hospital’s Information Technology department, which includes patient entry and exit times from December 2021 to March 2022, comprising 10,908 patient records. This dataset allowed us to analyze patient arrival patterns across all five studied categories, each of which follows the general pathway shown in Figure 1. While specific diagnostic steps may vary by condition, the primary flow through registration, examination, and consultation remains consistent. The distribution of patient entries per hour, from Monday to Sunday, between 6:00 AM and 8:00 PM, is illustrated in Figure 2. The hospital’s official service hours are from 08:00 AM to 8:00 PM, during which outpatient services are provided. Patients, however, may arrive as early as 06:00 AM to book their place in the queue, though service does not begin until 08:00 AM. The total number of patients visiting the OPD MED clinic from Monday to Sunday is approximately 69, 145, 88, 126, 105, 133, and 162, respectively.
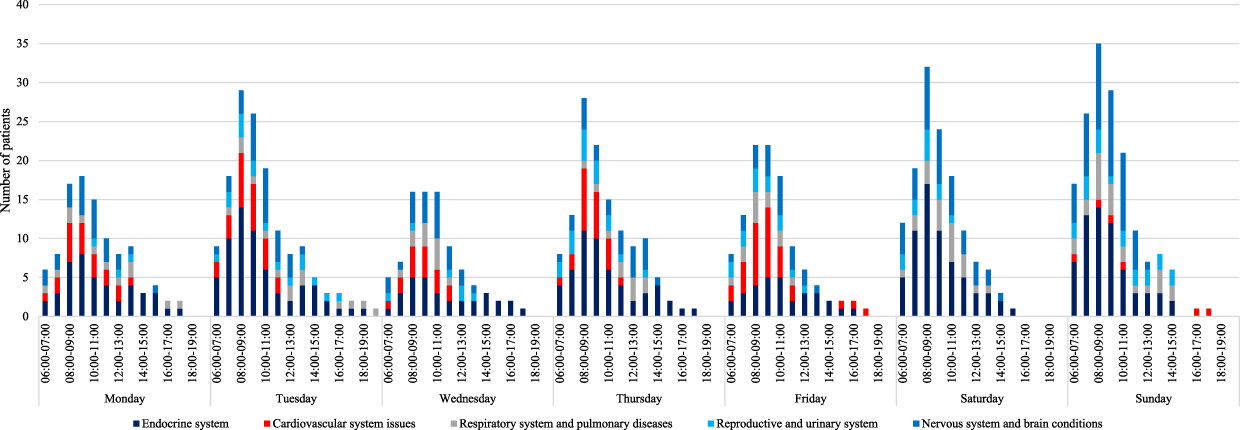 |
Figure 2 Number of patients accessing healthcare services throughout the week, from Monday to Sunday (06:00 AM to 08:00 PM). |
From Figure 2, analysis reveals that Thursday has the highest patient volume, followed by Wednesday and Tuesday. Most patients typically arrive between 8:00 AM and 10:00 AM. The data indicates that patients with endocrine system issues comprise the largest group, accounting for 41.47% of the total. This is followed by patients with nervous system and brain conditions (24.06%), cardiovascular system issues (12.95%), respiratory and pulmonary diseases (12.09%), and reproductive and urinary system concerns (9.42%), as shown in Figure 3.
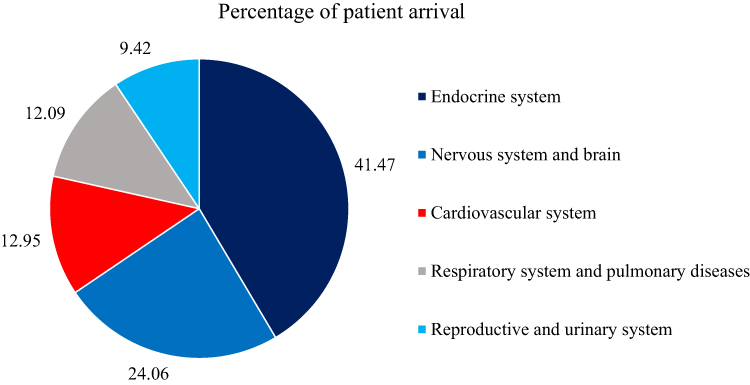 |
Figure 3 Proportion of categories in the hospital case study. |
Table 2 presented the number of nurses and administrative assistants available during office hours (8:00 AM – 4:00 PM) and after hours (4:00 PM – 8:00 PM). The allocation of resources for patient support varies between these time periods. Additionally, Table 2 highlights the differing working hours of specialized doctors across various clinics. Notably, the endocrinology clinic faces the highest demand, resulting in the longest working hours compared to other clinics each day.
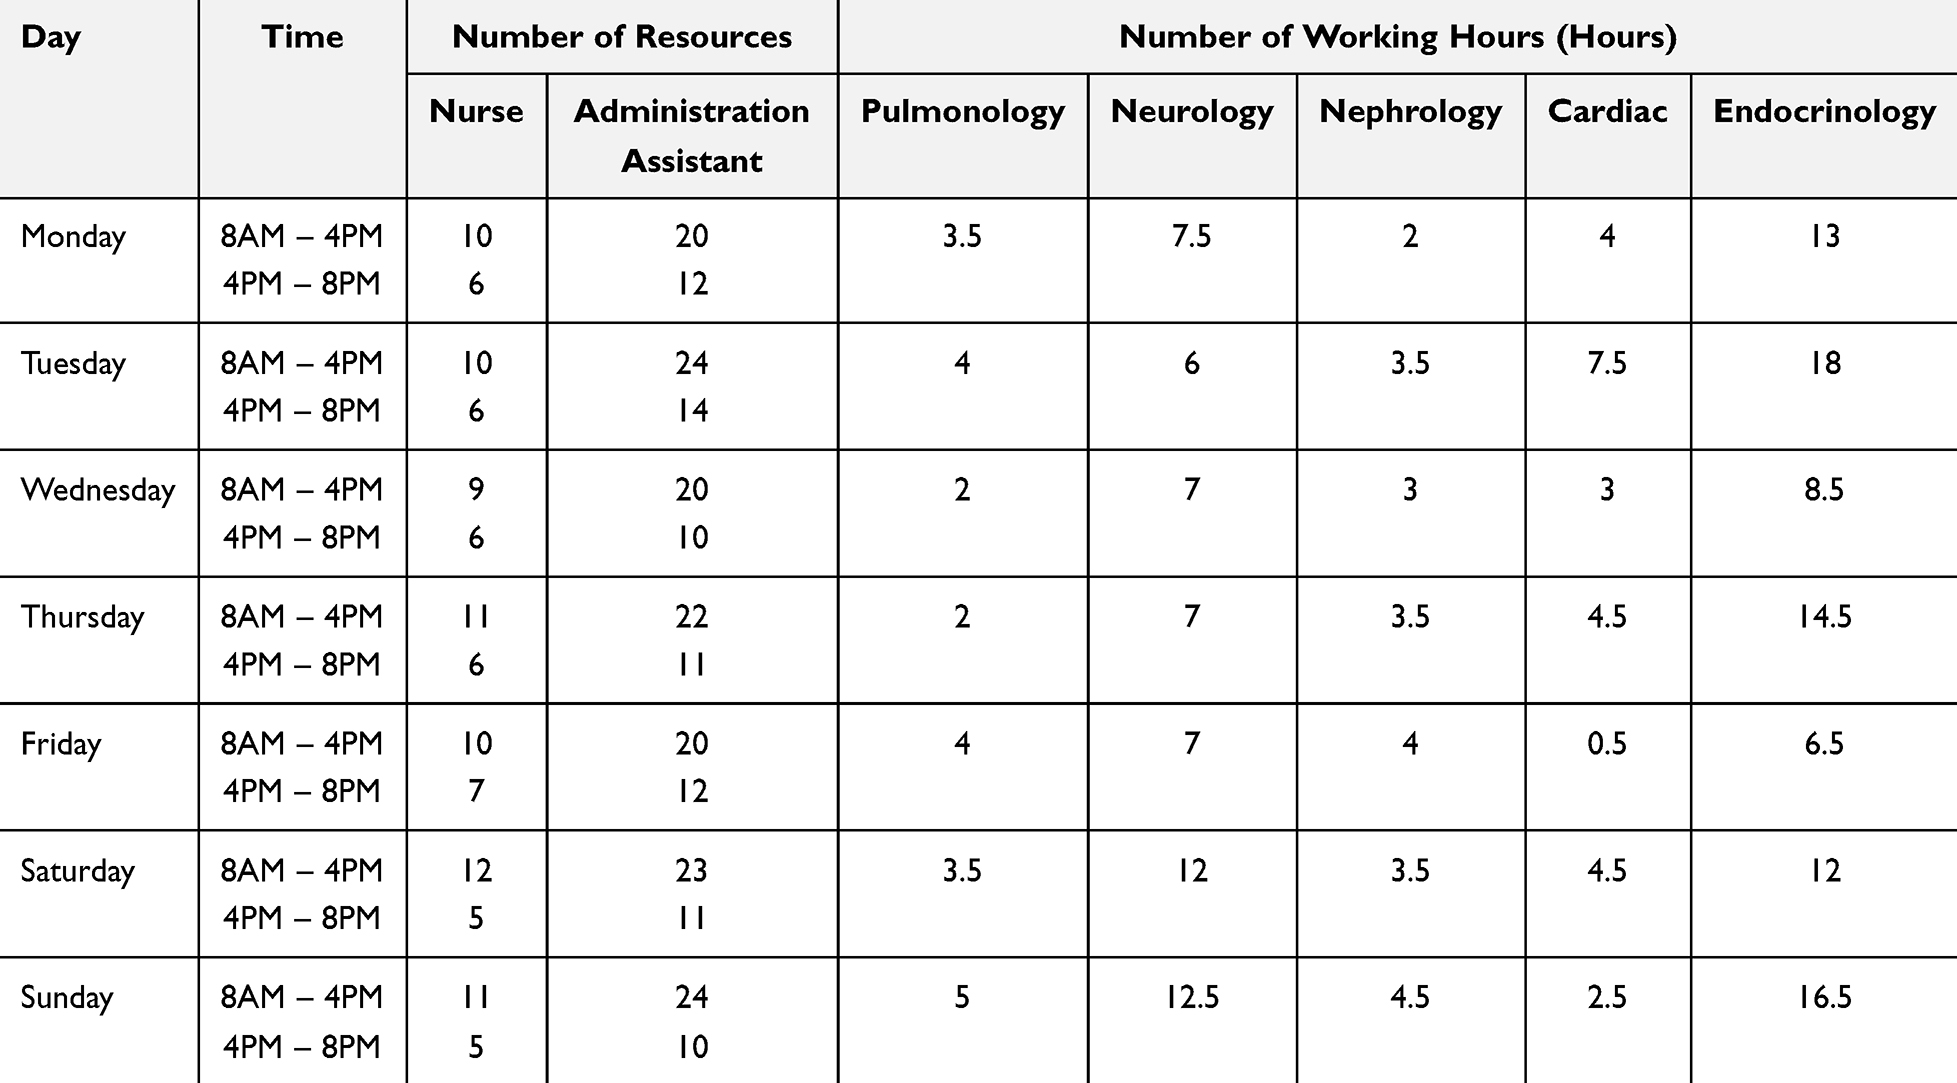 |
Table 2 Number of Nurses and Administrative Assistants Available, Along with the Working Hours of Specialized Doctors Across Various Clinics |
Simulation Model Development
The simulation model was constructed using Arena software (Version 14.0), with patients represented as entities. Real arrival rates, as depicted in Figure 2, were utilized to determine patient arrival rates at the MED OPD clinic. In Arena software, the arrival schedule specifies the number of arrivals per hour over a specified duration. Additionally, service time data at each service point were collected through observation and historical records from the IT department. For service points lacking available data, direct observations were conducted to estimate timings. All data were subsequently reviewed with clinic staff to confirm consistency and accuracy across service points. These data were then analyzed using the Input Analyzer tool in Arena software. To fit distributions for datasets, we applied the chi-square test at a significance level (α) of 0.05 for datasets containing 50 or more values.46 For datasets with fewer than 50 values, we used the Kolmogorov–Smirnov test. This approach, supported by Arena simulation software, ensures accurate probability distribution representations for real-world service times in our model.
Due to certain conditions in the hospital case study, some data values could not be collected. Consequently, the service time for some service points was assumed to be constant. The results of the data fitting are presented in Table S1 of Appendix A, providing insights into the model’s accuracy and effectiveness.
To gain a better understanding of the model structure and patient flow control, a simplified version of the model was created as shown in Figures S1–S8 of Appendix B. The model comprises eight sections. Patient entities were created and categorized into five groups based on the medical specialty required. These entities underwent general primary operations such as registration, vital signs checking, and weight and height measurement. Subsequently, the entities were assigned to each clinic in sections 4 (Figure S4) through 8 (Figure S8). Some entities in each clinic were directed to the blood test lab and then returned to their respective clinic. Finally, the entities were directed to the payment and medication section before being discharged from the outpatient system. In cases where admission for further care is required, patients are still considered discharged from the outpatient process model as our scope is focused exclusively on the MED OPD clinic. The dependent variable studied using the simulation model is the mean turnaround time of patients in the OPD of the MED clinic. Turnaround time represents the total time a patient spends in the system, encompassing all processes and waiting times, from arrival at the registration point to discharge. For more details on the simulation formulation, please refer to STRESS guidelines47 provided in the Appendix C.
To undergo rigorous verification and validation to ensure accuracy and appropriateness, the model developer compared the simulated entity flow with the actual flow process of the existing system. We consulted with clinic staff and healthcare experts to confirm that the model’s logic, patient flow, and parameters accurately mirrored real-world operations. Additionally, input data distributions were cross-checked against historical records for consistency.
Test runs were initially conducted with 10 replications to determine the necessary number of replications for the simulation experiments. The initial results indicated a mean turnaround time of 154.87 (150.97–158.77) minutes per person, corresponding to a 2.52% error compared to the point estimator (mean value). To achieve a smaller desired half-width of 3.09 or a 2% margin of error at 98% Confidence Interval (CI), as determined through brainstorming with decision makers, the required number of replications was calculated using Equation (1)46 to be approximately 15.85 (rounded to 16 replications). These 16 replications were subsequently used to conduct the validation test.

where  =the number of replications,
 =the number of initial replications
 =the half-width obtained from the initial set of replications
 =the desired half-width from decision makers.
The simulation experiments were conducted with parameter settings of 7 days (98 hours) for the run length and 16 replications for each scenario. This duration was chosen to represent a full weekly cycle, as the case study hospital operates daily from Monday to Sunday, with varying resources, schedules, and patient arrival patterns. To validate the model’s accuracy, a simulation test was repeated, and the results were compared with real-world data from the existing system. All subsequent simulation analyses were conducted using a 95% confidence interval (CI) for the mean turnaround time per person. As shown in Figure 4, the comparison revealed no significant difference between the output ranges of the two systems. The overlap of the CIs indicates that the developed simulation model accurately represents the real system.48
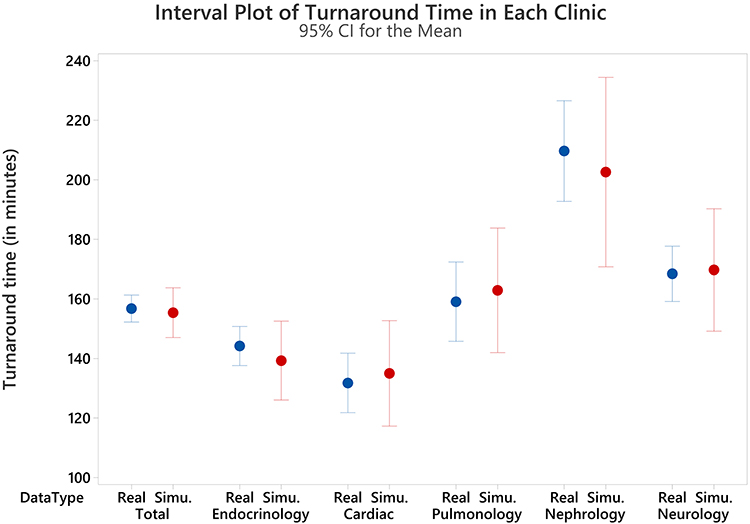 |
Figure 4 Results comparison between the real system and simulation. |
Design of Experiment: 25 Factorial Experiments
The experimental design involves selecting specific values or levels for particular factors, regarded as independent variables, and simultaneously varying these factors to assess their individual impact and potential interactions on the process measured by dependent variables. This research primarily investigates the effects of five factors, each considered at two levels, on the mean turnaround time in the OPD of the MED clinic within a Thai hospital case study. Based on observations and discussions with the administrative staff of the Thai hospital, we identified five factors that could potentially lead to improved turnaround time. These factors were systematically varied to understand their influence and interactions better, providing a robust framework for improving outpatient service efficiency. For the DOE, a two-level factorial design was used, where each factor was set at two levels: baseline (current practice) and an improved or adjusted state. These levels were selected based on operational feasibility and discussions with clinic management, ensuring that they represent realistic and actionable changes.
Dependent Variable
The dependent variable examined using the simulation model is the mean turnaround time for patients in the OPD of the MED clinic. This variable represents the total time each patient spends within the system, from arrival at the hospital registration point to discharge, including all waiting and service times across various stages of care.
Independent Variables and Their Level
In this section, the independent variables and their level are described. The details of each factor are presented as follows.
Patient Arrival Patterns at Various Time Intervals
Understanding daily patient arrival patterns is essential for hospitals to anticipate peak periods and optimize resource allocation. By adjusting staffing and scheduling strategies, hospitals can reduce wait times and improve patient flow efficiency.49 This study classifies patient arrivals into two intervals: morning (6:00 AM–12:00 PM) and afternoon (1:00 PM–8:00 PM). Preliminary surveys and consultations at the Thai hospital used in this case study indicated higher patient density in the morning, often resulting in delays and longer wait times. To address this issue, the study examines how shifting 20% of morning patients to the afternoon affects overall turnaround time. This strategy aims to maintain care delivery for all patients while reducing congestion during peak hours. Evidence from previous research by Natchaya50 highlights that concerns over timely treatment often drive patients to arrive early, which further intensifies morning congestion and burdens hospital staff. By analyzing the effects of time redistribution on service performance, the study offers a practical approach for improving outpatient efficiency. Additionally, it considers doctor availability during each time interval to ensure care continuity. This strategy can lead to better patient satisfaction, improved staff workload distribution, and more balanced resource utilization throughout the day.
Doctor Availability Across Time Intervals
Ensuring adequate doctor availability across different time intervals is essential for managing patient demand efficiently.51 Insufficient staffing can lead to long wait times and decreased patient satisfaction, while overstaffing may cause unnecessary costs and inefficiencies.52 By aligning doctor schedules with patient volumes, hospitals can achieve a balanced workload and improve service efficiency.53 In this study, simulation results from the Thai hospital case revealed that the consultation process across all five patient categories generated the longest waiting times. To explore this further, we visualized queue lengths across different days and times, identifying 10 critical bottlenecks. These insights highlight the need for improved medical resource allocation. Consequently, this research examines the impact of adjusting doctor numbers during various time intervals on average turnaround time. The goal is to determine whether targeted adjustments can significantly reduce delays and enhance patient flow, providing practical guidance for optimizing staffing strategies in outpatient settings.
Doctors’ Unavoidable Delays in Commencing Work
The unavoidable delays of doctors directly impact patient waiting times.54 Addressing and reducing tardiness can result in a more streamlined patient flow and shorter waiting periods. It also reflects professionalism and enhances patient trust and confidence in the healthcare service.55 This study compares two scenarios for physician start times: early (8:00 AM and 1:00 PM) versus delayed (8:30 AM and 1:30 PM), considering additional responsibilities like patient rounds or teaching. The aim is to evaluate whether later start times significantly affect overall turnaround time in the outpatient system. Understanding this impact is essential for optimizing scheduling and resource allocation while balancing clinical duties and educational roles in hospital operations.
Pre-Appointment Blood Testing
In current practice, approximately 50–85% of patients require blood tests during their clinic visits. Performing these tests before appointments allows physicians to review results promptly, enabling quicker diagnoses and improving overall care efficiency.56 This study explores whether recommending pre-appointment blood tests for about 20% of patients—particularly those with chronic, non-urgent conditions—can significantly reduce turnaround time. These patients, who constitute 10–17% of the total population, can benefit from completing blood tests days before their doctor visit, avoiding delays caused by waiting for lab results. For instance, a patient may take a blood test on Monday and return for their consultation on Wednesday. This pre-testing approach ensures faster service on appointment day without compromising care quality. Urgent cases are excluded and still receive same-day testing with prioritized processing. Initial observations and staff input support this strategy, and simulation modeling includes a distinct workflow for these pre-tested patients to evaluate efficiency gains.
Patient Category Proportions
Understanding the diverse medical needs of patient categories is essential for efficient resource allocation and care pathway optimization.57 Customizing services based on patient types helps reduce bottlenecks and ensures timely care.58 This study uses data from patients accessing private and public hospitals in Chiang Mai (2017–2022), based on the Ministry of Public Health’s Health Data Center. It was found that the proportions of certain patient categories—such as those with endocrine, cardiovascular, and respiratory disorders—are expected to increase. However, trends in urinary, reproductive, nervous system, and brain disorders remain unclear. This research investigates whether such changes in patient mix significantly impact turnaround time. New patient distributions were developed using historical trends and expert input, reflecting likely increases in specialties like endocrinology and cardiology. These were then incorporated into the simulation model to assess effects on turnaround time and resource use. Understanding these impacts enables hospitals to adjust services in advance, ensuring preparedness for future demand and maintaining high-quality care.
This study classifies independent variables into quantitative and qualitative categories. Quantitative factors are numerically measurable and include patient arrival patterns (proportions using services in the morning vs afternoon), pre-appointment blood testing (percentage of patients tested beforehand), and patient category proportions (based on historical and projected data). These are analyzed directly using numerical methods. In contrast, qualitative factors involve categorical distinctions that affect service delivery. Examples include doctor availability across time intervals (current vs adjusted schedules) and delays in treatment commencement (on-time vs delayed starts). These variables influence system performance but are not directly measured numerically, requiring different analytical approaches to assess their impact on outpatient.
Table 3 summarizes the five independent variables and their levels. A 25 factorial design was used, requiring 32 randomized experiments, each repeated 16 times via the DES model, totaling 512 simulations. Variables were coded as 0 or 1 to represent different factor levels. Analysis of Variance (ANOVA) was conducted at a 5% significance level to evaluate the effects and interactions. To ensure accessibility for stakeholders unfamiliar with statistics, we used the visual aspects of the DES model to demonstrate patient flow and identify bottlenecks. ANOVA results were communicated with a focus on practical insights, complemented by short training sessions to aid stakeholder understanding without requiring deep statistical knowledge. The detailed findings are presented in the next section.
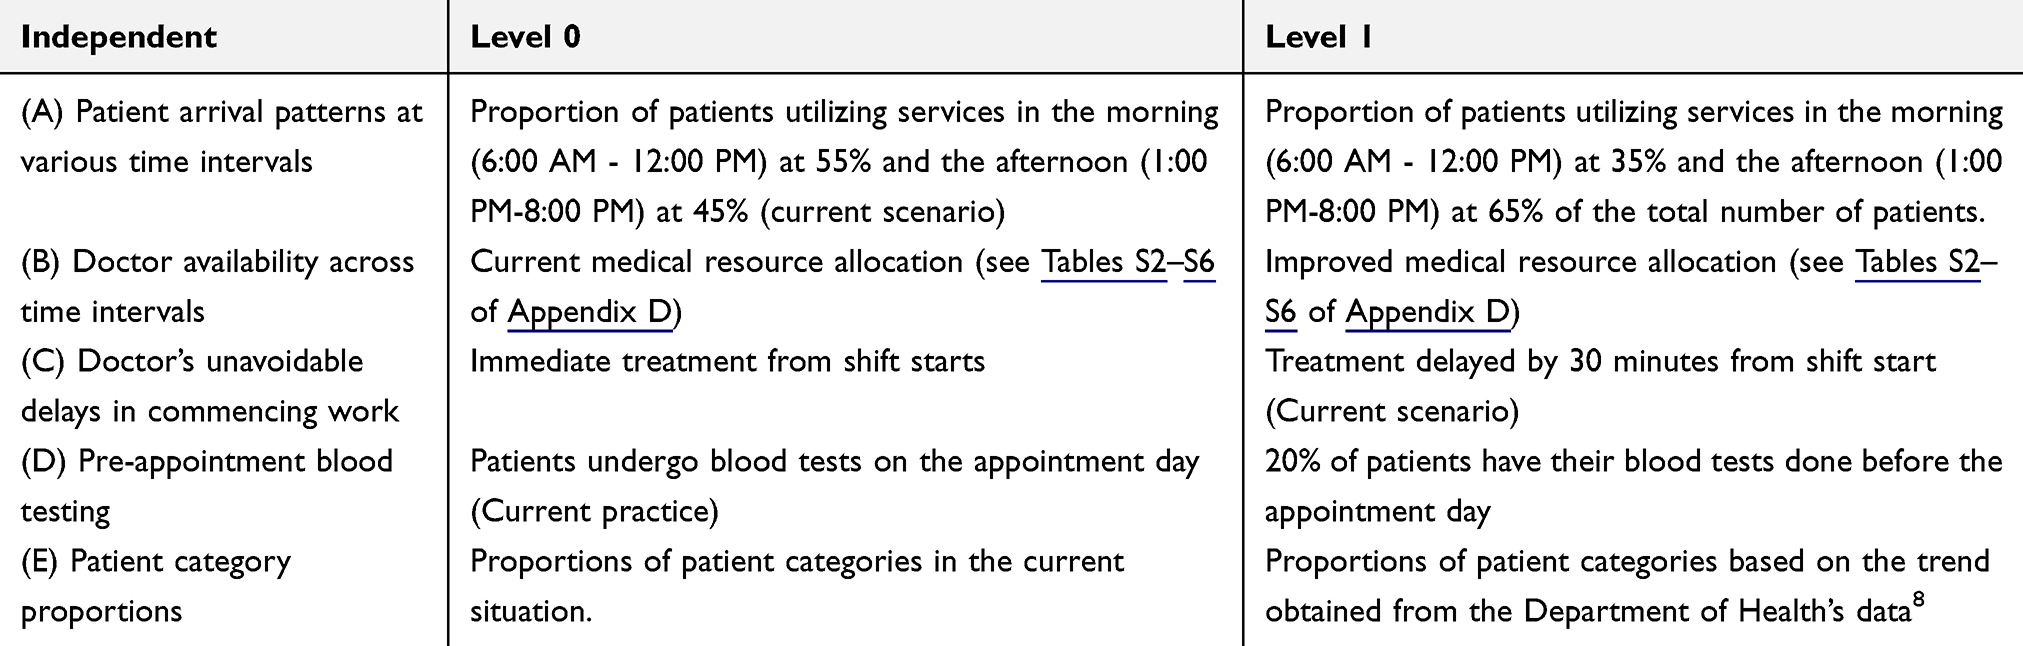 |
Table 3 Independent Variables and Their Level |
Results
In this section, we divided our analysis into three parts: simulation-based analysis of current operational performance, full factorial experiment results, and sensitivity analysis. The findings are outlined as follows:
Simulation-Based Analysis of Current Operational Performance
Based on the results from the Arena simulation program, the mean turnaround time in the OPD of the MED clinic, including waiting time, is 155.39 (152.03–158.73) minutes. The minimum and maximum mean turnaround time are 136.66 and 163.05 minutes, respectively. The clinic serves a mean of 898 (884.8–911.2) patients per week. The mean waiting time is 97.41 (93.94–100.88) minutes. Most of this waiting time is spent waiting to see the doctor in various units. The detailed queue length and waiting times to see the doctor and turnaround time at each unit are presented in Table 4.
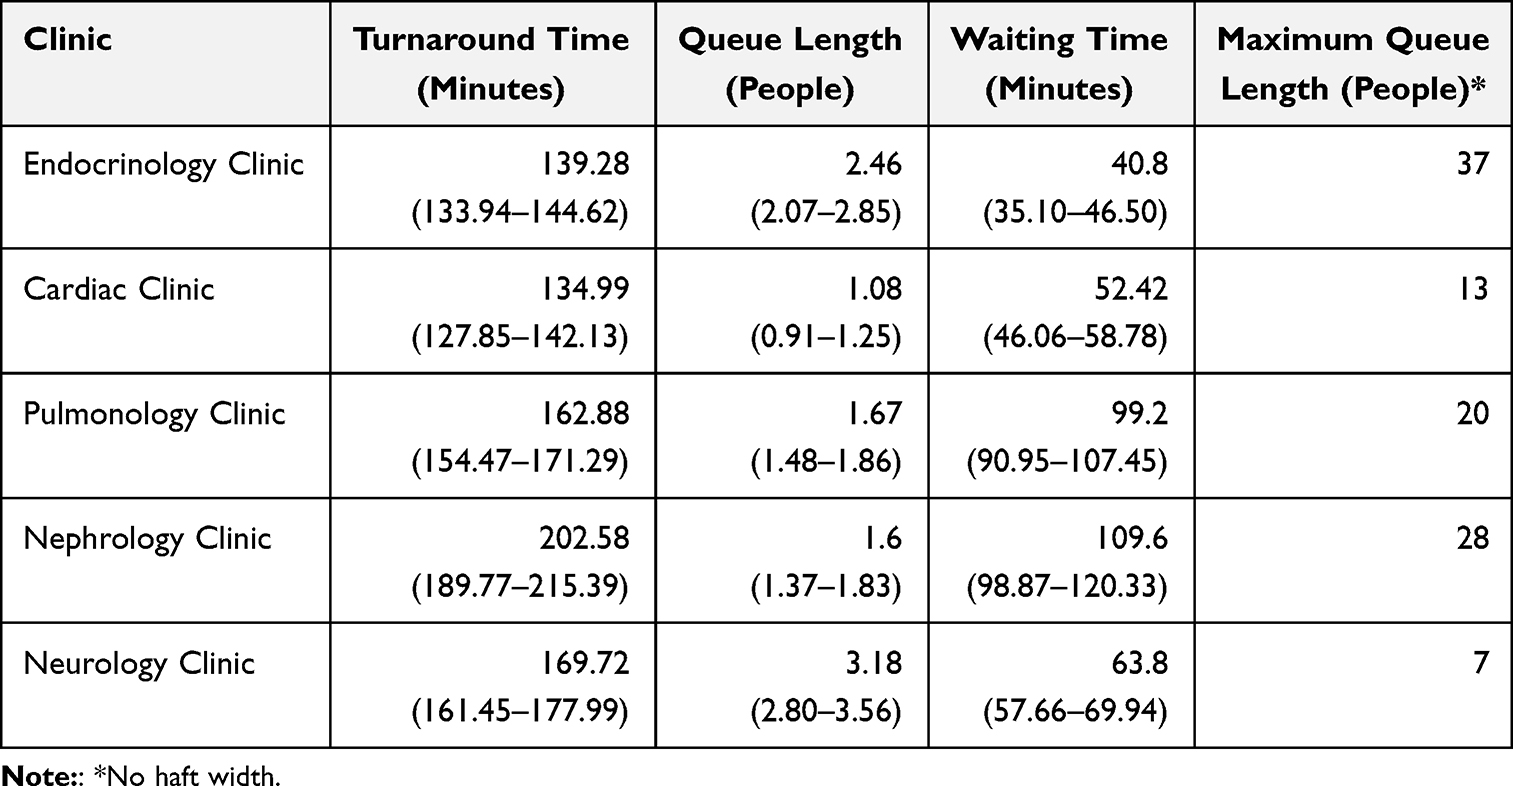 |
Table 4 Mean Queue Length and Waiting at Each Clinic, 95% Confidence Interval |
The table indicates varying performance across clinics. The endocrinology clinic, despite a maximum queue of 37 patients, maintains a relatively low mean waiting time of 40.8 minutes, reflecting efficient processing. In contrast, the cardiac clinic shows a short mean queue of 1.08 but a higher waiting time of 52.42 minutes, likely due to longer consultations. The pulmonology clinic has a waiting time of 99.2 minutes with a queue length of 1.67, suggesting scheduling inefficiencies. The nephrology clinic experiences delays, with a mean waiting time of 109.6 minutes and a maximum queue of 28, possibly due to treatment complexity. Although the neurology clinic has the smallest maximum queue (7 patients), it shows a high mean waiting time of 63.80 minutes and the longest turnaround time of 169.72 minutes, indicating prolonged service duration despite lower congestion.
This critical finding led to the creation of a mean queue length diagram (Figure 5), based on 16 simulation replications, to pinpoint the days and times when congestion occurs. Figure 5 highlights ten key bottleneck points across various clinics, indicating specific periods and locations where delays are most significant, as shown by the red boxes in the figure These insights were used to guide brainstorming sessions with staff and doctors to assess the feasibility of enhancing doctor availability. The high waiting times during doctor consultations suggest resource bottlenecks and inefficiencies in patient flow. Variations in turnaround time stem from unpredictable patient arrivals, inconsistent doctor schedules, and differences in case complexity. These factors influence consultation duration, diagnostic needs, and treatment planning time. The 10 identified critical points underscore the need for strategic resource adjustments. By addressing congestion at specific times and locations, hospitals can reduce waiting times and enhance patient satisfaction. This information was used to guide improvements in doctor availability across time intervals (Factor B). The modified scheduling, developed through collaborative discussions with staff, is designed to better align resource availability with demand. Details of the revised medical resource allocation plan are provided in Appendix D and are applied in the subsequent simulation phase to evaluate system performance improvements.
 |
Figure 5 Average queue length diagram representing the current system state (The red box indicates the focused bottleneck). |
Full Factorial Experiment Results
After executing all simulation scenarios and analyzing the data in Minitab, ANOVA results are summarized in Table 5. ANOVA was chosen for its effectiveness in identifying significant differences in turnaround time across multiple experimental conditions and evaluating both main effects and interactions. This method provided insights into which individual factors and factor combinations most influenced turnaround time, aiding targeted operational improvements. The experiment yielded a mean turnaround time of 187.58 minutes, with a variance of 31.83 and a 95% confidence interval ranging from 160.60 to 213.07 minutes. These values reflect the average total service time across various factor levels and help quantify performance variability. The confidence interval offers a reliable estimate for expected service times, enabling hospital administrators to make informed decisions. Overall, ANOVA played a critical role in isolating high-impact variables, supporting data-driven adjustments to outpatient processes for improved efficiency and patient experience.
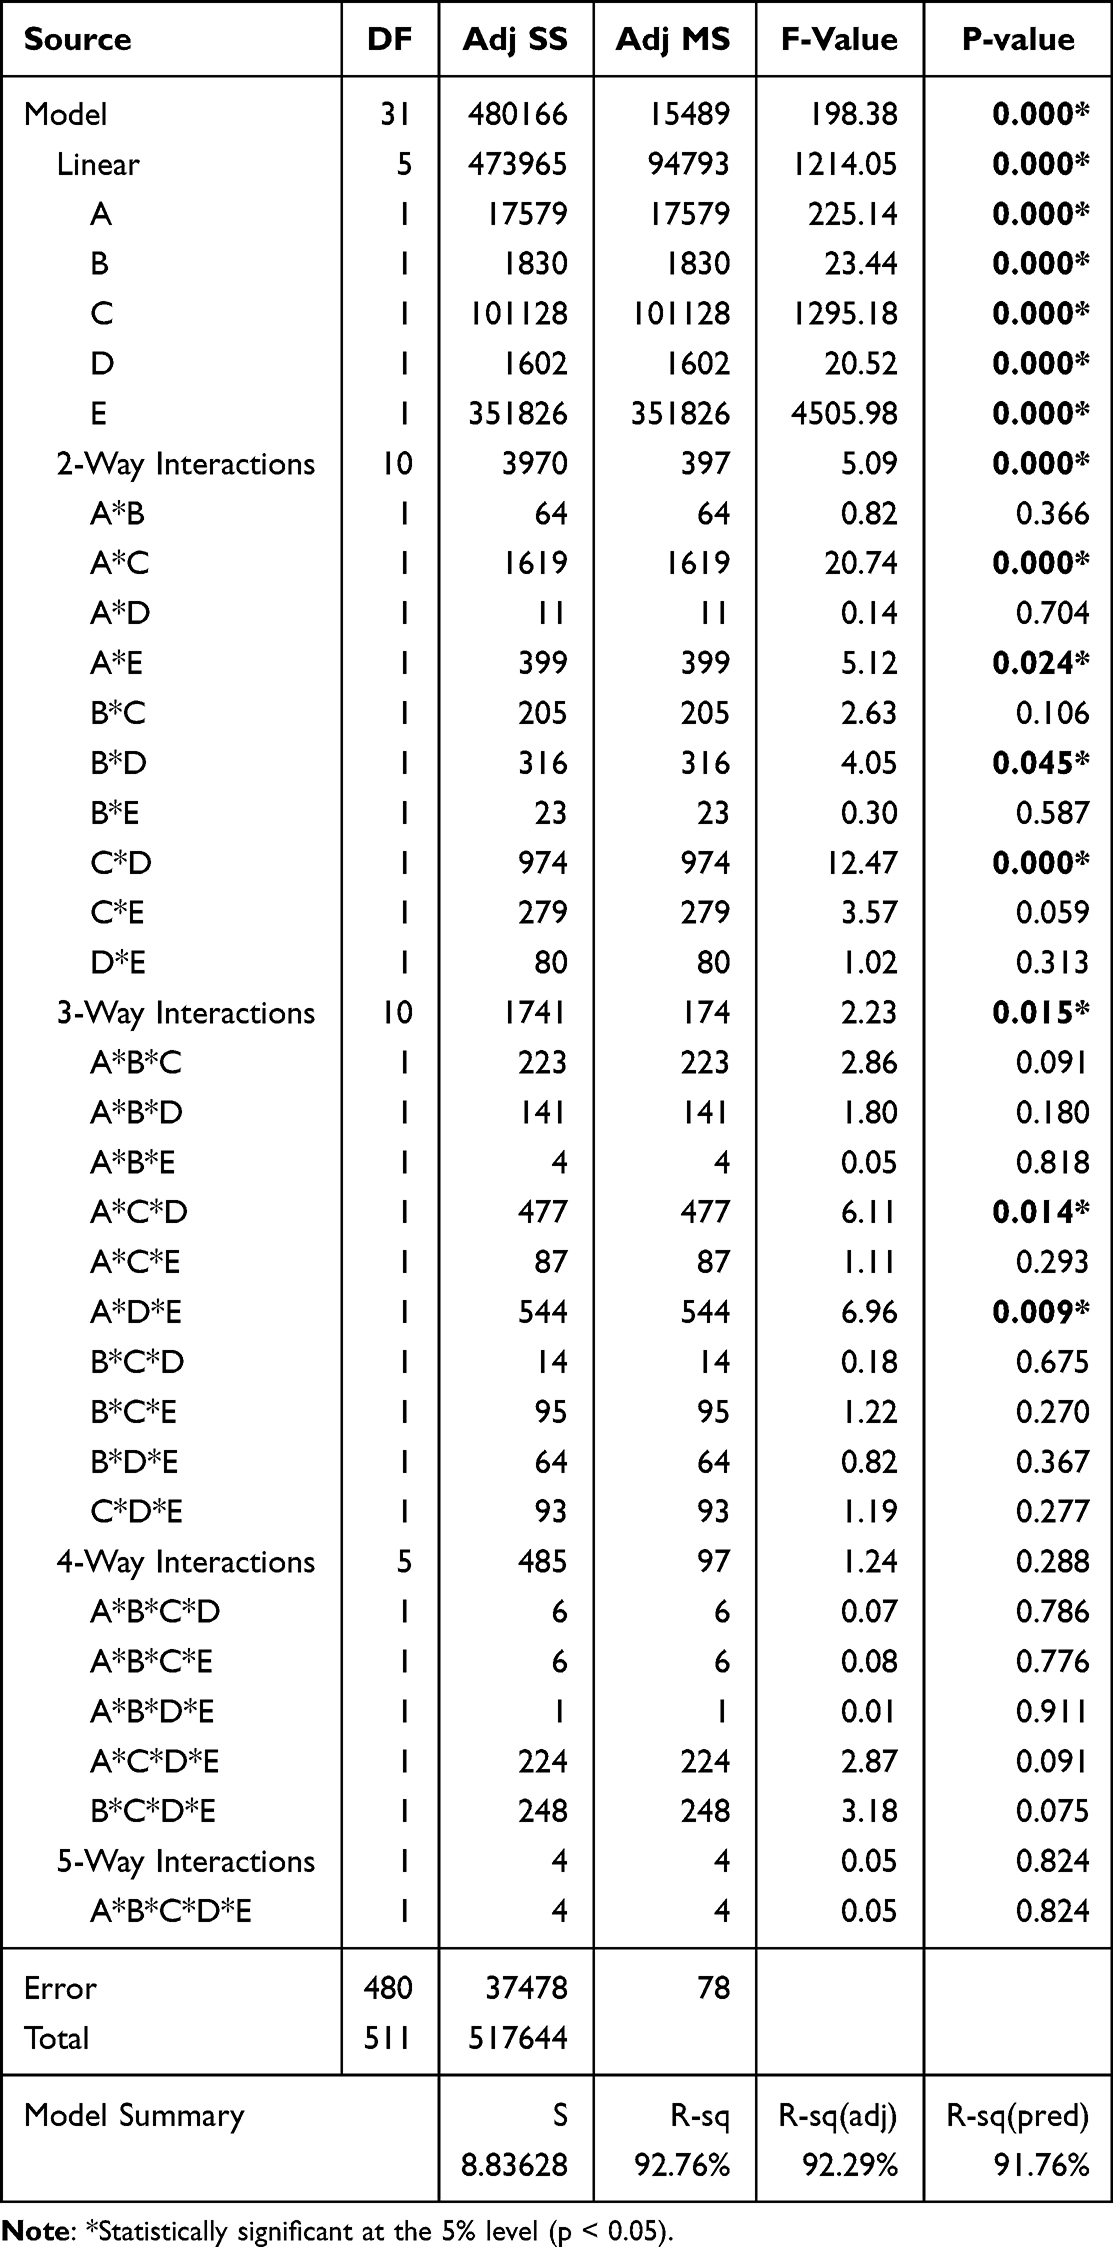 |
Table 5 ANOVA Analysis of Significant Factors. A = Patient Arrival Patterns; B = Doctor Availability; C = Unavoidable Doctor Delay; D = Pre-Appointment Blood Tests; E = Patient Categories |
The research findings, presented in Table 5 and supported by Figure 6, show that all five main factors significantly influence turnaround time at the 95% confidence level. Two factors, in particular, were associated with notable increases in turnaround time: a 30-minute delay in treatment commencement (C), which added 28.11 minutes, and changes in patient category proportions based on Department of Health data (E), which increased turnaround time by 52.43 minutes. Conversely, three factors contributed to reduced turnaround time: shifting 35% of patients to the morning and 65% to the afternoon (A) led to an 11.72-minute reduction, improved doctor availability across time intervals (B) resulted in a 3.78-minute reduction, and having 20% of patients complete pre-appointment blood testing (D) shortened the time by 3.54 minutes. Figure 6 also illustrates the relative effect of each factor. Patient category proportions (E) had the steepest slope, indicating the highest impact, followed by delays in doctor start times (C), patient arrival distribution (A), resource allocation (B), and blood testing practices (D). These results provide a clear hierarchy for prioritizing interventions. Although changes in patient category proportions cannot be directly controlled, the insights gained from this study are vital for proactive capacity planning. As demographic and disease trends evolve, hospitals can adjust their staffing and resource allocations accordingly to maintain efficiency and service quality.
 |
Figure 6 Effect of the main factors on the mean turnaround time. |
Operationally, the most critical takeaway is the negative effect of delayed doctor availability and misaligned patient arrival patterns. Delays in starting consultations can cause cascading bottlenecks throughout the system, impacting all subsequent appointments. To address this, hospitals should explore strategies such as enforcing punctual start times and encouraging off-peak scheduling. For instance, non-urgent or follow-up patients may be offered incentives—like shorter wait times or priority queuing—for booking in the afternoon, thereby helping redistribute patient loads. Furthermore, improving resource allocation—particularly doctor availability during peak times—ensures better alignment with patient flow. The inclusion of pre-appointment blood testing, especially for stable chronic patients, enables faster consultations and reduces turnaround time on the appointment day.
In summary, this study demonstrates that service efficiency in outpatient departments can be significantly improved by addressing key operational factors. Targeted strategies such as doctor punctuality, patient redistribution, and early diagnostics are essential for enhancing performance and patient satisfaction.
Analyzing factor interactions is essential for understanding their combined effects. The ANOVA results revealed four statistically significant two-way interactions, illustrated in Figure 7. Patient arrival patterns (A) significantly interacted with treatment start time (C) and patient category proportions (E), where early arrivals paired with timely treatment or current category proportions (AC, AE) notably reduced mean turnaround time. Additionally, pre-appointment blood testing (D) showed interactions with doctor availability (B) and treatment delays (C). However, the impact of D was minimal when combined with B or C (BD, CD), indicating that increasing pre-appointment testing beyond the current 20% offers limited benefit. Thus, maintaining the existing practice appears appropriate.
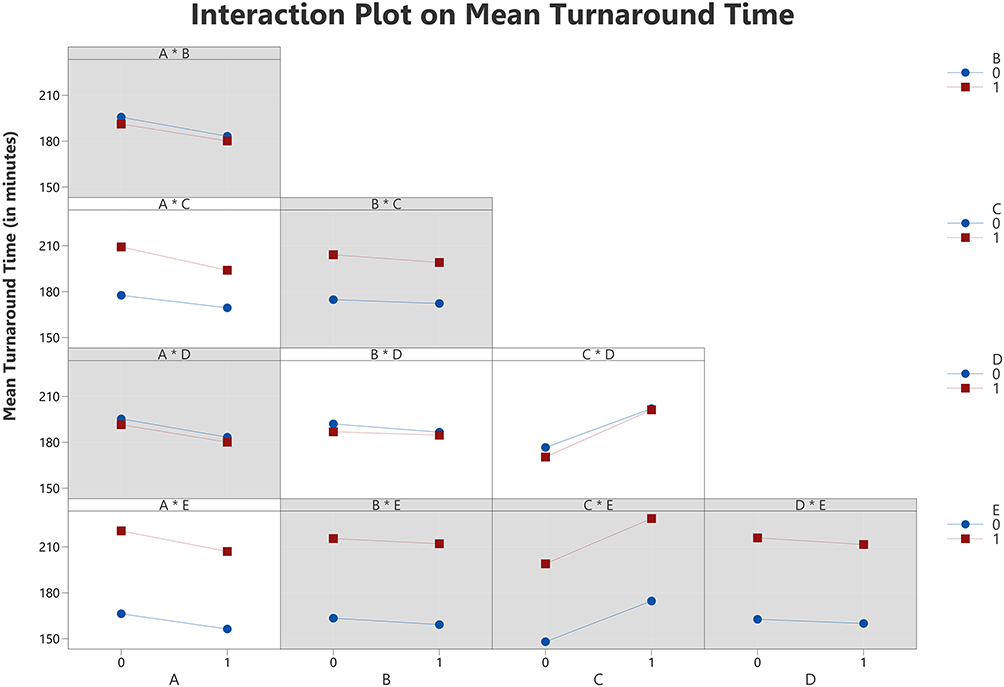 |
Figure 7 Effect of the double interactions on the mean turnaround time (A gray background represents a term not in the model). |
The ANOVA results revealed significant 3-way interactions at the 95% confidence level, particularly among the combinations A–C–D and A–D–E. These interactions underscore how coordinated strategies involving patient arrival patterns (A), treatment commencement timing (C), and pre-appointment blood testing (D) can jointly influence turnaround time. For instance, under current conditions—where 55% of patients arrive in the morning, treatment begins 30 minutes late, and blood tests are performed on the same day—turnaround time increases due to peak-hour congestion and testing delays. However, distributing arrivals more evenly, initiating treatment on time, and having 20% of patients undergo pre-appointment testing significantly reduce delays, highlighting the synergistic impact of multiple adjustments.
Similarly, the A–D–E interaction illustrates that aligning operational strategies with patient demographics enhances efficiency. In the current setup—morning-heavy arrivals, no pre-appointment testing, and unchanged patient categories—turnaround time rises due to workload imbalance and delays in urgent case handling. Adjusting arrival distributions and adopting pre-appointment testing for non-urgent patients can alleviate this, though changes in patient demographics, such as increased endocrinology or cardiology cases (Health Care Center, 2024), may offset gains unless resources are properly reallocated.
These 3-way interactions highlight the importance of a holistic approach that integrates patient flow, treatment readiness, and demographic trends. While no 4-way interactions were statistically significant, the identified 2-way and 3-way interactions provide valuable insights for system optimization. Including interaction plots and actionable recommendations in the manuscript will support healthcare administrators in translating these findings into targeted strategies. Understanding how multiple factors interact enables more accurate planning, supports efficient resource utilization, and ultimately improves service quality and patient outcomes.
Figure 8 presents the pareto chart of standardized effects, illustrating the relative importance of each factor by dividing its absolute effect size by the standard error. This allows for comparison across factors on a uniform scale. The chart identifies 11 statistically significant terms—E, C, A, B, AC, D, CD, ADE, ACD, AE, and BD—exceeding the 95% confidence interval threshold marked by the vertical line at 1.96. Patient category proportions (E) have the strongest influence, while the 2-way interaction between doctor availability (B) and pre-appointment blood testing (D) has the smallest significant effect at the 5% level.
 |
Figure 8 Pareto chart of the standardized effects. |
To identify the best-performing configuration, a regression model was generated using only statistically significant terms, as shown in Equation (2). This model served as the basis for using the Response Optimizer in Minitab software, which calculated the optimal combination of input factor settings to minimize mean turnaround time. An optimization plot, shown in Figure 9, visualizes the impact of each factor on turnaround time.
 |
Figure 9 Response optimization for the minimization of turnaround time. |
Mean turnaround time = 187.576+5.860A°-5.860A1+1.891B°-1.891B1-14.054C°+14.054C1+1.769D°-1.769D1-26.214E°+26.214E1-1.778AC00+ 1.778AC01+1.778AC10-1.778AC11-0.883AE00+0.883AE01+0.883AE10-0.883AE11+0.785BD00-0.785BD01-0.785B*D10+0.785BD11+1.379CD00-1.379CD01-1.379CD10+1.379CD11+0.965ACD000-0.965ACD001-0.965ACD010+0.965ACD011-0.965ACD100+0.965ACD101+0.965ACD110-0.965ACD111-1.031ADE000+1.031ADE001+1.031ADE010-1.031ADE011+1.031ADE100-1.031ADE101-1.031ADE110+1.031ADE111(2)
The optimal configuration sets factors A (Patient arrival patterns), B (Doctor availability), and D (Pre-appointment blood testing) at high levels (1), while C (Treatment commencement delays) and E (Patient category proportions) are set at low levels (0). Under this setting, the lowest predicted mean turnaround time is 139.79 minutes, with a 95% confidence interval of 137.12 to 142.46 minutes. The desirability score is 0.92, indicating that this solution closely meets optimization goals (a value of 1 represents the ideal scenario). Compared to the baseline mean turnaround time of 155.39 minutes, the optimal solution yields a 10.46% reduction, demonstrating the value of system-level adjustments. Based on these findings, five key recommendations are proposed to enhance outpatient service efficiency in the internal medicine (MED) clinic:
- Redistribute appointments to reduce morning congestion. A 35:65 morning-to-afternoon ratio aligns with staffing realities, as mornings are often constrained by doctors’ inpatient duties. This reduces crowding and balances workload with available medical resources.
- Adding medical staff at the 10 critical time slots identified earlier significantly decreases delays and queue build-up, directly improving turnaround time.
- Delaying treatment start by 30 minutes increases mean turnaround time by 28.11 minutes (from 155.39 to 192.50 minutes). Supporting doctors to begin promptly at shift start is essential for operational efficiency.
- Encouraging 20% of patients to complete blood tests before their visit reduces turnaround time by 3.54 minutes (from 155.39 to 151.85 minutes), helping expedite diagnostics and treatment.
- The Response Optimizer suggests that maintaining current patient category proportions leads to better performance. A shift toward increased cardiovascular or respiratory patients may lengthen turnaround times. Hospitals should monitor such trends and prepare flexible resource plans accordingly.
These findings demonstrate that combining data-driven optimization with practical scheduling and staffing strategies can significantly enhance the efficiency of outpatient services.
Sensitivity Analysis
Based on the study of turnaround time in the OPD MED clinic of a Thai hospital, policymakers expressed particular interest in Factor E, which reflects the number of patients in each medical category. To explore its impact, this study tested scenarios under current operating conditions while increasing the number of patients in each category by 20% individually. The goal was to observe which category most significantly affects the mean total system time when its volume increases. This analysis involved six scenarios, with only one category increased per run while keeping others constant (see Table 6). Simulations were conducted for each scenario, and the results were statistically compared using One-way ANOVA. The null hypothesis stated that all scenarios would yield the same mean turnaround time, while the alternative assumed that at least one differs. At a significance level (α) of 0.05, the test produced a p-value < 0.05, leading to rejection of the null hypothesis, indicating that at least one scenario significantly differs.
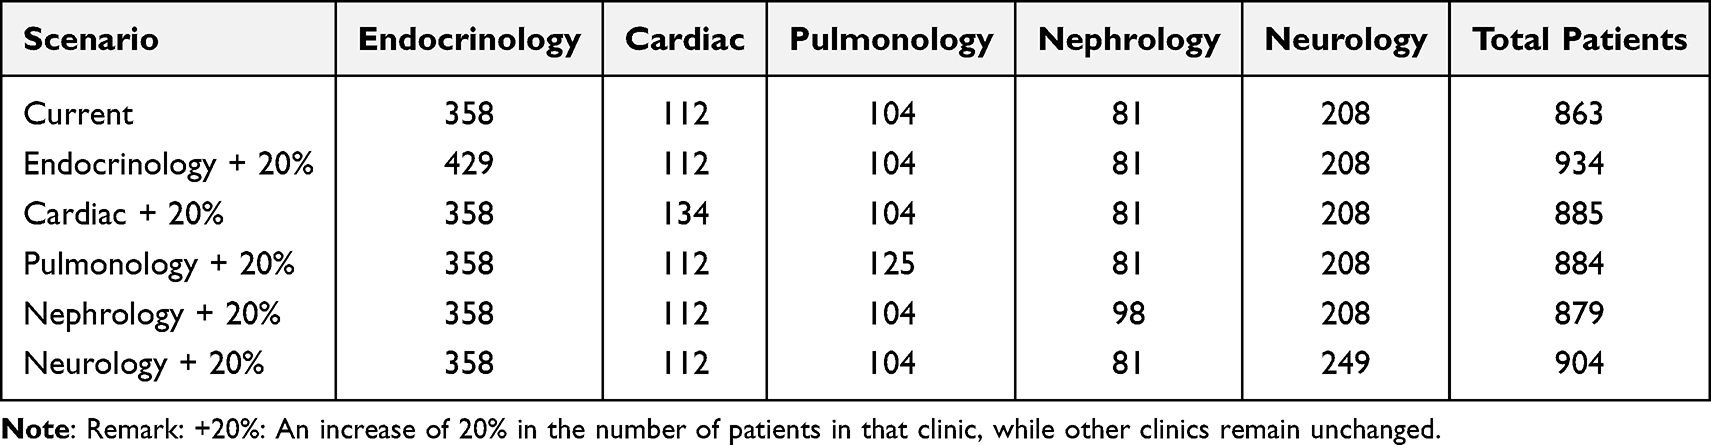 |
Table 6 Six Scenarios for Increasing the Number of Patients in Each Category |
Figure 10 illustrates the scenarios with an increased number of patients in the endocrinology clinic and neurology clinic by 20%, which significantly increased the mean turnaround time by 14.61 (9.56–19.68) minutes and 10.77 (5.71–15.83) minutes, respectively. On the other hand, the mean turnaround time for scenarios with an increased number of patients in the cardiac clinic, pulmonology clinic, and nephrology clinic by 20% did not show any significant difference from the current situation at α = 0.05.
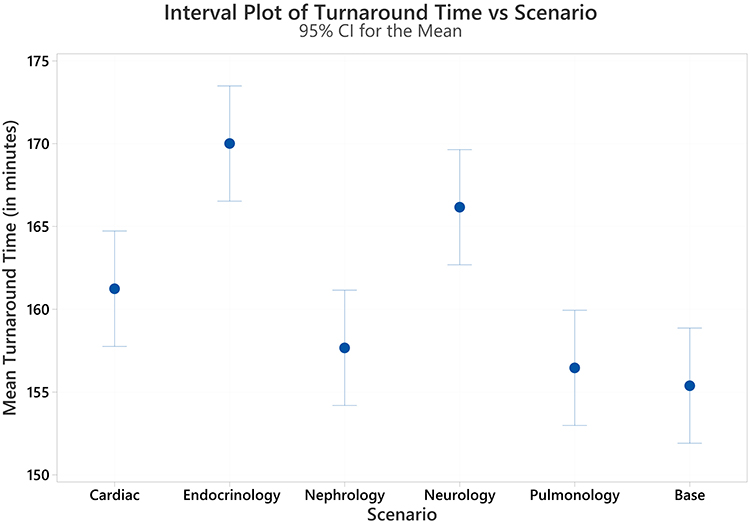 |
Figure 10 Interval plot mean turnaround time in each scenario (The pooled standard deviation is used to calculate the intervals). |
To explore the significant differences among factor levels following the ANOVA results, three post hoc analyses—Tukey’s Honestly Significant Difference (HSD), Fisher’s Least Significant Difference (LSD), and Dunnett’s test—were applied. Tukey’s HSD was used for all pairwise comparisons to provide a broad view of factor-level differences. Fisher’s LSD offered a more sensitive analysis to detect subtle differences, while Dunnett’s test was employed to specifically compare each treatment scenario against the baseline (current system) to identify statistically significant improvements. These analyses enhance the reliability and practical understanding of the simulation outcomes.
As shown in Table 7, Tukey’s HSD divided the scenarios into three groups (A, B, and C), with Group A showing the highest mean turnaround time and Group C showing no significant difference from the current system. Fisher’s LSD test identified four groups, where Group D included scenarios (pulmonology and nephrology patient increases) not significantly different from the current condition. Meanwhile, Dunnett’s test confirmed that only the 20% patient increases in the endocrinology and neurology clinics led to significant rises in turnaround time, while increases in the pulmonology, cardiac, and nephrology clinics did not differ significantly from the current situation.
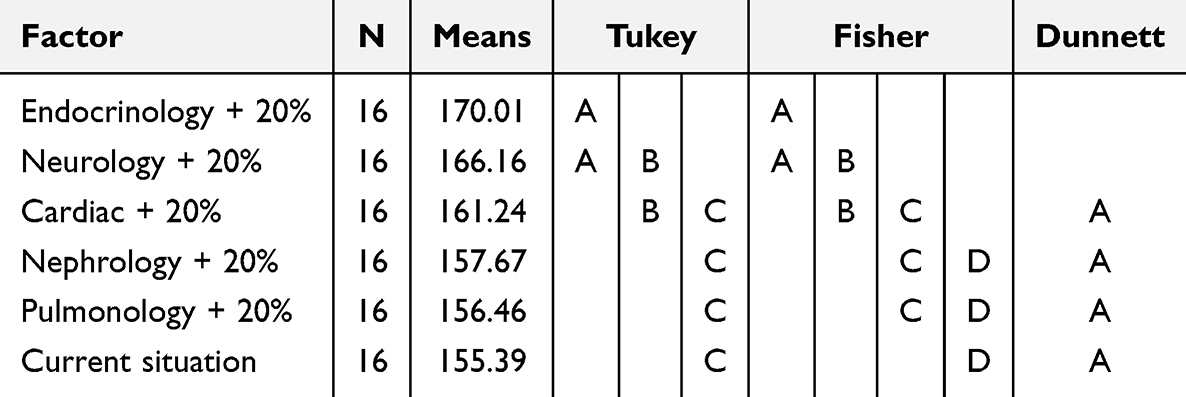 |
Table 7 Group Comparison Using Tukey’s HSD, Fisher’s LSD, and Dunnett’s Tests |
These consistent findings across methods affirm that increased demand in endocrinology and neurology strains the system more than in other departments. However, Fisher’s LSD, being more sensitive, flagged the cardiac clinic increase as significant—a result not echoed by the more conservative Tukey or Dunnett tests. This discrepancy reflects each method’s level of adjustment for multiple comparisons. While the primary recommendations remain unchanged, the cardiac clinic should still be monitored, especially under scenarios exceeding the modeled 20% increase. Decision-makers may consider resource reallocation or improved scheduling to accommodate future demands.
In conclusion, patient increases in the endocrinology and neurology clinics significantly elevated turnaround times—by 14.61 (9.56–19.68) and 10.77 (5.71–15.83) minutes, respectively. These findings highlight the importance of closely monitoring these departments to sustain outpatient system performance. The group comparison graphics that support these results are presented in Figures S11–S13 of Appendix E.
Discussions and Analysis
This section presents a comprehensive discussion of the results, including a summary of practical interventions, a comparison with real-time optimization approaches, and key managerial insights. It also outlines the limitations of the current study and proposes directions for future research. The details are structured as follows.
Discussions
This study underscores the importance of effective planning and operational management in enhancing service efficiency in the OPD MED clinic of a Thai hospital. By integrating DES with DOE, the study analyzes how different patient, activity, and resource-related factors influence the mean turnaround time. The ANOVA results revealed 11 significant terms—including main effects and interactions—offering actionable insights to support turnaround time reduction.
- Balancing patient appointments between morning and afternoon sessions significantly reduces congestion, lowering the mean turnaround time by 11.72 minutes (95% CI: 6.28–17.16). This finding supports previous literature that strategic arrival scheduling improves patient flow and mitigates overcrowding.4 Policymakers are encouraged to restructure appointments—eg, allocating 35% in the morning and 65% in the afternoon—to align demand with staffing availability.
- Doctor availability during peak periods emerged as a critical factor. Bottleneck analysis (Figure 5) and collaborative discussions with staff revealed opportunities to add physicians during high-demand intervals. However, these changes must be balanced with staff preferences for predictable schedules. Solutions include voluntary shift changes, advanced notice, and offering part-time benefits. Aligning resource planning with patient volume trends not only improves system performance but also fosters staff satisfaction, echoing earlier studies emphasizing synchronized resource-patient alignment.23
- A 30-minute delay in doctors starting their shifts leads to an average 28.11-minute (95% CI: 23.16–33.06) increase in turnaround time. This significant impact supports findings by Vahdat et al.23 Solutions include reinforcing punctuality through clear policies, incentives, and real-time tracking systems. Hospitals should also explore digital scheduling tools and shift handover protocols to minimize delays.
- Encouraging 20% of patients to complete blood tests before their appointment day reduced turnaround time by 3.54 minutes (95% CI: −1.98 to 9.04). This efficiency gain supports the findings of Gabriel et al and Pan et al22,40 To expand this benefit, hospitals could pilot pre-appointment diagnostics (eg, X-rays or MRI scans), ensuring results are ready before consultation. Automated reminders and streamlined booking systems will enhance uptake.
- Patient category distribution is the most influential factor affecting system performance. Increases in endocrinology and neurology cases significantly prolonged turnaround times. While hospitals cannot control patient composition, they must adapt through dynamic capacity planning. Predictive analytics can help forecast category trends (eg, seasonal surges or aging populations) and inform staffing adjustments. Proactively managing these shifts will ensure service efficiency even under changing demand conditions.43
This study further emphasizes the importance of understanding complex interactions between key operational factors in improving service efficiency at the OPD MED clinic. Interaction analysis revealed how combinations of elements—such as patient arrival patterns, doctor availability, and unavoidable delays—amplify their collective impact on turnaround time and queue lengths. These insights are vital for designing effective, data-driven policies to optimize healthcare delivery.
The ANOVA results identified several significant 2-way and 3-way interactions. For instance, when a large number of patients arrive in the morning while doctor availability is delayed, queue lengths increase sharply, leading to longer turnaround times. Recognizing these interaction effects enabled clinic administrators to better coordinate doctor schedules with peak patient arrival times and implement strategies to mitigate delays, such as staggered shifts or real-time availability monitoring. These adjustments helped balance patient flow across the day and reduce bottlenecks in critical service windows.
Beyond identifying interaction effects, sensitivity analysis and pairwise comparison tests further informed decision-makers about the impact of varying patient category proportions and resource allocation strategies. Simulated adjustments showed that changes in patient composition—especially increases in high-demand specialties like endocrinology and cardiology—require dynamic resource reallocation. This prompted consideration of flexible staffing plans and cross-trained personnel to ensure service quality even as demand shifts. For example, a rise in endocrinology patients could be managed by reallocating part-time staff or expanding appointment slots in that clinic.
In this study, univariate sensitivity analysis was used to examine the effect of individual variables on turnaround time, helping to identify the most influential parameters in the system. While the DOE framework captured key multivariate interactions through ANOVA and interaction plots, an explicit multivariate sensitivity analysis (eg, Monte Carlo or global sensitivity methods) was not conducted. Future research could explore these techniques to validate and strengthen the generalizability of the model across different outpatient settings and under more dynamic assumptions.
The integration of ANOVA interaction analysis, sensitivity testing, and pairwise comparisons provided hospital administrators with valuable, actionable insights. These tools enabled them to optimize scheduling and staffing policies, reduce patient waiting times, and enhance overall system performance. We expanded this section in the manuscript to highlight the model’s practical utility, demonstrating how its findings directly support real-world operational decision-making in hospital outpatient departments.
Finally, the number of simulation replications is a key factor in ensuring result reliability. Following Pisuchpen and Chansangar’s guidance,46 the selected replication counts balanced statistical stability and computational feasibility. While additional replications could narrow confidence intervals and enhance precision, our results remain consistent and robust. Future studies may consider increasing replication counts to further reinforce confidence in simulation outcomes without incurring excessive computational cost.
These insights can be translated into actionable policies to enhance operational efficiency and patient outcomes for the hospital case study.
- The findings highlight the complex relationships between patient arrival patterns, pre-appointment blood testing, and patient category proportions. To address this, the hospital should adopt predictive analytics tools to forecast demand and develop adaptive scheduling systems. This ensures a balanced distribution of appointments and better resource alignment with patient needs, particularly for high-demand specialties.
- Doctor availability and patient category proportions significantly affect turnaround time. To mitigate this, the hospital should design strategic staffing policies that match peak demand periods and patient specialty loads. Flexible scheduling, shift redistribution, and cross-training programs can help maintain service levels while accommodating staff preferences and ensuring equitable workloads.
- Doctor delays were shown to cause major increases in turnaround time. Thus, punctuality must be enforced through clear policies, real-time monitoring, and a combination of incentives and penalties. Hospitals should invest in awareness campaigns and training programs to reinforce the impact of timely attendance on system performance.
Based on the comprehensive strategies, these will facilitate a more efficient, patient-centered healthcare delivery system at the OPD MED clinic of the hospital case study, aligning resources with patient demands and promoting a higher standard of care.
Building on the above findings, we propose practical interventions that can be directly implemented in hospital workflows. These interventions are grounded in both the simulation results and feedback from hospital stakeholders, as summarized below.
Summary of Practical Interventions
In response to the operational issues identified through DES–DOE analysis, this study proposes several actionable interventions aimed at improving patient flow and reducing turnaround time. These include: (1) staggering appointment schedules to reduce congestion during peak hours, (2) introducing policy incentives for physician punctuality and real-time shift monitoring, (3) encouraging pre-appointment diagnostics such as blood tests and X-rays, and (4) implementing patient-category-based scheduling policies to align staff availability with consultation complexity and duration. These interventions are not only derived from the optimized experimental scenarios but also validated through stakeholder feedback, ensuring their feasibility within the hospital’s resource and policy constraints. This integrated approach strengthens the practical value of our model, offering a replicable decision-support framework for healthcare leaders seeking to implement targeted improvements based on empirical data.
Comparison with Real-Time Optimization Approaches
While our DES–DOE approach provides valuable insights for strategic outpatient workflow design, recent studies emphasize the benefits of real-time optimization. Munavalli et al16,18 proposed intelligent scheduling systems using hybrid ant-agent and multi-agent models to dynamically route patients and allocate resources based on real-time department status, significantly reducing waiting and cycle times. Their later work16,18 extended this by applying AI for hospital-wide feedback regulation, transforming systems into closed-loop, adaptive environments. Similarly, Munavalli et al17 introduced predictive resource planning based on Takt time to align resources with fluctuating demand, improving short-term responsiveness. Stone et al59 demonstrated that setting timed targets and standardizing workflow communication can streamline emergency admissions and reduce overall hospital delays. These works suggest that combining simulation-based planning with real-time feedback mechanisms could offer a robust pathway toward both proactive and adaptive healthcare operations. Future work could extend our model by integrating such real-time scheduling capabilities to enhance responsiveness in dynamic clinical environments.
Managerial Insights
Integrating DES and DOE offers crucial managerial insights for improving outpatient services. Managers can identify peak demand periods, allocate resources more effectively, and test intervention strategies to reduce waiting times and enhance patient satisfaction. By understanding patient arrival patterns and improving doctor availability, coupled with interventions like pre-appointment diagnostics, our approach provides actionable recommendations that align with the operational goals of healthcare institutions.
The integrated approach also promotes continuous monitoring and improvement of healthcare processes. Managers should adopt a culture of continuous improvement, regularly reviewing performance metrics and experimenting with different configurations to enhance service delivery. Leveraging simulation software and other technological tools supports real-time data collection, patient tracking, and predictive analytics, streamlining operations and improving patient satisfaction.
By improving resource utilization and reducing delays, the integrated approach enhances healthcare efficiency, ensuring more streamlined operations without compromising quality. Ultimately, this approach fosters a patient-centered environment, leading to better patient outcomes and satisfaction.
Limitations and Future Research
This study focuses on optimizing outpatient services at the MED clinic of a Thai hospital using an integrated DES and DOE approach. While the framework offers valuable insights into patient flow and resource management, its generalizability requires customization for different healthcare settings. Factors such as local demographics, operational structures, and resource constraints should be carefully adapted to ensure relevance and effectiveness.
A key operational issue is early patient arrival. Many patients arrive before 06:00 AM, well ahead of the official 08:00 AM start time, leading to increased turnaround time and inefficiency. To mitigate this, hospitals could implement staggered appointment systems, early check-in policies, or pre-scheduling to better distribute patient flow and reduce congestion.
Pre-appointment diagnostics, although useful in shortening consultation-day waits, may create new bottlenecks in laboratory services. Since these tests are hospital-based, their increased demand can strain lab capacity, especially on certain days. Our simulation model accounts for such shifts in workload by distributing resource demand across multiple days. Future work could explore policies like dedicated lab slots, predictive scheduling, or test-day balancing to optimize lab resource use.
Patient punctuality also affects doctor availability and clinic efficiency. Delays in patient arrivals may lead to underutilized consultation slots. Implementing digital check-ins, appointment reminders, and punctuality policies could help improve alignment between scheduled and actual arrivals. Further research could examine interventions to improve patient adherence to appointment times and quantify their effects on system performance.
The model’s regression-based results are tailored to the specific factor levels examined in this study. Any modification to those factors or their ranges would require re-running simulations to maintain accuracy. Incorporating additional variables—such as patient no-show rates or varying staff skill levels—could further improve model realism and decision-making precision.43
Some service times in the simulation were assumed to be constant due to limited data availability. Future research should consider gathering expert input or applying probabilistic distributions (eg, triangular or normal) to better represent service variability. Missing timestamp data also posed a challenge—particularly for process completions. While this did not impact patient arrival patterns, improving data completeness using imputation techniques (eg, regression imputation or ML-based methods) could enhance simulation accuracy.
To broaden the model’s applicability, integrating real-time analytics and machine learning could improve forecast accuracy. Predictive models such as random forests or neural networks can forecast patient arrivals, while clustering algorithms can support dynamic resource allocation.60 Coupling DES with multi-objective optimization techniques would further enable exploration of trade-offs between efficiency, cost, and service quality.61,62
Beyond operational metrics, future studies should consider patient-centered outcomes such as satisfaction, communication quality, and overall care experience. Embedding such qualitative dimensions into simulation models would provide a more comprehensive view of healthcare service quality. Additionally, incorporating sentiment analysis from surveys or real-time feedback tools could support patient-driven process improvements.63
Scalability is another important direction. Future research should adapt the DES–DOE framework for diverse settings—urban, rural, and specialized clinics. Addressing context-specific constraints will improve model flexibility and ensure broader impact across the healthcare system.
This study was conducted as part of a Quality Improvement (QI) initiative at the Faculty of Medicine, Chiang Mai University. According to the university’s Ethics Exemption Policy (Announcement 2567, Section 2.9), studies using anonymized secondary data are exempt from formal ethical review. All data used in this study were anonymized and aggregated before analysis, with no personal identifiers. No direct patient involvement or intervention occurred. Staff feedback was obtained through routine operational discussions and verbal agreement under QI protocol. Official approval for data access was obtained via letter No. อว 8393(14)/3071.
Ultimately, fostering a culture of continuous improvement is key. Hospitals can regularly review operational metrics, experiment with new workflows, and integrate simulation, analytics, and patient insights into decision-making. These strategies will enable more responsive, data-driven healthcare systems. Future research building on this model can further enhance outpatient care through targeted, evidence-based interventions.
Conclusions
This study underscores the strategic value of integrating DES with DOE as a leadership tool to drive operational improvements in outpatient care. Applied within the MED clinic of a Thai public hospital, this hybrid approach enabled healthcare leaders to assess and optimize key operational variables—such as patient arrival patterns, physician availability, consultation delays, pre-appointment blood testing, and shifting patient category proportions. The simulation-informed experimentation revealed a potential 10.46% reduction in patient turnaround time, emphasizing the critical role of data-driven decision-making in enhancing service delivery. The findings have been translated into practical, stakeholder-validated interventions—including staggered appointment scheduling, physician punctuality policies, pre-appointment diagnostics, and patient-category-based resource allocation—offering a realistic roadmap for outpatient clinic improvement. Importantly, the study promotes transparency, repeatability, and adaptability in modeling complex clinical workflows. For healthcare administrators and policymakers, this framework offers a replicable model for informed resource allocation and performance enhancement, supporting a leadership-driven culture of continuous improvement in patient-centered care.
Acknowledgments
This research work was partially supported by Chiang Mai University.
Disclosure
The author(s) report no conflicts of interest in this work.
References
1. Boonmee C, Kasemset C, Phongthiya T. Layout design of outpatient department: simulation study and implementation. Logforum. 2022;18(2):185–196. doi:10.17270/J.LOG.2022.677
2. Emsamrit N, Boonmee C. Mixed-Integer Linear programming for scheduling of radiotherapy patients. Eng Appl Sci Res. 2024;51(1):106–116. doi:10.14456/easr.2024.12
3. Khan HTA, Addo KM, Findlay H. Public health challenges and responses to the growing ageing populations. Public Health Chall. 2024;3(3). doi:10.1002/puh2.213
4. Rethmana A, Almasdy D, Burhan IR. Factors affecting waiting time for outpatient prescription services in BPJS patients at the pharmacy installation of the m natsir solok regional general hospital year 2022. Int J Res Rev. 2024;11(3):1–15. doi:10.52403/ijrr.20240301
5. Baril C, Gascon V, Vadeboncoeur D. Discrete-event simulation and design of experiments to study ambulatory patient waiting time in an emergency department. J Oper Res Soc. 2019;70(12):2019–2038. doi:10.1080/01605682.2018.1510805
6. Aroua A, Abdulnour G. Optimization of the emergency department in hospitals using simulation and experimental design: case study. Procedia Manuf. 2018;17:878–885. doi:10.1016/j.promfg.2018.10.140
7. Benmachiche M, Gertsch M, Giordano F, Claivaz V. Patients en situation complexe aux soins intermédiaires de médecine interne. Exemple d’interprofessionnalité. Rev Med Suisse. 2022;18(805):2213–2217. doi:10.53738/REVMED.2022.18.805.2213
8. Health Data Center. Outpatient service utilization rate classified by rights group. Health Data Center.
9. Marion I, Power D. 161 mapping and analysing outpatient clinics for a quality improvement. Age Ageing. 2023;52(Supplement_3). doi:10.1093/ageing/afad156.146
10. Huang SW, Weng SJ, Chiou SY, et al. A study on decision-making for improving service efficiency in hospitals. Healthcare. 2024;12(3):405. doi:10.3390/healthcare12030405
11. Latukha OA, Son IM, YuI B, Kalinichenko AV, Pushkareva EA, Tolstova KS. Quality balanced scorecard for the outpatient clinic. Cardiovasc Ther Prev. 2024;22(9S):3809. doi:10.15829/1728-8800-2023-3809
12. Hosseini M, Gittler AM, Erdman A, Sisco D, Khasawneh MT. Patient flow redesign in a hospital lobby: combining discrete event simulation and multi-criteria decision analysis. In: Global Joint Conference on Industrial Engineering and Its Application Areas; 2024:117–140. doi:10.1007/978-3-031-54868-0_11
13. Lamidi S, Olalere R, Yekinni A, Adesina K. Design of Experiments (DOE): applications and benefits in quality control and assurance. In: Quality Control and Quality Assurance-Techniques and Applications. 2024. doi:10.5772/intechopen.113987
14. Yawut N, Leksakul K, Vichiansan N, Wichitthanabodee P, Boonyawan D, Leksakul S. Impact of plasma-generated reactive oxygen and nitrogen species (RONS) on apoptosis induction in LN229 cells. Biomed Signal Process Control. 2026;111:108399. doi:10.1016/j.bspc.2025.108399
15. Yawut N, Leksakul K, Vichiansan N, Boonyawan D, Mekwilai T. Approach to enhancing myoblast cell proliferation through plasma jet stimulation for the design of lab-grown meat. J Agric Food Res. 2025;19:101718. doi:10.1016/j.jafr.2025.101718
16. Munavalli JR, Rao SV, Srinivasan A, van Merode G. Integral patient scheduling in outpatient clinics under demand uncertainty to minimize patient waiting times. Health Informatics J. 2020;26(1):435–448. doi:10.1177/1460458219832044
17. Munavalli JR, Rao SV, Srinivasan A, Manjunath U, van Merode GG. A robust predictive resource planning under demand uncertainty to improve waiting times in outpatient clinics. J Health Manag. 2017;19(4):563–583. doi:10.1177/0972063417727627
18. Munavalli JR, Rao SV, Srinivasan A, van Merode G. An intelligent real-time scheduler for out-patient clinics: a multi-agent system model. Health Informatics J. 2020;26(4):2383–2406. doi:10.1177/1460458220905380
19. Li L, Diouf F, Gorkhali A. Managing outpatient flow via an artificial intelligence enabled solution. Syst Res Behav Sci. 2022;39(3):415–427. doi:10.1002/sres.2870
20. Atalan A, Dönmez CC. Optimizing experimental simulation design for the emergency departments. Braz J Oper Prod Manag. 2020;17(4):1–13. doi:10.14488/BJOPM.2020.026
21. Vahdat V, Griffin J, Stahl JE. Decreasing patient length of stay via new flexible exam room allocation policies in ambulatory care clinics. Health Care Manag Sci. 2018;21(4):492–516. doi:10.1007/s10729-017-9407-5
22. Gabriel GT, Campos AT, Magacho de AL, et al. Lean thinking by integrating with discrete event simulation and design of experiments: an emergency department expansion. PeerJ Comput Sci. 2020:6:e284. doi:10.7717/peerj-cs.284
23. Weerawat W, Pichitlamken J, Subsombat P. A generic discrete-event simulation model for outpatient clinics in a large public hospital. J Healthc Eng. 2013;4(2):285–306. doi:10.1260/2040-2295.4.2.285
24. Boonmee C, Kosayanon A, Chitapanarux I, Kasemset C. Radiotherapy service improvement: simulation study. Ind Eng Manag Syst. 2021;19(4):758–773. doi:10.7232/iems.2020.19.4.758
25. Marin-Garcia JA, Vidal-Carreras PI, Garcia-Sabater JJ. The role of value stream mapping in healthcare services: a scoping review. Int J Environ Res Public Health. 2021;18(3):951. doi:10.3390/ijerph18030951
26. Boonmee C, Akarawongsapat K, Wisittipanich W, Chattinnawat W, Khwanngern K. Differential evolution for cleft lip and/or cleft palate patient treatment scheduling problems: a northern Thailand hospital case study. Ann Oper Res. 2024;335(1):563–595. doi:10.1007/s10479-023-05769-6
27. Mazzocato P, Stenfors-Hayes T, von Thiele Schwarz U, Hasson H, Nyström ME. Kaizen practice in healthcare: a qualitative analysis of hospital employees’ suggestions for improvement. BMJ Open. 2016;6(7):e012256. doi:10.1136/bmjopen-2016-012256
28. Boonmee C, Kasemset C. The improvement of healthcare management in Thailand via IE tools: a survey. In:
29. Chalk D. Using computer simulation to model the expansion needs of the ambulatory emergency care unit at Derriford Hospital. Future Healthc J. 2020;7(1):60–64. doi:10.7861/fhj.2019-0017
30. Gunal MM. A guide for building hospital simulation models. Health Systems. 2012;1(1):17–25. doi:10.1057/hs.2012.8
31. Teymourifar A. Simulation-based optimization for resectorization in healthcare systems. J Simul. 2024;18(3):311–330. doi:10.1080/17477778.2022.2152395
32. Demir E, Yakutcan U, Page S. Using simulation modelling to transform hospital planning and management to address health inequalities. Soc Sci Med. 2024;347:116786. doi:10.1016/j.socscimed.2024.116786
33. Ngaorungsi T, Chutima P. Operational process improvement for outpatient services at a private medium-sized hospital. Eng J. 2024;28(2):29–65. doi:10.4186/ej.2024.28.2.29
34. Rasoli N, Sheikhalishahi M. Modeling and simulation to improve patient admission process: a case study in an educational and treatment hospital. Simulation. 2024. doi:10.1177/00375497241267304
35. Taleb M, Khalid R, Ramli R, Nawawi MKM. An integrated approach of discrete event simulation and a non-radial super efficiency data envelopment analysis for performance evaluation of an emergency department. Expert Syst Appl. 2023;220:119653. doi:10.1016/j.eswa.2023.119653
36. Thamtrakul W, Boonmee C. Application of simulation technique for outpatient’s average total time improvement. In:
37. Majid B, Pasha Abgarmi H, Yousefi S, Alizadeh A, Mahmoudzadeh H. Simulation-based optimization for improving hospital performance. Int J Hosp Res. 2017;6(2):72–84.
38. Atalan A. Central composite design optimization using computer simulation approach. 2014. Available from: https://api.semanticscholar.org/CorpusID:15856448.
39. Baesler FF, Jahnsen HE, DaCosta M. The use of simulation and design of experiments for estimating maximum capacity in an emergency room. In:
40. Pan C, Zhang D, Kon AWM, Wai CSL, Ang WB. Patient flow improvement for an ophthalmic specialist outpatient clinic with aid of discrete event simulation and design of experiment. Health Care Manag Sci. 2015;18(2):137–155. doi:10.1007/s10729-014-9291-1
41. Chand S, Moskowitz H, Norris JB, Shade S, Willis DR. Improving patient flow at an outpatient clinic: study of sources of variability and improvement factors. Health Care Manag Sci. 2009;12(3):325–340. doi:10.1007/s10729-008-9094-3
42. Jahangiri S, Abolghasemian M, Ghasemi P, Chobar AP. Simulation-based optimisation: analysis of the emergency department resources under COVID-19 conditions. Int J Ind Syst Eng. 2023;43(1):1. doi:10.1504/IJISE.2023.128399
43. Corsini RR, Costa A, Fichera S, Pluchino A, Parrinello V. System design of outpatient chemotherapy oncology departments through simulation and design of experiments. Int J Manag Sci Eng Manag. 2024;19(1):15–28. doi:10.1080/17509653.2022.2134223
44. Arman B, Farzaneh A, Behnoosh M. Simulation modeling for evaluation of the patients’ queue system performance at emergency department. Res Sq. 2021.
45. Dehlendorff C, Kulahci M, Andersen KK. Designing simulation experiments with controllable and uncontrollable factors for applications in healthcare. J R Stat Soc Ser C Appl Stat. 2011;60(1):31–49. doi:10.1111/j.1467-9876.2010.00724.x
46. Pisuchpen R, Chansangar W. Modifying production line for productivity improvement: a case study of vision lens factory. Songklanakarin J Sci Technol. 2014;36(3):345–357.
47. Monks T, Currie CSM, Onggo BS, Robinson S, Kunc M, Taylor SJE. Strengthening the reporting of empirical simulation studies: introducing the STRESS guidelines. J Simul. 2019;13(1):55–67. doi:10.1080/17477778.2018.1442155
48. Russell RB. Simulation experiments: designing simulation experiments. In:
49. Chiu DT, Stenson BA, Alghamdi M, Antkowiak PS, Sanchez LD. The association between day of arrival, time of arrival, daily volume and the rate of patients that left without being seen. Am J Emerg Med. 2023;67:24–28. doi:10.1016/j.ajem.2023.02.006
50. Natchaya L. Patient’s waiting time reduction in outpatient department. Chulalongkorn university; 2013.
51. Umar MI, Adehi MU, Auwal AM. An investigation of multi-server queuing analysis to assess hospital healthcare systems’ operational effectiveness. Asian J Probab Stat. 2024;26(3):80–89. doi:10.9734/ajpas/2024/v26i3601
52. Azad N, Armstrong C, Depue C, Crimmins TJ, Touson JC. An application of computable biomedical knowledge to transform patient centered scheduling. Learn Health Syst. 2023;7(4). doi:10.1002/lrh2.10393
53. Tyagi M, Tyagi PK, Singh S, et al. Impact of application of queuing theory on operational efficiency of patient registration. Med J Armed Forces India. 2023;79(3):300–308. doi:10.1016/j.mjafi.2021.06.028
54. Grot M, Kugai S, Degen L, Wiemer I, Werners B, Weltermann BM. Small changes in patient arrival and consultation times have large effects on patients’ waiting times: simulation analyses for primary care. Int J Environ Res Public Health. 2023;20(3):1767. doi:10.3390/ijerph20031767
55. Bansal C, Bansal M, Narang M, Goyal S, Bansal P. Technical expertise and behavior of the doctor- a major determinant of waiting time of OPD patients. Int J Community Med Public Health. 2023;10(2):677–681. doi:10.18203/2394-6040.ijcmph20230220
56. Tattsbridge J, Hang S, Aukland A, Abdelrahman S. SP8.9 pre-operative blood tests in abscess patients: audit and cost analysis. Br J Surg. 2023;110(Supplement_6). doi:10.1093/bjs/znad241.095
57. McDonald CE, Granger CL, Louie J, Tran T, Remedios LJ. Health information and resources in hospital outpatient waiting areas may not meet the needs of older adults from culturally and linguistically diverse backgrounds: a cross‐cultural qualitative study. Health Info Libr J. 2024;42(1):96–113. doi:10.1111/hir.12534
58. Wood RM, Dumlu ZO, Forte PG. A systems approach can help improve patient flow in the NHS this winter and beyond. Future Healthc J. 2023;10(1):93–94. doi:10.7861/fhj.Let.10.1.1
59. Stone B, Cooley A, Reese C, Lucas M, Signorino M, Obisesan O. Goal-driven timed target workflow: optimizing the workflow for emergency department to inpatient admission. J Emerg Nurs. 2025;51(5):988–996. doi:10.1016/j.jen.2025.03.023
60. Xu M, Wong TC, Chin KS. Modeling daily patient arrivals at emergency department and quantifying the relative importance of contributing variables using artificial neural network. Decis Support Syst. 2013;54(3):1488–1498. doi:10.1016/j.dss.2012.12.019
61. Lin CKY, Ling TWC, Yeung WK. Resource allocation and outpatient appointment scheduling using simulation optimization. J Healthc Eng. 2017;2017:1–19. doi:10.1155/2017/9034737
62. Boonmee C, Pisutha-Arnond N, Chattinnawat W, Muangwong P, Nobnop W, Chitapanarux I. Decision support system for radiotherapy patient scheduling: Thai cancer center case study. In:
63. Nabbuye-Sekandi J, Makumbi FE, Kasangaki A, et al. Patient satisfaction with services in outpatient clinics at Mulago hospital, Uganda. Int J Qual Health Care. 2011;23(5):516–523. doi:10.1093/intqhc/mzr040
 © 2025 The Author(s). This work is published and licensed by Dove Medical Press Limited. The
full terms of this license are available at https://www.dovepress.com/terms
and incorporate the Creative Commons Attribution
- Non Commercial (unported, 4.0) License.
By accessing the work you hereby accept the Terms. Non-commercial uses of the work are permitted
without any further permission from Dove Medical Press Limited, provided the work is properly
attributed. For permission for commercial use of this work, please see paragraphs 4.2 and 5 of our Terms.
© 2025 The Author(s). This work is published and licensed by Dove Medical Press Limited. The
full terms of this license are available at https://www.dovepress.com/terms
and incorporate the Creative Commons Attribution
- Non Commercial (unported, 4.0) License.
By accessing the work you hereby accept the Terms. Non-commercial uses of the work are permitted
without any further permission from Dove Medical Press Limited, provided the work is properly
attributed. For permission for commercial use of this work, please see paragraphs 4.2 and 5 of our Terms.