")
Back to Journals » Risk Management and Healthcare Policy » Volume 15
Data-Driven Dynamic Adjustment and Optimization Model of Emergency Logistics Network in Public Health
Authors Zheng J, Bao F, Shen Z , Xu C
Received 19 November 2021
Accepted for publication 13 January 2022
Published 2 February 2022 Volume 2022:15 Pages 151—169
DOI https://doi.org/10.2147/RMHP.S350275
Checked for plagiarism Yes
Review by Single anonymous peer review
Peer reviewer comments 2
Editor who approved publication: Dr Jongwha Chang
This paper has been retracted
Jijie Zheng,1 Fuguang Bao,2– 4 Zhonghua Shen,2 Chonghuan Xu4,5
1Hangzhou Business School, Zhejiang Gongshang University, Zhejiang, Hangzhou, 311503, People’s Republic of China; 2School of Management Science & Engineering, Zhejiang Gongshang University, Hangzhou, 310018, People’s Republic of China; 3Contemporary Business and Trade Research Center, Zhejiang Gongshang University, Hangzhou, 310018, People’s Republic of China; 4Academy of Zhejiang Culture Industry Innovation & Development, Zhejiang Gongshang University, Hangzhou, 310018, People’s Republic of China; 5School of Business Administration, Zhejiang Gongshang University, Hangzhou, 310018, People’s Republic of China
Correspondence: Fuguang Bao, Email [email protected]
Background and Aim: In the long-term prevention of the COVID-19 pandemic, parameters may change frequently for various reasons, such as the emergence of mutant strains and changes in government policies. These changes will affect the efficiency of the current emergency logistics network. Public health emergencies have typical unstructured characteristics such as blurred transmission boundaries and dynamic time-varying scenarios, thus requiring continuous adjustment of emergency logistics network to adapt to the actual situation and make a better rescue.
Practical Significance: The infectivity of public health emergencies has shown a tendency that it first increased and then decreased in the initial decision-making cycle, and finally reached the lowest point in a certain decision-making cycle. This suggests that the number of patients will peak at some point in the cycle, after which the public health emergency will then be brought under control and be resolved. Therefore, in the design of emergency logistics network, the infectious ability of public health emergencies should be fully considered (ie, the prediction of the number of susceptible population should be based on the real-time change of the infectious ability of public health emergencies), so as to make the emergency logistics network more reasonable.
Methods: In this paper, we build a data-driven dynamic adjustment and optimization model for the decision-making framework with an innovative emergency logistics network in this paper. The proposed model divides the response time to emergency into several consecutive decision-making cycles, and each of them contains four repetitive steps: (1) analysis of public health emergency transmission; (2) design of emergency logistics network; (3) data collection and processing; (4) adjustment and update of parameters.
Results: The result of the experiment shows that dynamic adjustment and update of parameters help to improve the accuracy of describing the evolution of public health emergency transmission. The model successively transforms the public health emergency response into the co-evolution of data learning and optimal allocation of resources.
Conclusion: Based on the above results, it is concluded that the model we designed in this paper can provide multiple real-time and effective suggestions for policy adjustment in public health emergency management. When responding to other emergencies, our model can offer helpful decision-making references.
Keywords: public health emergencies, emergency logistics network, data-driven, dynamic adjustment, interactive evolution
Introduction
In recent years, the outbreaks of all kinds of large-scale and unconventional public health emergencies, such as SARS (2003), Avian Influenza (2004), Influenza A HIN1 (2009), European E. coli Public Health Emergencies (2011), The Ebola epidemic in West Africa (2015) and COVID-2019 epidemic (2019), have not only posed a threat to human health and life but also exerted a negative impact on social and economic development. The Ebola epidemic in West Africa (2015), for example, caused a total death toll of more than 11,300, more than 28,500 confirmed and suspected cases, and the economic losses reached more than USD (United States dollar) 35 billion.1 As for the theoretical research on public health emergency management, SARS in 2003 directly promoted the construction of a multinational health emergency management system. Therefore, how to predict the transmission and evolution of public health emergencies and how to design a dispatch plan of emergency materials based on the predicted regulation became two mainstream issues in public health emergency management at that time.2 Thanks to the joint efforts of several world-class universities since 2009, scholars have realized that a purely predictive response mode is still a kind of passive emergency management. Only proactive actions can help people do a better rescue in the emergency. Thereby, the “scenario-response” theory of emergency management3 has been put forward and applied into emergency management rapidly.4 In the first three months of 2020, the COVID-19 epidemic spread quickly from Hubei Province to the rest parts of China. National Health Commission of the People’s Republic of China (NHC) said, as of March 21st, 31 provinces (including autonomous regions and municipalities directly under the Central Government) and the Xinjiang Production and Construction Corps had reported 81,054 confirmed cases and 72,244 cured cases in total. There were 67,800 confirmed cases in Hubei Province, accounting for over 83% of the overall confirmed cases. It shows that Hubei Province, especially Wuhan City, had always been the top priority in epidemic prevention and control.5 According to the World Health Organization (WHO), as of April 2, China had 871,765 confirmed cases and 127,053 cured cases. Countries such as Italy, the United States, Germany, and Iran were suffering from severe shortages of medical supplies. However, as with most emergencies, the scheduling of public health emergency supplies is not just a matter of decision-making urgency. It involves non-structural difficulties such as fuzzy boundaries and dynamic time-varying scenario.
The long existence of the global COVID-19 pandemic can bring many practical problems. In the long-term prevention of the pandemic, the emergence of mutant strains as well as changes in government policies will affect the parameters of the epidemic transmission model. Thus, the frequent changes of parameters caused by various factors should be taken seriously. Elavarasan et al6 believed that in the absence of specific drugs and vaccines, the long-term strategic management of the pandemic, which could be important to reduce infection, needed to be maintained until the virus was no longer found in humans. Razzaq Asif et al7 concluded that a rare positive fallout of COVID-19 was reducing environmental pressure, while higher environmental pollution led to increased vulnerability to COVID-19 cases. Iqbal et al8 concluded that a slight increase in air pollution had caused a sharp increase in the number of NCOV-2019 cases and deaths. Irfan et al9 analyzed the environmental problems indirectly caused by COVID-19, and some serious and uncontrollable environmental problems that may influence government decision-making. At the same time, the openness of governments and the willingness of individuals could influence people’s behaviour and thus the speed at which the pandemic spread. Ahmad et al10 explored the key intention-based factors that influenced the willingness of individuals to take precautions. In another study, Irfan et al11 believed that the public should be informed about the lethality of the pandemic, so that people could have a more accurate perception of the risk of the pandemic and be more willing to wear masks. The existing theoretical research on public health emergency logistics can be divided into two groups. The first is to study the design of the emergency materials dispatching network, and the other is to study the dynamic distribution of emergency materials, but current studies of these two groups often ignore the dynamic transmission rules and trends of infectious diseases, leading to the frequent shortage of resources in a specific practice. It can be seen that, when the transmission and evolution of public health emergency require time-varying adjustments, the existing emergency management theories and methods cannot meet the needs of emergency material dispatch. Therefore, further innovative design is urgently needed to obtain more accurate results. The main purpose of this paper is to provide a dynamic and real-time data analysis method for public health emergency management, so as to effectively provide suggestions for policy adjustments.
Literature Review
This part mainly focuses on analyzing the current research on the transmission of public health emergencies. Through the literature research on the dissemination of public health events and the summary of the existing methods, it can provide a theoretical basis for the follow-up dynamic demand prediction in emergency logistics and the adjustment of government control policies. The existing literature retrieval mainly discusses the analysis of public health emergencies transmission from two aspects. Firstly, based on the method of system dynamics, results are mainly in the field of Biomathematics, and the principle involved works to construct dynamics models for the transmission and evolution of public health emergencies. The common models of system dynamics include SI (Susceptible-Infectious) model, SIR (Susceptible-Infectious-Recovered) model, SEIR (Susceptible-Exposed-Infectious-Recovered) model, SIQR (Susceptible-Infectious-Quarantined-Recovered) model, SEIQR (Susceptible-Exposed-Infectious-Quarantined-Recovered) model, etc. In the construction of the model, the mathematical proof of the existence and stability of the equilibrium point of disease transmission are often involved.12 Secondly, based the method of regression analysis, results are mainly in the field of preventive medicine,13 and the principle involved works to establish a function expression of regression relation (regression equation) between a certain dependent variable and a certain independent variable by employing the method of mathematical statistics, which is made on the basis of a certain amount of observed data of a public health emergency.14 The common methods include linear regression, logistic regression, least squares regression, support vector regression, auto-regression, orthogonal regression, principal component regression, etc.15 In addition, from the perspective of the Evolutionary Game Theory, Liu16 established and discussed an equation of public health emergency transmission. The impact of the adjustment of government control policies is closely related to the transmission of public health emergencies HIN1 influenza.
This part mainly focuses on the studies of emergency logistics, including the theory of emergency logistics management, supply point setting, cost control in response to public health emergencies, and establishing the foundation for the dynamic adjustment model of emergency logistics management. The existing theoretical researches on emergency logistics for public health emergencies can be categorized into two groups. One is the research on the dispatch network design of emergency supplies, the other is research on the dynamic allocation of emergency supplies. For the dispatch network design of public health emergency supplies, the focus of the research is how to arrange emergency service facilities in a reasonable way, so as to effectively meet the urgent needs of patients in an event of the transmission of public health emergencies. For example, Ekici et al17 established a combined optimization model for public health emergency transmission and food distribution site selection, and designed a heuristic algorithm to solve large-scale practical problems. Based on the SIR infectious disease model, Zhang et al18 built a three-layer emergency logistics network model that includes three elements: supply, transit, and the stricken area. In this type of research, most models of infectious disease transmission are used to predict time-varying needs,19 and the dispatch network of emergency supplies is made based on those predictions.20 Besides, based on smallpox-based transmission models, Dasaklis et al21 constructed an optimization model of emergency supplies dispatch network under the condition of mass vaccination. As for the joint research on the early public health emergencies and emergency medical logistics networks, Dasaklis’s review article is a good reference.22 And for the dynamic allocation of emergency supplies, the focus of the research is that how to realize a dynamic allocation for best rescue while with limited emergency materials. There are several possible problems: the dynamic multi-regional vaccine distribution in the H1N1 epidemic,23 the HIV prevention and treatment in public health emergencies with limited government budget,24 the distribution of emergency supplies in H1N1 epidemic25 and the optimization of anti-influenza drug distribution in the flu transmission.26 Recently, Buyuktahtakin et al27 proposed an optimal site allocation model for emergency resource usage in response to Ebola public health emergencies in West Africa. Additionally, when it comes to the application of early operational optimization methods in the prevention and control of public health emergencies or infectious diseases, researchers are supposed to refer to the findings of Brandeau et al.28
Through the analysis of the above literature, we can find the shortcomings of the current study. The main problem is that current research mainly focuses on the dynamic allocation of emergency supplies under the condition of limited supplies while ignoring the rule of disease transmission, thus leading to a sudden strain or waste of resources. In addition, current research often neglects unstructured features such as dynamic time-varying scenes, and existing models cannot adapt to the real situation. Considering the fact that the evolution of public health emergencies generates new demands for real-time adjustments of emergency supplies distribution, this paper aims to construct an innovative decision-making framework model for emergency dynamic adjustment from a data-driven perspective. The structure is shown in Figure 1. In this decision-making framework, the response time to emergency is divided into several consecutive decision cycles (c = 1.2, ⋯, C), and each decision cycle (t = 1.2, ⋯, T) contains 4 successive steps, namely the analysis of public health incidents transmission, the design of emergency logistics network, data collection and processing, the adjustment and update of parameters. Through the iterative update of each cycle, the process of emergency response in the entire public health emergency is eventually transformed into a collaborative decision-making process of data learning and the optimization of resource allocation. In the actual emergency response process, decision-makers can continuously input real-time data of public health events into the decision-making framework model with interactive evolution. Then, a real-time adjustment plan for emergency resource scheduling in public health emergencies is obtained. Compared with the existing emergency network, the model designed in this paper has two obvious advantages: (1) The proposed model is fully integrated with ideas of data-driven modeling and it strives to realize the goal of real-time adjustments and optimization of emergency resource scheduling in public health emergencies which is different from the traditional optimization of one-time scheduling after disaster (2) The proposed model in this paper is not only designed for individual cases, but also for the emergency rescue of most public health emergencies (such as smallpox, Ebola, 2019 new coronavirus, etc.) due to its universality and scalability in providing a basic decision-making framework. Since this model involves the update of dynamic adjustment, the problem caused by it can be more difficult than that caused by the general one-time optimization model.
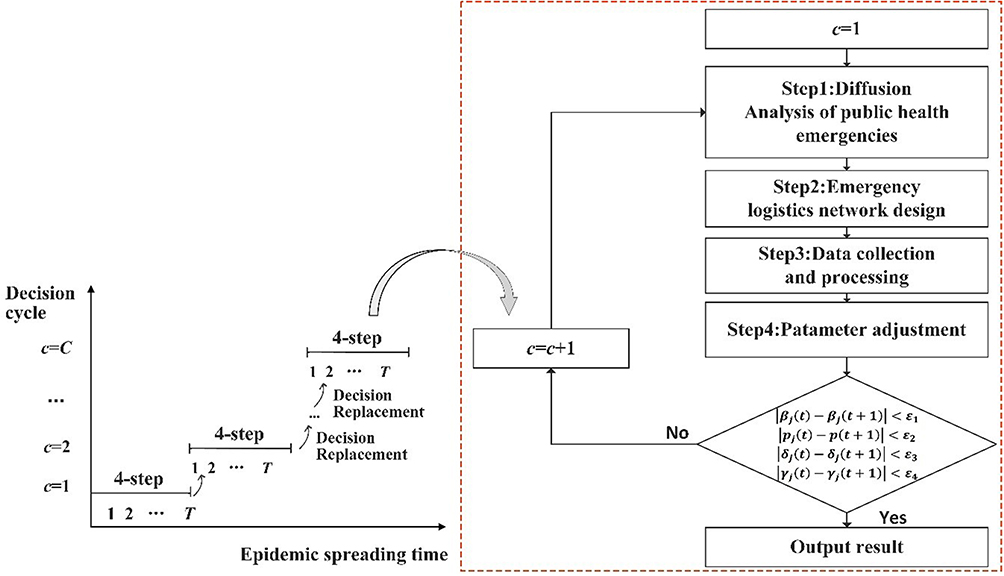 |
Figure 1 Decision-making framework model for emergency dynamic adjustment in public health emergencies. |
Model Construction
As shown in Figure 1, the decision-making framework model consists of four progressive decision-making progresses in each decision-making cycle. Among the four signs of progress, the dynamic analysis of the public health emergency transmission is adopted to demonstrate the evolution rule of the number of patients and their demands for emergency supplies. The logistics network is designed for the number, relative size, coverage of material distribution centers, the setting of optimal capacity in each infected area and the optimal allocation of emergency relief funds. Data collection is used to collect and process real-time data of public health emergencies. Parameter adjustment is designed to dynamically adjust and update the relevant parameters of the dynamics model of public health emergency transmission.
Analysis of the Transmission of Public Health Emergencies
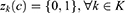
SEIAR compartmental model29 (as shown in Figure 2) is constructed based on the characteristics of H1N1 public health emergency transmission from 2009 to 2010. In this paper, the population in areas affected by public health emergencies is divided into five categories: the susceptible (S), the exposed (E), the infector (I), the asymptomatic carrier (A) and the rehabilitee (R). The susceptible enter the incubation period after contacting with infectors, and some of them showing noticeable symptoms enter the second stage as infectors. After a period of treatment, they recover and obtain immunity against H1N1, but some of the exposed show no distinct symptoms. Although large population movements may occur in the public health emergencies of H1N1, it is assumed that the population in the region is relatively stable based on the fact that the duration of the emergency is short.
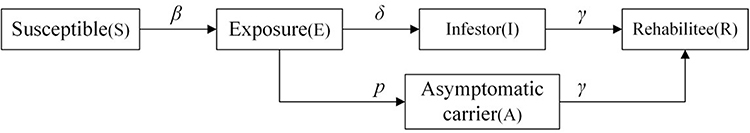 |
Figure 2 Model of public health emergencies transmission. |
The definition of symbols involved in the SEIAR model above is shown in Table 1.
 |
Table 1 Symbols and Definitions of Parameters in SEIAR Model |
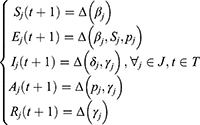
With reference to the symbols in Table 1, the transmission of public health emergencies in any decision cycle can be described as a system of difference equations as shown in Equations (1)-(5).


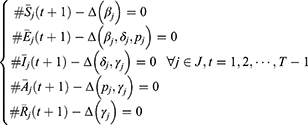
As shown in the above formulas, for any compartments, the number of people at the time of t + 1 is equal to the result of the number of people at the time of t pluses the number of people entering the compartment at the time of t and minuses the number of people removed from the compartment at the time of t. For example, the number of the infected at the time of t + 1 is  .
.  is equal to the result of that
  (the number of people at the time of t) pluses
  (the number of patients who entered the compartment at the time of t) and then minuses
  (the number of people recovering from treatment at the time of t). For simplicity, the above model is described as follows, where Δ represents the linear relationship among variables of any state.
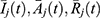
For any infected area, given the initial values of each compartment  ,
, ,
, ,
, ,
,  and other related parameter values, decision-makers can take the advantage of the above difference equations to analyze the transmission behavior of public health emergencies, and subsequently obtain the number of patients at any time within the decision period. Without the loss of generality, assuming that each patient’s daily demand for emergency medical supplies is m, then the total amount of emergency medical supplies required in the area is
  .
.
The Design of Emergency Logistics Network
In the research by Buyuktahtakin et al.,27 Ebola emergency medical centers can be divided into two types, namely the 30-bed and the 50-bed. In the responses to public health emergencies such as SARS and H1N1 influenza, China has set up emergency designated hospitals or treatment centers, each of which can accommodate different numbers of patients.
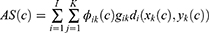
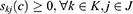
Therefore, in every decision-making cycle, the decision-maker should consider the following questions: (1) How many isolation beds should be set up in each infected area for patients? (2) How many emergency designated hospitals (EDH) with different capacities to accommodate patients should be combined together? (3) In the middle of the allocation process of emergency medical supplies, how many temporary regional distribution centers (RDC) should be prepared by the National Emergency Reserve Bank (SNS) for each infected area (In this paper, RDC is a temporarily rented large venue facility or compartment for the transfer of emergency medical supplies). (4) Which infected areas are the specific RDC responsible for? (5) What is the relative size of each RDC (the proportion of emergency materials undertaken by the RDC to the total amount of emergency materials is a key factor in determining the size of the RDC)? (6) Which SNS should emergency medical materials be distributed from? What is the supply ratio of each SNS? (7) What is the optimal emergency relief budget? From the perspective of optimization, question (1) is a typical problem concerning the optimization of capacity combination, questions (2)-(7) are about the allocation of emergency location. Therefore, definitions of symbols required for the model in this paper are shown in Table 2.
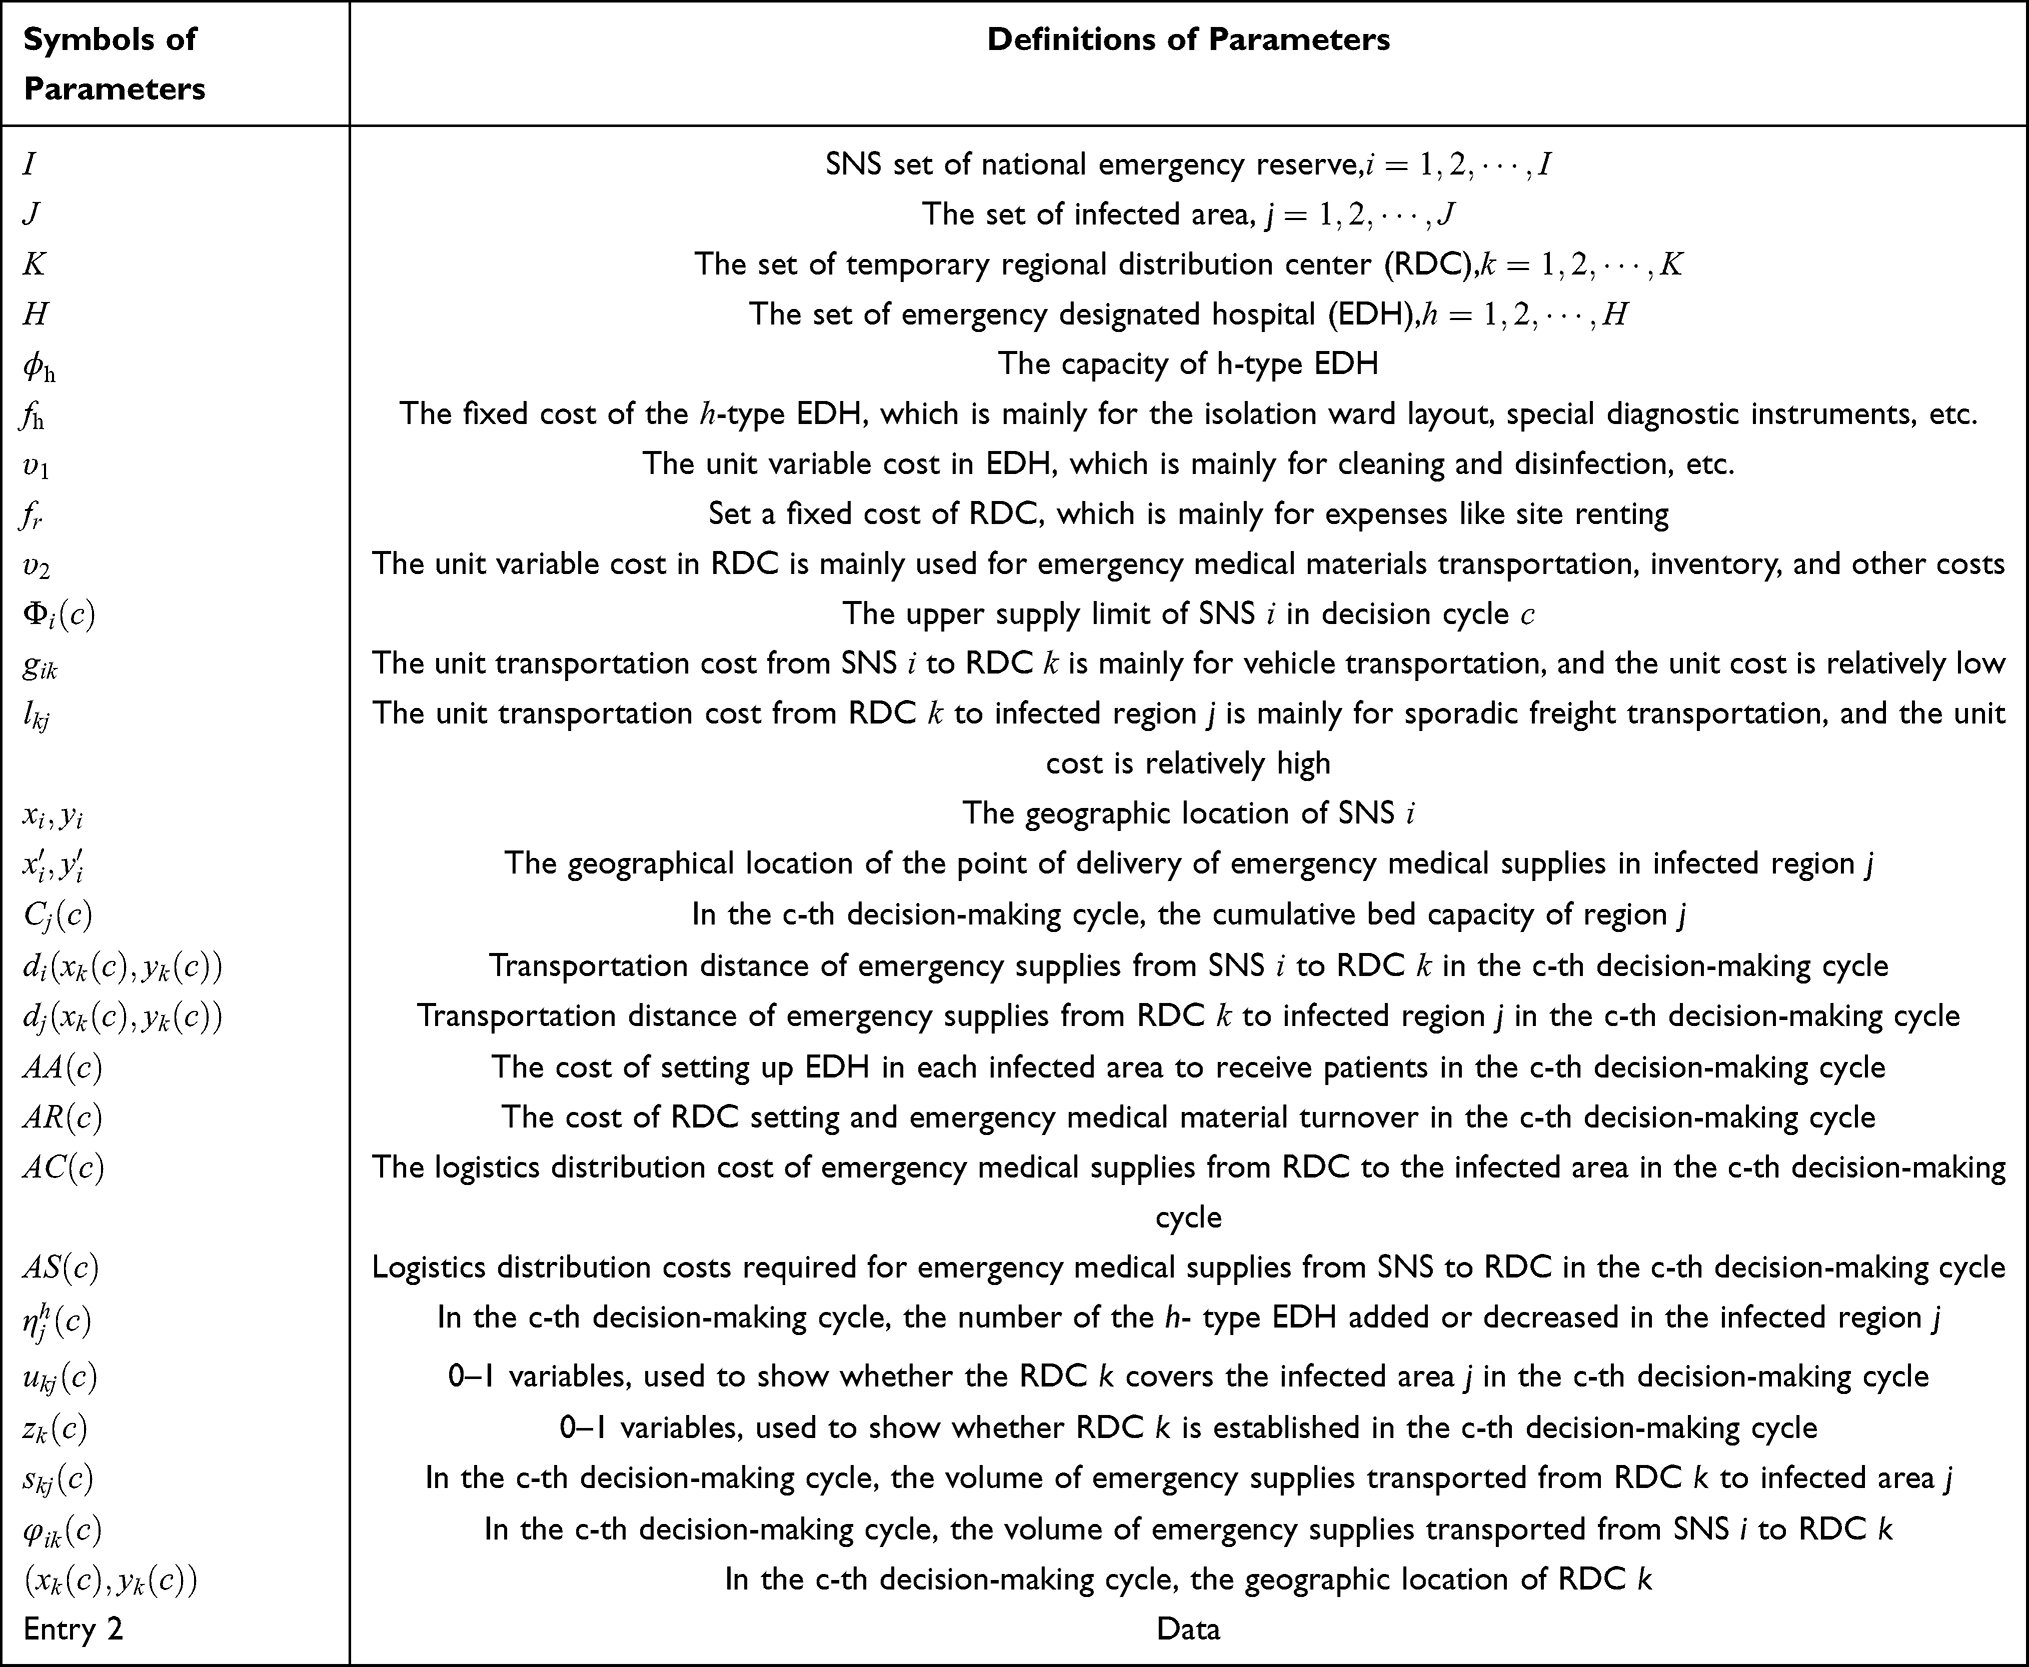 |
Table 2 Symbols and the Definitions of the Parameter Used in the Emergency Logistics Network Model |
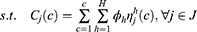
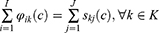
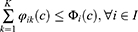
With reference to the description of symbols above, for any decision period c, the optimization model of the emergency logistics network is described as (7)-(28). Among them, the objective function in Equations (7)-(11) is to minimize the emergency response cost of public health emergencies in the c-th decision period.


Constraints in Equations (12) and (13) ensure that there is an adequate number of beds in any infected area for isolate patients.

The constraint in Equation (14) ensures that each infected area has only one RDC to provide emergency medical supplies.

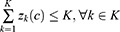
Constraints in Equation (15) and Equation (16) ensure that the emergency supply demands of each infected area can be met. Through the dynamic and real-time data of susceptible population Equation (15), the dynamic and real-time optimal change of decision is realized.
Constraints in Equation (17) and Equation (18) ensure that only the set RDC can provide the turnover services of emergency supplies, where M is a positive integer large enough to limit the maximum turnover capacity of RDC supply.


The constraint in Equation (19) is the restrictions of the maximum number of RDC.
The constraint in Equation (20) is the restrictions of SNS’s supply capacity.
Constraints in Equation (21) and Equation (22) are the distance formulas.


Constraints in Equations (23)-(28) are variable constraints.


Among the above decision variables, the information of RDC and infected area are mainly composed of two levels. In terms of the decision-making guidance of the first-level government, the outputs we should focus on are the information of RDC’s geographical location and both of the input
 and output
 of emergency supplies. In terms of the decision-making guidance of the second-level government, the outputs we should focus on are the quantity of h-th EDH
  in infected areas and both of the input
 and demand of emergency supplies.
It is worth noticing that the constraints shown in Equation (23) are all integer variables (positive integers, negative integers, and zero). All the integer variables are respectively corresponding to the number of the h-th EDH in the group of the adding, the decreasing, or the unchanged of the infection area j in the cth decision period. The constructed optimization model is a nonlinear programming model of mixed integers based on the fact that the objective function of the above model contains two terms as the variable multiplication term  and the variable judgment term
 . The two nonlinear terms can be linearized by corresponding methods in solution,29–36 thus needing no further elaboration. The above model not only selects emergency response sites for allocation optimization among continuous multiple facilities with undetermined number of sites, but also incorporates capability combination optimization. Thus, the solution mentioned here is more complex than the general set coverage issue (the set coverage problem itself is an NP issue).
Collection and Processing of Data
The third stage of the decision-making framework model is data collection and processing, and its main function is to give calculation results of the above optimization model. Efforts could be made in three aspects: setting the corresponding capacity of EDH in each infected area, setting the optimal number of RDH in the entire area and allocating the corresponding amount of emergency medical supplies from SNS to each infected area. The latest data of the public health emergencies are constantly collected and recorded. Because the actual data of public health emergencies are often different from the predicted data, the next step is to introduce a data-driven method to adjust and modify the parameters of public health emergencies.
Adjustment and Update of Parameter
Within the framework of dynamic emergency decision, we can get actual daily data in each decision-making period after the optimization results (in The Design of Emergency Logistics Network) have been processed (in Collection and Processing of Data). With reference to formula (6) in Analysis of the Transmission of Public Health Emergencies, for any day of  in the decision-making period, the following linear equation system can be constructed as shown in Equation (29).
In Equation (29),  ,
, are the collected data of actual situation of public health emergencies during the period, and the sum of
  , are the parameters to be updated and solved. Set
  , B the coefficient matrix and b a fixed vector; then, for any time
  and in any region
  , the above linear equations can be simplified as shown in Equation (30).

In the SEIAR model of the transmission of public health emergencies in Analysis of the Transmission of Public Health Emergencies, it is assumed that the population of the region can be relatively stable, that is to say, the total population is a constant. Therefore, the equation should be the one as shown in Equation (31).

Based on the characteristics mentioned above, this paper performs the determinant transformation of the linear equations, as shown in Equation (30). It is easy to find out that the rank of the coefficient matrix is equal to the rank of its augmentation matrix and the number of variables.

In terms of the above features, the system of linear equations has only one solution.

Thus, the four parameters  and
and  in the SEIAR model have unique values at any time
 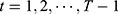 and in any region
  . Considering the principle (Trend Prediction) of the data which is closer to the later period of public health event of the decision-making, the greater impact on the update of the parameter of a public health event in the subsequent decision-making, the above four parameters should be adjusted and updated to Equation (34)-Equation (39) as shown below.
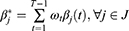
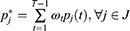
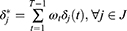


In Equation (34) - (39),  is the corresponding weight coefficient and meets the condition that
 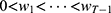 (that is to say, the closer it gets to the later part of the decision-making period, the greater impact the parameter boast does). At this point, it can obtain the updated parameters of public health emergencies
  and
and  , and substitute them into the transmission model of public health emergencies in the next decision cycle, which is worth explaining. In addition, the adjustment and update of this parameter is completely driven by data. The obtained
  and
and  are a convex combination of parameters related to public health emergencies in the past
  days.
days.
The Solution of Model
In the above four processes of the decision-making framework model, the core is to solve the NP problem in the network design of emergency logistics. To realize it, we designed a kind of method with hybrid enumeration search and genetic algorithm. This method can ensure an optimal approximate solution (or probably a global optimal solution) in a short time. The solving process is shown in Table 3.
 |
Table 3 Pseudocode of the Hybrid Enumeration Search and Genetic Algorithm |
Analysis of Examples’ Test
Case Background and Parameter Settings
In order to test the effectiveness of the proposed decision framework model, this paper takes the H1N1 public health emergencies in Jiangsu Province as the case background. With two SNSs in the southeast and the northwest of Jiangsu Province, one receiving point (POD) of emergency medical supplies is set up in each prefecture-level city of Jiangsu, serving the function of receiving and distributing materials to local emergency designated hospitals (EDH). The geographic location information of each point has been known in advance and the data on public health emergencies can be downloaded from the National Public Health Data Center. The parameters of initial values of the SEIAR model are set based on the related papers of H1N1 public health emergencies.29 At the same time, it is assumed that each patient needs 3 unit doses of medical supplies per day, and the decision-making period is set to be 30 days (supposing that there are 30 days per month), while the duration of public health emergencies is from July 1, 2009, to April 25, 2010, with a total of 300 days (that is 10 cycles). In the test of this example, the EDH is assumed to have two capacities, 30 beds and the 50 beds. The fixed cost of the 30-bed EDH is estimated to be CNY (Chinese yuan) 300,000. The fixed cost of the 50-bed EDH is estimated to be CNY 450,000. Considering the economic benefits, the unit cost of patient treatment is changed to CNY 600, and the fixed cost of RDC is changed to CNY 200,000, while the unit cost in RDC is estimated to be CNY 10. In addition, we set the unit transportation costs  and
and  to be CNY 0.01 and CNY 0.012, respectively.
Test Results
Comparison of Prediction Results and Optimal Capacity Setting
Taking the Xuzhou City (region 1) as an example, the solid black line in Figure 3 is the collected actual data of the number of infected people, and the red dotted line is the data of the number of infected people predicted by the dynamic adjustment decision-making framework proposed in this paper. First of all, as Figure 3 shows, in the application of the proposed decision-making model in this paper, there is an obvious dynamic adjustment after each decision-making cycle. The dynamic adjustment and update of parameters help to improve the accuracy of describing the evolution of the transmission of public health emergencies. Secondly, by comparing the predicted number of the infected people (red dot line) with the actual number of the infected people (black solid line), it can be seen that the predicted number of the infected people in this paper is slightly higher than the actual number of the infected people before the peak of the transmission of public health emergencies. During the fading of public health emergencies, the predicted number of the infected people is slightly lower than the actual number of the infected people. However, the accuracy of the designed dynamic adjustment prediction in this paper is better in general, and the t test of data also proves the prediction effect of the decision-making framework based on the dynamic adjustment in the 13 infected areas. In terms of statistical significance, there is no significant difference between the predicted results and the actual results. Finally, Figure 3 also shows the best capacity of emergency hospitals in each decision-making cycle (blue dotted line), and the gradual changes is resulted from the combination of two different types of EDH (30-bed type and 50-bed type) (as shown in Figure 4). This combination of optimization not only ensures that there are sufficient beds for isolated patients in each decision-making cycle, but also ensures that a buffer space can be provided to cope with the unpredictable growth and changes in public health emergencies. In addition, Figure 4 shows that there are economies of scale. Therefore, it is recommended that more bigger-bed-type (50-bed type) EDH be installed in emergency practice, for it can satisfy the treatment needs of more patients while with less emergency cost.
 |
Figure 3 Comparison between the predicted number of the infected and the actual data. |
 |
Figure 4 Optimal setting of EDH capacity in decision-making cycles. |
RDC Settings for Decision-Making Cycles
Figure 5 shows the number and the relative size of RDCs in each decision-making cycle. For example, only 2 RDCs are needed to be set in the first decision-making cycle and they, respectively, bear 62% and 38% of the transshipment of emergency medical supplies; In the second decision-making cycle, for the transmission of public health emergencies, 4 RDCs are needed to be set, which are responsible for 23%, 8%, 46%, and 23% of the emergency supplies transshipment, respectively. In the design of the emergency logistics network, the purpose of the setting of RDC is to form economies of scale and save emergency logistics costs. Therefore, with the gradual transmission of public health emergencies, both the number of patients and their demands for emergency medical supplies increase. More RDCs need to be set up to provide a higher level of emergency service. Conversely, when public health emergency dies down as the number of patients gradually decreases, the number of RDCs should be gradually reduced to save the cost of emergency rescue. In this example, the number of RDCs will gradually decrease from the 6th decision cycle. Significantly, many RDCs are the temporarily rented large venue facilities or warehouses which are used for the transfer and allocation of emergency medical supplies in the actual emergency rescue process. Thus, the number and even the location can be determined on the change of public health emergencies, which is quite different from the design of commercial logistics networks which consider site selection as a long-term strategic decision.
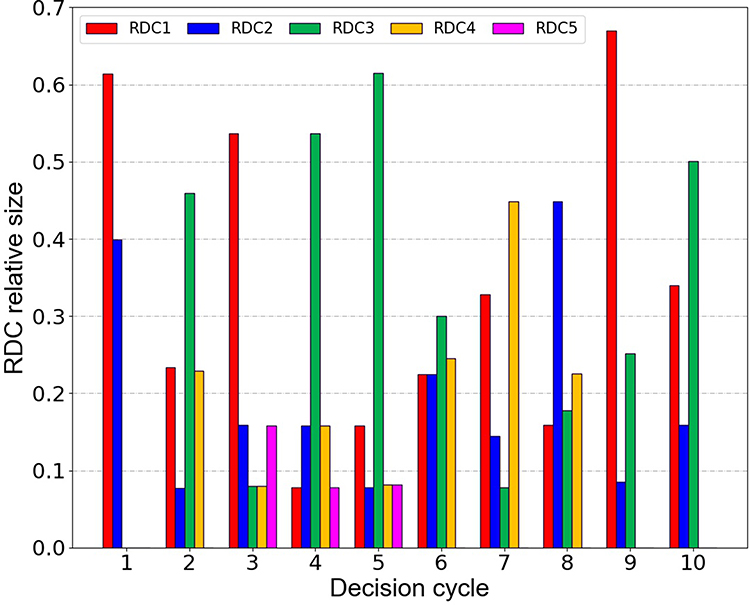 |
Figure 5 RDC setting in decision-making cycles. |
SNS Settings for Decision-Making Cycles
Figure 6 shows the changes in the supply ratio (bar graph) and the quantity (line graph) of the two national emergency SNS reserves in different decision-making cycles. For the supply quantity (line graph), emergency medical supplies of SNS1 are gradually increasing in the first 4 periods. In the 5th to 9th cycles, emergency medical supplies have reached the limitation of the supply capacity. However, in the supply ratio (bar graph), SNS1 shows the decreasing (the first 7 periods) at the beginning, while the amount of emergency medical supplies by SNS2 had seen increasing from the beginning, reaching the peak in the seventh period, and then gradually decreasing with its supply ratio which shows a similar change. The main reason for the changes mentioned above is that the demand for emergency medical supplies has grown rapidly at the beginning. Although the supply of emergency supplies for SNS1 is gradually increasing, the proportion of SNS1 supply would be gradually declined with SNS2. In addition, in terms of geographic location, SNS1 is closer to Jiangsu Province; therefore, in the initial and final stages of public health emergencies, almost all emergency medical supplies are available.
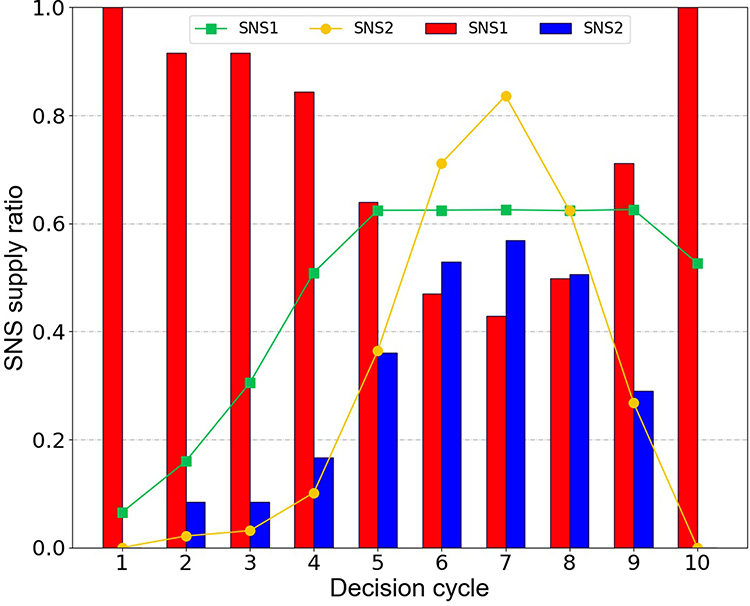 |
Figure 6 SNS supplies in decision-making cycles. |
Parameter Adjustment Settings for Decision-Making Cycles
Taking Xuzhou City as an example, Figure 7A shows the settings of parameters of public health emergencies, which are  and
and  in different decision-making cycles. There are only slight changes in four parameters, but the basic regeneration number (R0) of public health emergencies in Figure 7B has changed significantly. The number of basic regenerations refers to the number of patients infected during the average period of illness, which is the core index to measure whether a public health emergency is contagious. In Figure 7B, the infectivity of public health emergencies shows a tendency that it increases first and then decreases in the first seven decision-making cycles, and finally it reaches the lowest point in the seventh cycle, which is the same case in Figure 3. This indicates that when the number of patients reaches a peak in the seventh cycle, public health emergencies are gradually under control and show a trend of dying out. In the actual emergency decision-making process, managers can utilize the collected actual data to dynamically adjust and update the parameters of public health events, so as to obtain a more accurate trajectory of public health emergencies and to formulate more accurate emergency logistics plans.
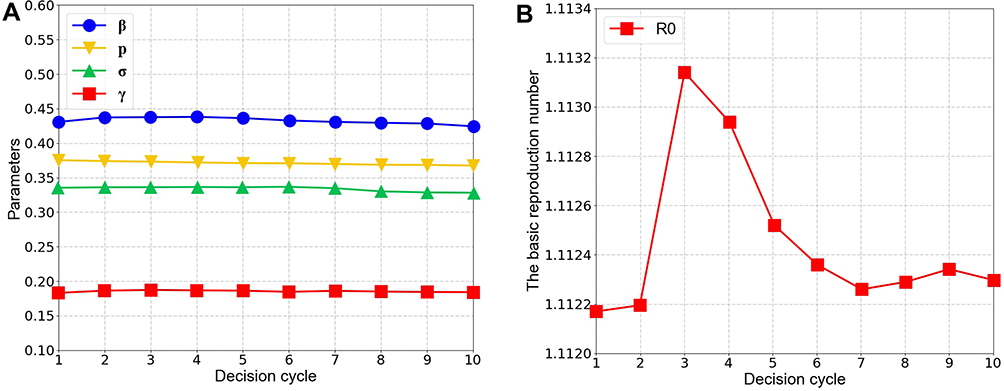 |
Figure 7 The adjustment of parameters in decision-making cycles. (A) Parameters with slight changes. (B) Parameters with significant changes. |
Allocation of Emergency Budget for Decision-Making Cycles
Government departments will allocate a certain amount of budget funds for emergency rescue activities after making an emergency plan for public health emergencies. What contributes to an effective allocation is a practical problem for policymakers. Figure 8 demonstrates the allocation of rescue budget for the test case in different decision-making cycles. In Figure 8, the majority of the emergency relief funds (about 76%) are spent on isolation wards in the affected area (EDH costs), followed by logistics costs for the distribution of emergency medical supplies (about 19%), while the costs of emergency regional distribution center RDC only account for 5%. In addition, the example test shows that the allocation of emergency budget funds should be handled properly in areas with high initial infections or high incidence of public health emergencies.
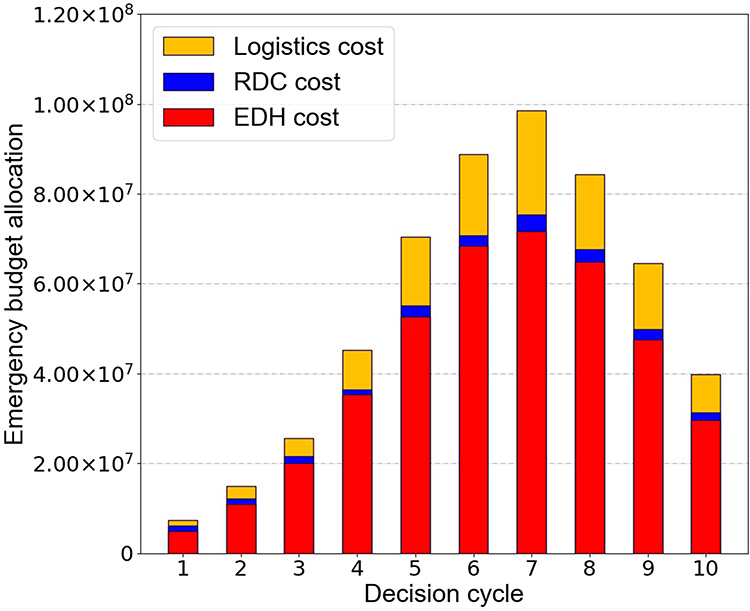 |
Figure 8 Allocation of the emergency budget in decision-making cycles. |
Effect of Different Time-Picking for Initial Intervention
In order to demonstrate the impact of different time-picking for initial intervention on emergency rescue, this paper tested four different scenarios every half month, and the results are shown in Figure 9. The exact consequences of one-day-delay (or a period of time) are still unclear, but early intervention and rescue efforts are known to be quite important in public health emergencies. It can be seen clearly in Figure 9 that the later the emergency rescue starts, the higher the total cost of emergency rescue required. Assuming that the emergency intervention begins on July 1, the final total cost is CNY 491 million; then, assuming that the emergency intervention is delayed until July 16, it will cost CNY 509 million. It clearly shows that one-day-delay in carrying out the emergency rescue of public health emergencies requires hundreds or even tens of millions of additional costs. Therefore, in the actual emergency response to public health emergencies, the response speed of the government is crucial. For example, as of September 2019, China has discovered 155 public health emergencies of African swine fever (ASF). Thanks to the timely response of the local government in China, the current situation of ASF only shows a dotted distribution. Considering the particularity of the China’s pig industry and the existence of ASF virus, it is preliminarily predicted that there is still a critical period for the prevention and control of the disease in the following days.
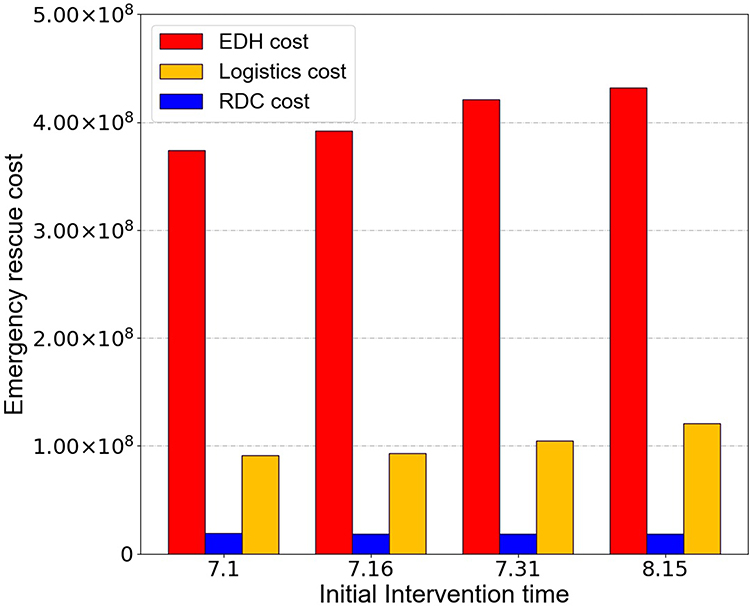 |
Figure 9 Impact of time-picking for initial intervention on rescue costs. |
Comparison Between Dynamic Adjustment and Non-Dynamic Adjustment
In this subsection, we compare the results of dynamic parameter adjustment with those without dynamic adjustment. The cost of each decision cycle is shown in Figure 10. It is easy to see that the cost of the dynamically adjusted emergency logistics network is lower than the non-dynamically adjusted emergency logistics network in most decision-making cycles. In addition, in the first seven cycles, the cost growth of the dynamically adjusted emergency logistics network is gentler than that of the static emergency logistics network, which is conducive to the rapid response funded by the government. In the last three cycles, the cost of the dynamically adjusted emergency logistics network decreases more rapidly than that of the static emergency logistics network, which shows that with dynamic adjustment emergency logistics network can realize the disappearance of public health events more quickly and efficiently after public health events are gradually controlled.
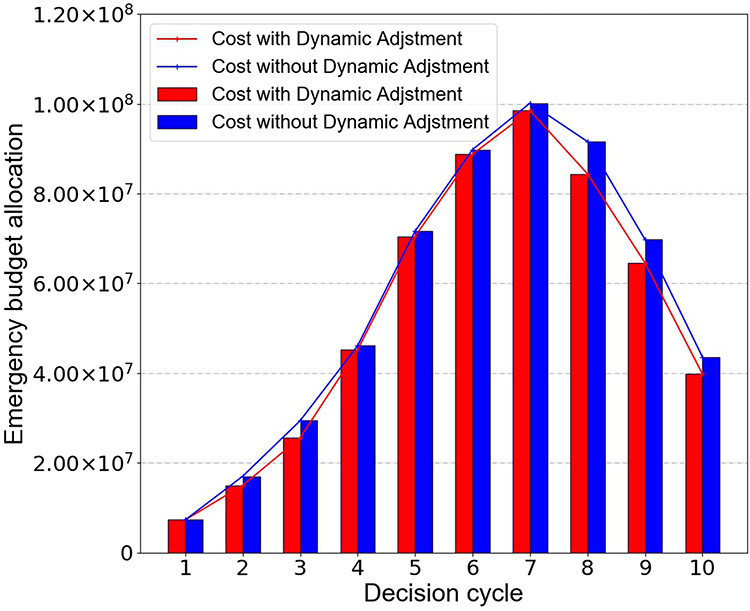 |
Figure 10 Comparison of dynamic adjustment and non-dynamic adjustment results. |
Conclusion
In this paper, from the perspective of data-driven, an innovative decision-making framework model for dynamic adjustment and optimization of the emergency logistics network is constructed. In each decision-making cycle, there are four decision-making steps which are cyclical and progressive. The four steps include the analysis of public health emergency transmission, design of emergency logistics network, data collection and processing, and the adjustment and update of parameter. In this decision-making framework, the entire emergency response process of public health emergencies is transformed into a collaborative decision-making process of data learning and the optimization of resource allocation. The main theoretical contributions of this paper include the following four aspects: (1) From the perspective of data-driven, we built a real-time adjustment and optimization model for public emergency resource dispatch, instead of setting up a general one-time scheduling optimization; (2) The well-designed decision-making framework model has good universality and scalability, and can be a useful reference for other public health emergencies (Smallpox, Ebola, 2019 new coronavirus, etc.). Thus, this model cannot only solve the problem in the case but also provide a basic framework for dealing with problems like this. (3) The capacity combination optimization problem is embedded in the proposed network model of emergency location allocation, so it is difficult to solve the general coverage problem within the set, which has great practical significance. The problem of capacity combination optimization is embedded in the proposed network model of emergency location, so it is much difficult to solve the general coverage problem within the sets, which has great practical significance; (4) Taking into account the characteristics of the linear equation system and the principle of trend prediction, the relevant parameters of health events are dynamically adjusted and updated.
In this paper, we assumed that the population of the infected area remained generally balanced during the transmission of public health emergencies, regardless of population movements in the inflected area. For the study of the transmission of public health emergencies in the future, we will further consider the impact of the characteristics of population mobility as well as various government control measures on the transmission dynamics of public health emergencies. As for the design of emergency logistics networks, we will further consider the impact brought by emergency budget restrictions, emergency service as well as other factors in the future. The emergency logistics network model under various scenarios will be compared with the existing emergency modeling methods.
Data Sharing Statement
The data used to support the findings of this study are available from the corresponding author upon request.
Funding
This research is funded by Natural Science Foundation of Zhejiang Province (No.LQ20G010002, No.LY20G010001), and the National Nature Science Foundation of China (No.71571162). This research is supported by the project of China (Hangzhou) cross-border electricity business school (No.2021KXYJ06), the Philosophy and Social Science Foundation of Zhejiang Province (No.21NDJC083YB). Contemporary Business and Trade Research Center of Zhejiang Gongshang University (No.XT202103, No.XT202105).
Disclosure
The authors declare that they have no competing interests.
References
1. World Bank Group. 2014–2015 West Africa Ebola crisis: impact update. Availabe from: https://www.worldbank.org/en/topic/macroeconomics/publication/2014-2015-west-africa-ebola-crisis-impact-update.
2. Wang J, Yuan B, Li Z, Wang Z. Evaluation of public health emergency management in China: a systematic review. Int J Env Res Public Health. 2019;16:3478. doi:10.3390/ijerph16183478
3. Shin YA, Yeo J, Jung K. The effectiveness of international non-governmental organizations’ response operations during public health emergency: lessons learned from the 2014 Ebola outbreak in Sierra Leone. Int J Environ Res Public Health. 2018;15:650. doi:10.3390/ijerph15040650
4. Hong Y, Lee T, Kim J-S. Serial multiple mediation analyses: how to enhance individual public health emergency preparedness and response to environmental disasters. Int J Env Res Public Health. 2019;16:223. doi:10.3390/ijerph16020223
5. Emergency OOH. Update on the COVID-19 outbreak as at 24:00 on March 21. Availabe from: http://www.nhc.gov.cn/xcs/yqtb/202003/be74d71b2f784cae917cc830f244caa9.shtml.
6. Elavarasan RM, Pugazhendhi R, Shafiullah GM, Irfan M, Anvari-Moghaddam A. A hover view over effectual approaches on pandemic management for sustainable cities-The endowment of prospective technologies with revitalization strategies. Sustain Cities Soc. 2021;68:102789. doi:10.1016/j.scs.2021.102789
7. Razzaq A, Sharif A, Aziz N, Irfan M, Jermsittiparsert K. Asymmetric link between environmental pollution and COVID-19 in the top ten affected states of US: a novel estimations from quantile-on-quantile approach. Environ Res. 2020;191. doi:10.1016/j.envres.2020.110189
8. Iqbal W, Tang YM, Chau KY, Irfan M, Mohsin M. Nexus between air pollution and NCOV-2019 in China: application of negative binomial regression analysis. Process Saf Environ Prot. 2021;150:557–565. doi:10.1016/j.psep.2021.04.039
9. Irfan M, Ahmad M, Fareed Z, Iqbal N, Sharif A, Wu HT. On the indirect environmental outcomes of COVID-19: short-term revival with futuristic long-term implications. Int J Environ Health Res. 2021;1–11. doi:10.1080/09603123.2021.1874888
10. Ahmad M, Akhtar N, Jabeen G, Irfan M, Anser MK, Wu HT. Intention-based critical factors affecting willingness to adopt novel coronavirus prevention in Pakistan: implications for future pandemics. Int J Environ Res Public Health. 2021;18:6167. doi:10.3390/ijerph18116167
11. Irfan M, Akhtar N, Ahmad M, et al. Assessing public willingness to wear face masks during the COVID-19 pandemic: fresh insights from the theory of planned behavior. Int J Environ Res Public Health. 2021;18:4577. doi:10.3390/ijerph18094577
12. Samsuzzoha M, Singh M, Lucy D. A numerical study on an influenza epidemic model with vaccination and diffusion. Appl Math Comput. 2012;219:122–141. doi:10.1016/j.amc.2012.04.089
13. Ma Z, Zhou Y, JH W. Modeling and Dynamics of Infectious Diseases. Beijing: Higher Education Press; 2009.
14. Iwata K, Miyakoshi C. A simulation on potential secondary spread of novel coronavirus in an exported country using a stochastic epidemic SEIR Model. J Clin Med. 2020;9:944. doi:10.3390/jcm9040944
15. Bao F, Wu Y, Li Z, et al. “Effect improved for high-dimensional and unbalanced data anomaly detection model based on KNN-SMOTE-LSTM,” Complexity 2020, Article ID 9084704. Available from: https://doi.org/10.1155/2020/9084704.
16. Macías-Díaz JE, Ahmed N, Rafiq M. Analysis and nonstandard numerical design of a discrete three-dimensional hepatitis B epidemic model. Mathematics. 2019;7:1157. doi:10.3390/math7121157
17. Ekici A, Keskinocak P, Swann JL. Modeling influenza pandemic and planning food distribution. Manuf Serv Oper Manag. 2014;16:11–27. doi:10.1287/msom.2013.0460
18. Zhang Z, Kundu S, Wei R. A delayed epidemic model for propagation of malicious codes in wireless sensor network. Mathematics. 2019;7:396. doi:10.3390/math7050396
19. He Y, Liu N. Methodology of emergency medical logistics for public health emergencies. Transport Res E-Log Transport Rev. 2015;79:178–200. doi:10.1016/j.tre.2015.04.007
20. Liu M, Zhang D. A dynamic logistics model for medical resources allocation in an epidemic control with demand forecast updating. JORS. 2016;67:841–852. doi:10.1057/jors.2015.105
21. Dasaklis TK, Rachaniotis N, Pappis C. Emergency supply chain management for controlling a smallpox outbreak: the case for regional mass vaccination. Int J Syst Sci: Oper Logis. 2017;4:27–40. doi:10.1080/23302674.2015.1126379
22. Dasaklis TK, Pappis CP, Rachaniotis NP. Epidemics control and logistics operations: a review. Int J Product Econ. 2012;139:393–410. doi:10.1016/j.ijpe.2012.05.023
23. Teytelman A, Larson RC. Multiregional dynamic vaccine allocation during an influenza epidemic. Serv Sci. 2013;5:197–215. doi:10.1287/serv.2013.0046
24. Juusola JL, Brandeau ML. HIV treatment and prevention: a simple model to determine optimal investment. Med Decis Making. 2016;36:391–409. doi:10.1177/0272989X15598528
25. Liu M, Zhang Z, Zhang D. A dynamic allocation model for medical resources in the control of influenza diffusion. J Syst Sci Syst Eng. 2015;24:276–292. doi:10.1007/s11518-015-5276-y
26. Wanying C, Alain G, Angel R. Modeling the logistics response to a bioterrorist anthrax attack. Eur J Oper Res. 2016;254:458–471. doi:10.1016/j.ejor.2016.03.052
27. Büyüktahtakın İE, des-Bordes E, Kıbış EY. A new epidemics–logistics model: insights into controlling the Ebola virus disease in West Africa. Eur J Oper Res. 2018;265:1046–1063. doi:10.1016/j.ejor.2017.08.037
28. Brandeau ML. Creating impact with operations research in health: making room for practice in academia. Health Care Manage Sci. 2016;19:305–312. doi:10.1007/s10729-015-9328-0
29. Tan X, Yuan L, Zhou J, Zheng Y, Yang F. Modeling the initial transmission dynamics of influenza A H1N1 in Guangdong Province, China. Int J Infect Dis. 2013;17:e479–e484. doi:10.1016/j.ijid.2012.11.018
30. Xiang K, Xu C, Wang J. Understanding the relationship between tourists’ consumption behavior and their consumption substitution willingness under unusual environment. Psychol Res Behav Manag. 2021;14:483–500. doi:10.2147/PRBM.S303239
31. Wang J, Xu C, Liu W. Understanding the adoption of mobile social payment? From the cognitive behavioral perspective. Int J Mobile Comm. 2022. doi:10.1504/IJMC.2022.10036150
32. Tang Z, Hu H, Xu C, Zhao K. Exploring an efficient remote biomedical signal monitoring framework for personal health in the COVID-19 pandemic. Int J Environ Res Public Health. 2021;18:9037. doi:10.3390/ijerph18179037
33. Xu C, Ding AS, Zhao K. A novel POI recommendation method based on trust relationship and spatial-temporal factors. Electron Commer Res Appl. 2021;48:101060. doi:10.1016/j.elerap.2021.101060
34. Xu C, Liu D, Mei X. Exploring an efficient POI recommendation model based on user characteristics and spatial-temporal factors. Mathematics. 2021;9(21):2673. doi:10.3390/math9212673
35. Bao F, Mao L, Zhu Y, Xiao C, Xu C. An improved evaluation methodology for mining association rules. Axioms. 2022;11(1):17. doi:10.3390/axioms11010017
36. Tang Z, Hu H, Xu C. A federated learning method for network intrusion detection. Concurr Comput. 2022. doi:10.1002/cpe.6812
 © 2022 The Author(s). This work is published and licensed by Dove Medical Press Limited. The full terms of this license are available at https://www.dovepress.com/terms.php and incorporate the Creative Commons Attribution - Non Commercial (unported, v3.0) License.
By accessing the work you hereby accept the Terms. Non-commercial uses of the work are permitted without any further permission from Dove Medical Press Limited, provided the work is properly attributed. For permission for commercial use of this work, please see paragraphs 4.2 and 5 of our Terms.
© 2022 The Author(s). This work is published and licensed by Dove Medical Press Limited. The full terms of this license are available at https://www.dovepress.com/terms.php and incorporate the Creative Commons Attribution - Non Commercial (unported, v3.0) License.
By accessing the work you hereby accept the Terms. Non-commercial uses of the work are permitted without any further permission from Dove Medical Press Limited, provided the work is properly attributed. For permission for commercial use of this work, please see paragraphs 4.2 and 5 of our Terms.