Back to Journals » Cancer Management and Research » Volume 12
Cyclin F Downregulation Affects Epithelial-Mesenchymal Transition Increasing Proliferation and Migration of the A-375 Melanoma Cell Line
Authors Krajewski A ![]() , Gagat M
, Gagat M ![]() , Mikołajczyk K, Izdebska M
, Mikołajczyk K, Izdebska M ![]() , Żuryń A, Grzanka A
, Żuryń A, Grzanka A
Received 1 September 2020
Accepted for publication 19 November 2020
Published 22 December 2020 Volume 2020:12 Pages 13085—13097
DOI https://doi.org/10.2147/CMAR.S279169
Checked for plagiarism Yes
Review by Single anonymous peer review
Peer reviewer comments 3
Editor who approved publication: Dr Eileen O'Reilly
Adrian Krajewski, Maciej Gagat, Klaudia Mikołajczyk, Magdalena Izdebska, Agnieszka Żuryń, Alina Grzanka
Department of Histology and Embryology, Nicolaus Copernicus University in Toruń, Collegium Medicum in Bydgoszcz, Bydgoszcz, Poland
Correspondence: Maciej Gagat Tel +48 52 585 37 25
Fax +48 52 585 37 34
Email [email protected]
Background: Cyclins are well-known cell cycle regulators. The activation of cyclin-dependent kinases by cyclins allows orchestration of the complicated cell cycle machinery and drives the cell from the G1 phase to the end of the mitotic phase. In recent years, it has become evident that cyclins are involved in processes beyond the cell cycle. Cyclin F does not activate CDKs but forms part of the Skp1-Cul1-F-box (SCF) complex where it is responsible for protein target recognition and subsequent degradation in a proteasome-dependent manner.
Results: Here, we report that the downregulation of cyclin F in the A-375 melanoma cell line increases cell viability and colony formation in a cell cycle independent manner. Lower levels of cyclin F do not appear to affect the cell cycle, based on flow cytometry measuring BrdU incorporation and propidium iodide staining. By means of immunofluorescence staining and Western blot analysis, we observed changes in cell morphology-related markers which suggested ongoing epithelial-mesenchymal transition (EMT) in response to cyclin F downregulation. Increases in vimentin and N-cadherin protein levels, decreases in levels of epithelial markers such as ZO-1, along with changes in morphology to a spindle-like shape with the appearance of actin stress fibers, are all hallmarks of EMT. These changes are associated with increased invasive and migratory potential, based on 2D migration assays. Moreover, we observe an increase in RhoABC, talin and paxillin levels, the proteins involved in controlling cell signaling and motility. Lastly, upon knocking down cyclin F expression, we observed a decrease in thrombospondin-1 expression, suggesting a role of cyclin F in angiogenesis.
Conclusion: Cyclin F depletion induces proliferation and EMT processes in the A-375 melanoma model.
Keywords: cyclin F, melanoma, invasiveness, proliferation, cancer
Introduction
Treatment of metastatic melanoma remains a medical challenge and although survival rates have significantly improved over the last few years, patient outcomes are still relatively poor. The introduction of personalized medicine, targeted small-molecule inhibitors and immunotherapy has significantly improved the likelihood of patient recovery, but prognosis is still variable and uncertain. Most patients quickly acquire resistance to MAPK and PI3K/AKT pathway inhibitors. The mechanism of this resistance includes reactivation of MAPK signaling, activation of substitutive pathways and evading cell death by upregulating cytoprotective autophagy and endoplasmic reticulum (ER) stress.1,2 Melanoma tumors which have developed resistance to therapeutic interventions, particularly if they have become metastatic, are extremely difficult to treat and are associated with very poor prognosis. There is evidently an urgent need to identify novel molecular targets for the development of alternative therapeutic strategies for the treatment of metastatic melanoma.
Epithelial-to-mesenchymal transition (EMT) is a crucial step for the progression of mature cells from a stationary to an invasive phenotype. EMT plays a crucial role in normal embryonic development and organogenesis, promoting differentiation, organ-specific repair and damage recovery. However, in adult cells, it can initiate tumor metastasis and produce cancer stem-like cells which present a significant therapeutic obstacle.3,4 EMT induces dramatic changes in cell phenotype: cell-cell attachments become unstable, cells lose apicobasal polarity, elongate and acquire increased motility and invasiveness. The EMT process is characterized by activation of EMT-related transcription factors such a Snail, Slug/Snail2, ZEB1, ZEB2 and Twist, followed by downregulation of epithelial phenotypic markers such as E-cadherin and zonula occludens (ZO-1), along with upregulation of fibronectin, vimentin and mesenchymal adhesion proteins such as N-cadherin and N-CAM.5 During embryogenesis, cells undergo complete EMT and completely lose epithelial markers, whereas cancer cells can express both epithelial and mesenchymal markers and complete inversion is observed only in vitro cancer cell cultures.6
Cyclin F is a part of the Skp1-Cul1-F-box protein (SCF) E3 ubiquitin ligase complex.7 The role of E3 ubiquitin ligases is to maintain cellular homeostasis by mediating linkage between recognized target proteins and ubiquitin molecules. Subsequently, proteins tagged with ubiquitin are degraded in the proteasome.8 The degradation of proteins via the SCF complex is important for maintaining genome stability and proper cell cycle course.9,10 The expression of cyclin F varies during the cell cycle, peaking at the G2 phase and decreasing at mitosis.11 In contrast to the other cyclins, cyclin F is an orphan cyclin and does not bind and activate any cyclin-dependent kinase (CDK). It has been shown that irregularities in cyclin F expression can impair the regulatory function of the SCF complex and thus may be involved in cancerogenesis and other cell cycle-related diseases.12,13 The purpose of this study was to investigate the effect of cyclin F silencing on EMT hallmarks using a metastatic melanoma cell line. We demonstrated that silencing cyclin F increases melanoma cell proliferation, migration and invasiveness.
Materials and Methods
Antibodies Used
Cyclin F (SantaCruz, sc-515,207), cyclin A (ThermoFisher, M1-154), cyclin B (ThermoFisher, MA5-14,319), cyclin D (Sigma-Aldrich, SAB4502603), RRM2 (Abcam, ab57653), p53 (ThermoFisher, Pab 240), NFkB p65 (ThermoFisher, 33–9900), vimentin – immunofluorescence (Abcam, ab92547), vimentin – Western blot (SantaCruz, sc-373,717-AF790), N-cadherin (ThermoFisher, 3B9), RhoABC (Abcam, ab188103), ROCK-2 (Abcam, ab71598), pFAK (Sigma-Aldrich, F9176), paxillin (ThermoFisher), ZO-1 (ThermoFisher, ZO1-1A12) TSBP1 (ThermoFisher, MA5-13,398)
TCGA and GTEx Analysis in Xena Platform
To compare the expression in normal skin and melanoma cells we compare the publicly available data from The Cancer Genome Atlas – human skin cutaneous melanoma (SKCM) cohort, and The Genotype-Tissue Expression database (GTEx) using the Xena platform.14 We compare 812 normal tissue samples with 470 tumor samples from melanoma patients. Our data accession pathway was as follows: The first column: TCGA TARGET GTEx; First variable: phenotypic – main category; Second variable: phenotypic – study; Third variable: phenotypic – sample type; fourth variable: genotypic – gene: CCNF – normalization method: RSEM norm_count. Then, the data were filtered using keywords: skin; cutaneous melanoma. The raw data were downloaded and analyzed in Graphpad Prism (ver. 8.0). The optimal cutoff for best statistical significance was computed using Evaluate Cutoff R package.
Cell Culture
The immortalized human melanoma cell derived from primary A-375 (cat. no. CRL-1619, ATCC) was cultivated in Eagle’s Minimum Essential Medium (EMEM) (cat. no. 10–009-CV, Corning) supplemented with 10% fetal bovine serum (FBS) (cat. no. 11,573,397, Thermo Fisher Scientific) and 50 µg/mL gentamycin (cat. no. G1397, Sigma-Aldrich). The cells were initially seeded at a density of 5x10³ viable cells per cm2 and cultured in monolayer in T-25 cm2 flasks (Corning) at 37 °C and 5% CO2 in a humidified CO2 incubator. Transfected and non-transfected cells were tested for mycoplasma contamination by qualitative staining of nucleic acids using DAPI diluted 1:100 in distilled water (cat. no. D9542, Sigma-Aldrich). Exclusively cells testing negative for mycoplasma were used for experimental applications and each batch of cells were only maintained for a maximum of five passages prior to conducting assays.
Cell Transfection
A-375 cells were transfected with shRNA according to the Santa Cruz shRNA Lentiviral Particles Transduction protocol. Briefly, cells intended for transfection were cultured in complete optimal medium, supplemented with FBS and gentamicin. Once cells reached the desired confluency or density, 4µg/mL Polybrene® (cat. no. sc-134,220, Santa Cruz) was added per well. A-375 cells were then infected by adding the shRNA Lentiviral Particles (Santa Cruz, cat. no. sc-108,080) to the culture and swirling the plate gently to mix. The Polybrene®-medium mixture was subsequently removed and replaced with 1 mL of supplemented EMEM and incubated overnight as previously described. Stable clones expressing the shRNA were selected by subculturing cells at a 1:3 to 1:5 ratio and cultivating in the presence of Puromycin (cat. no. sc-108,071, Santa Cruz) at a concentration of 2µg/mL for two weeks. Stably transfected cells were used for further studies and stable clones were maintained by replenishing culture medium containing 0.2 µg/mL fresh puromycin every 3–4 days. Transduction efficiency was determined using copGFP Control Lentiviral Particles (cat. no. sc-108,084, Santa Cruz).
MTT Assay
To determine the effect of cyclin F downregulation MTT was conducted. The cells were plated on 24-well plates and 24h later the culture medium was replaced with DMEM without phenol red with MTT salt addition (ratio medium: MTT was 1:9). The stock solution was prepared by dissolving thiazolyl blue tetrazolium bromide (MTT, Sigma-Aldrich; St. Louis, MO, USA) in 5mg/mL PBS. The cells were incubated 2h then fluorescence intensity was measured using BioTEK 800Ts fluorescence microplate reader at 570nm wavelength.
BrdU Assay
The cells were seeded to 6 well plates, and harvested after 24h the BrdU were added directly to the medium for 2h. Then cells were harvested and the BrdU assay was conducted using the BD Pharmingen™ BrdU Flow Kit (Alexa Fluor-488) following the manufacturer instructions. Samples were analyzed by the flow cytometry and data were processed using InCyte Software (Luminex).
Immunofluorescent Staining
For fluorescent labeling of proteins, control and transfected A-375 batches were seeded into 12-well plates (Corning) and cultured under standard conditions on sterile ⌀18mm glass coverslips (Thermo Fisher Scientific). Working at room temperature, the cells were fixed with 4% paraformaldehyde for 20 min, permeabilized with 0.25% Triton X-100 in PBS for 10 min and blocked with 4% BSA in PBS for 40 min before staining with the appropriate primary (1 h, room temperature) and secondary antibodies (1 h, room temperature, in the dark). F-actin was labeled by incubation with Alexa Fluor 488 phalloidin diluted 1:40 in PBS (cat. no. A12379, Thermo Fisher Scientific). Cell nuclei were counterstained with DAPI, diluted 1: 100 in distilled water and incubated for 10 min at room temperature in the dark. After each incubation with antibody or DAPI, the cells were washed with PBS buffer. The slides were mounted in Aqua Poly/Mount (Polysciences) and viewed under a C1 confocal microscope (Nikon) using a 100x oil immersion objective. Triple labeled images were obtained at the settings which simultaneously produced the brightest signal for all the proteins, using Nikon EZ-C1 Software (Nikon). All acquisition parameters, including laser power, pixel dwell time and gains, were kept constant for all experiments performed on the same proteins.
To quantitatively confirm the fluorescence intensity of labeled proteins, the above procedure was applied to A-375 cells suspension and additionally analyzed by microcapillary flow cytometry system (Luminex). Flow cytometry data were analyzed using FlowJo Software (BD Biosciences).
Western Blot Assay
The expression level of selected cycle cell and EMT-associated proteins in A-375 cells was determined using semi-quantitative Western blot technique was used. Lysates of A-375 cells were prepared in RIPA buffer (cat. no. 20–188, Sigma Aldrich) containing HaltTM protease inhibitor cocktail (cat. no. 78,438, Thermo Fisher Scientific) and HaltTM phosphatase inhibitor cocktail (78,428, Thermo Fisher Scientific). Lysis mixture was added to the cells and incubated for 10 min at 4 °C. Cell lysates were centrifuged at 10,000 RCF for 20 min at 4 °C and quantitatively analyzed for protein content using the Pierce™ BCA Protein Assay Kit (cat. no. 23,225, Thermo Fisher Scientific) used according to the manufacturer’s instructions.
The supernatant was separated by denaturing electrophoresis. Briefly, samples were subjected to thermal denaturation by incubating for 3 min at 75 °C. Samples were applied to a polyacrylamide gel (cat. no. XP00160BOX, Thermo Fisher Scientific) submerged in Tris-Glycine SDS Running Buffer (cat. no. LC2675-5, Thermo Fisher Scientific) and subjected to 225 V until satisfactory separation of PageRuler Plus 10–250 kDa protein standard (cat. no. 26,619, Thermo Fisher Scientific) was observed. Separated protein was transferred onto a nitrocellulose membrane using an iBlot Dry Western Blotting System (Thermo Fisher Scientific). The membranes were incubated for 2 h at room temperature with primary and secondary antibodies, appropriately diluted in iBind Flex Solution Kit (cat. no. SLF2020, Thermo Fisher Scientific) in iBind Flex Cards and processed on an iBind Automated Western System (Thermo Fisher Scientific). Protein bands were visualized using an enhanced chemiluminescence (ECL) detection system (cat. no. 1,705,061, Bio-Rad) and captured by ChemiDoc MP Imaging System (Bio-Rad). Band intensities were quantified and analyzed using Image Lab Software (Bio-Rad).
Cell Cycle Analysis
To differentiate cells in different phases of the cell cycle, quantitative cell cycle analysis was performed using Guava® easyCyte™ 6HT-2L flow cytometry system. Briefly, A-375 cells were seeded into 12-well plates (Corning) according to manufacturer’s recommendations. Cells were fixed and incubated in ethanol for 24 h at −20 °C. Cells were then centrifuged at 500 RCF for 7 min at room temperature. Pelleted cells were washed with PBS buffer and centrifuged again under the same conditions. After thoroughly removing the supernatant, FxCycle PI/RNase Staining Solution (cat. no. F10797, Thermo Fisher Scientific) was added to the cell pellet and incubated for 30 min at room temperature in the dark. Finally, samples were analyzed by the flow cytometry and data were processed using InCyte Software (Luminex).
Cell Death Analysis
The percentages of early and late apoptotic cells, as well as necrotic cells, were determined by flow cytometry using Guava® easyCyte™ 6HT-2L system. A-375 cells were washed by PBS buffer and centrifuged at 300 RCF for 5min at room temperature. A diluted mixture consisting of Annexin binding buffer (cat. no. V13246, Thermo Fisher Scientific), Annexin V Alexa Fluor 488 (cat. no. A13201, Thermo Fisher Scientific) and propidium iodide (cat. no. P1304MP, Thermo Fisher Scientific) was added to each cell pellet and incubated for 15 min at room temperature in the dark. Samples were analyzed by flow cytometry based on the following assumptions: Annexin V Alexa Fluor 488 positive and propidium iodide negative status represented early apoptotic cells; Annexin V Alexa Fluor 488 negative and propidium iodide positive status represented necrotic cells, Annexin V Alexa Fluor 488 and propidium iodide negative status represented viable cells and Annexin V Alexa Fluor 488 and propidium iodide positive status represented late apoptosis cells. Flow cytometry data were analyzed using InCyte software (Luminex).
Chemotaxis
To monitor the chemotactic response of the transfected and non-transfected cells exposed to chemical gradients, 3D Chemotaxis assays were performed using μ-Slide Chemotaxis (Ibidi) according to the manufacturer’s instructions. The procedure was carried out in parallel without Matrigel, to assess the migration potential of cells, and with Matrigel, to assess the invasiveness of the A-375 cells. To assess cell invasion, the first step was to prepare Matrigel in 1:4 ratio (Matrigel:cold PBS buffer), which was then poured into the inner insert surface. After polymerization of the Matrigel (24 h at room temperature), A-375 cells were seeded at a density of 3x10⁵ per Matrigel in FBS-free medium. The same procedure was repeated for inserts without Matrigel. The prepared inserts were transferred to wells containing fully supplemented medium (with FBS and gentamicin) and incubated for 16 h at room temperature. After incubation, the inserts were washed with PBS buffer and fixed using 3.7% paraformaldehyde for 2 min at room temperature. Fixed cells were permeabilized by incubation with 100% ice-cold methanol solution (cat.no. 6,219,900,110, POCH) for 20 min at room temperature and washed with PBS buffer. Finally, cells were stained using a 0.4% crystal violet solution (cat. no. C0775, Merck) by incubating for 15 min at room temperature. The outer insert surfaces were clearing from dye residue by washing with PBS buffer. Results obtained of migration and invasion assays were photographed and analyzed using light microscope (Eclipse E800, Nikon) containing CCD digital camera (DS-5Mc-U1). The percentage of invasive cells was calculated using imageJ Software (NIH) according to following formula:
% invasion = (mean number of cells invading through matrigel-coated membrane/mean number of cells migrating through uncoated membrane) x100.
Clonogenic Assay
To assess the ability of transfected and non-transfected A-375 cell to proliferate and form colonies, cells were seeded in EMEM at a density of 1x10³ cells per ⌀60mm culture dish (ThermoFisher Scientific). Cells were incubated for two weeks at 37 °C and 5% CO2 in a humidified CO2 incubator. Viable colonies were fixed using 100% methanol, washed with PBS buffer and stained with a 0.4% aqueous solution of crystal violet for 15 min at room temperature. Dye residue was completely removed using 96% ethanol solution (cat. no. czda-396,420,113, POCH) and PBS buffer. Results obtained of migration and invasion assays were photographed and analyzed using light microscope (Eclipse E800, Nikon) containing CCD digital camera (DS-5Mc-U1). The quantity and size of the colonies was measured by ImageJ Software (NIH).
Statistical Analysis
Statistical analyses were performed using GraphPad Prism software. The data in this study are presented as mean values ± SEM. The data were compared by Student’s t-test, with the exception of cell cycle data, which was analyzed using a non-parameter Kruskal–Wallis test with Dunn’s multiple comparisons test. A p-value <0.05 was considered to indicate a statistically significant difference.
Results
Tumors Express Elevated Levels of Cyclin F
Based on a comparison of data from The Cancer Genome Atlas (TCGA) and Genotype Tissue Expression (GTEx) databases we developed the hypothesis that improper regulation of cyclin F expression may promote cell growth, migration and invasion in the A-375 melanoma cell line. We can observe that melanoma cells have higher cyclin F mRNA expression comparing to healthy skin (Figure 1A). The high cyclin F expression is also associated with worse prognosis for melanoma patients (Figure 1B). Moreover, we show that there is a significant difference between cyclin F mRNA expression between primary vs normal and metastatic vs normal cells but there are no differences between the expression in primary and metastatic melanoma (Figure 1C–E).
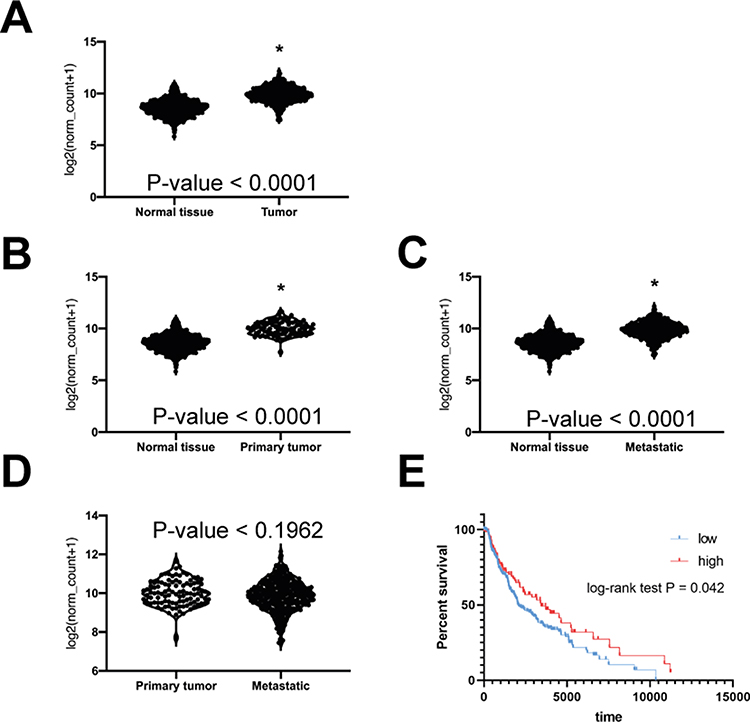 |
Figure 1 The expression of cyclin F mRNA is different in normal skin and in malignant melanoma tissue. (A) The difference in cyclin F mRNA expression in normal skin and melanoma tumor. n= 812 vs 470 respectively (B) The comparison of cyclin mRNA expression between normal tissue and primary melanoma. n= 812 vs 102 respectively. (C) The comparison of cyclin mRNA expression between normal tissue and metastatic melanoma. n= 812 vs 368 respectively. (D) The comparison of cyclin F mRNA expression between primary and metastatic melanoma. n= 102 vs 368 respectively. (E) The overall survival of the patients with high and low cyclin F mRNA expression. n= 321 (low) vs 132 (high); cutoff = 10.30. Asterisk indicates statistically significant difference between groups (p<0.05). |
Cyclin F Downregulation Promotes Cell Growth
To assess the effect of depletion of cyclin F on the growth of the A-375 cell line, we generated a stable, cyclin F deficient A-375 cell line (A-375dF) transduced with lentiviral shRNA to knock down cyclin F expression. Effective knock down of cyclin F expression was validated by Western blot and immunofluorescence staining (Figure 2A). An Annexin V/PI apoptosis assay showed no significant differences in viability between A-375 and A-375dF cell line (Figure 2B). The next step was to determine the effect of cyclin F depletion on cell proliferation. A colony formation assay demonstrated that the A-375dF cell line is characterized by a higher ability to proliferate in comparison with control A-375 cells (Figure 2C). Cell cycle analysis revealed similar cell cycle profiles for A-375dF and A-375 parental cells (Figure 2D) and no significant differences were observed by flow cytometry-based BrdU incorporation assay (Figure 2E).
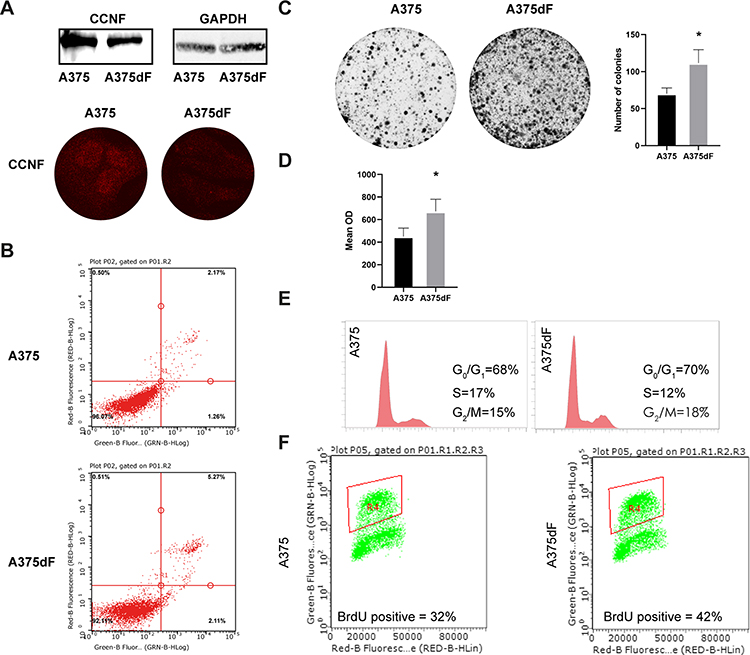 |
Figure 2 (A) The Western Blot and immunofluorescence verification of cyclin F silencing. (B) Cyclin F silencing do not affects cells viability. (C) Clonogenic assay shows the significant increase in proliferation after the cyclin F silencing. (D) MTT assay confirms higher growth rate after the cyclin F silencing. (E) Cyclin F silencing has no effect on cell cycle distribution. (F) BrdU assay revealed elevated percentage of the S-phase cell in A-375dF cell line. Asterisk indicates statistically significant difference between groups (p<0.05). |
Cyclin F Alters the Expression of the Cell Cycle Components
The impaired expression of cyclins is a common feature of cancer cells. We aimed to investigate the effect of reduction in cyclin F expression on the levels of cyclin D1, B1 and A2. Using Western blot analysis we found that cyclin F depletion caused an increase in oncogenic cyclin D1 expression and a downregulation of cyclin B1 and A2 expression (Figure 3A).
 |
Figure 3 (A) The Western Blot analysis of chosen proteins. (B) Densitometric measure of the Western Blot experiments. Asterisk indicates statistically significant difference between groups (p<0.05) (C) Immunofluorescent imaging of RRM2 expression in A375 and A375dF cells. |
Cylin F Depletion Does Not Affect RRM2 Expression in A-375 Cell Line
One of our hypotheses was to check whether cyclin F downregulation induces the expression of its target ribonucleotide reductase family member 2 (RRM2). Surprisingly, levels of RRM2 were unaffected by the decrease in cyclin F expression (Figure 3A and B). Nevertheless, we did observe a change in cell morphology which suggested that EMT was taking place. We decided to further investigate this phenomenon.
Cyclin F Downregulation Promotes Migration and Invasion of a-375 Cell Line
Low cyclin F has been previously reported to promote aggressiveness of hepatocellular carcinoma and glioma cells.12,15 We decided to ascertain whether downregulation of cyclin F would affect the ability of A-375 cells to migrate and invade through the basement membrane. A transwell migration assay and a Matrigel invasion assay demonstrated that depletion of cyclin F expression increases the cell’s migratory (Figure 4A and C) and invasive (Figure 4B and C) capacities.
 |
Figure 4 (A) The evaluation of migration of A375 cells after cyclin F silencing. (B) The change in invasive properties of A375 cells after cyclin F downregulation. (C) The migratory and invasive capacities are significantly increased after cyclin F silencing. Asterisk indicates statistically significant difference between groups (p<0.05). The immunofluorescent images of (D) F-actin and EMT markers (E) vimentin (F) N-cadherin. Cyclin F downregulation induces EMT-like properties in A375 cells. |
Low Levels of Cyclin F Induces EMT in A-375 Cell Line
Upon viral transduction to knock down cyclin F, we observed an increased number of spindle-like cells with clearly visible actin stress fibers (Figure 4D). This phenotype is one of the hallmarks of EMT and this was confirmed by Western blot and immunofluorescence staining for verified EMT markers. Upregulation of N-cadherin and vimentin was accompanied by a decrease in epithelial markers like ZO-1 (Figures 4E and F and 5E). We showed for the first time that the depletion of cyclin F promotes EMT-related events.
 |
Figure 5 The immunofluorescent staining of (A) RhoABC (B) ROCK-2 (C) pFAK (D) Paxillin. (E) The Western Blot analysis of the RhoABC, ROCK2, talin, ZO-1, paxillin and thrombospondin-1. (F) Densitometric analysis of the Western Blot experiments. |
Cyclin F Downregulation Affects the Various Cellular Processes
To shed more light on the pathways affected by cyclin F dysregulation, we analyzed several targets of cyclin F signaling. We discovered that cyclin F depletion in A-375 cells induces RhoABC expression (Figure 5A and E). Additionally, we observed upregulation of proteins related to cell-extracellular matrix (ECM) and cell–cell interactions, which can facilitate the aggressive phenotype by promoting motility (Figure 5B–D). Western blot analysis revealed increased levels of talin and paxillin, indicating that depletion of cyclin F can regulate the signal transduction between cells and ECM (Figure 5E).
We were also interested in the effect of cyclin F expression on thrombospondin-1, an inhibitor of angiogenesis. In line with our expectations, cyclin F depletion resulted in downregulation of TSBP-1, providing the trace that cyclin F activity also can somehow affects the angiogenesis, a very important factor contributing to tumor progression (Figure 5E). In addition, we investigated whether cyclin F expression affects the levels of transcription factors p53 and NF-kB, however, Western blot analysis showed no significant differences in the expression of these transcription factors between A-375dF and the parental line (Figure 3E).
Discussion
Although cyclin F does appear to play a role in cell cycle regulation and EMT, the impact of cyclin F downregulation alone in cancer is still limited. D’Angiolella et al showed that cyclin F is a key factor regulating expression of RRM2 (ribonucleotide reductase family member 2), which is crucial for providing a sufficient pool of deoxynucleotides for DNA synthesis. Upon recognition by cyclin F, RRM2 is degraded in a proteasome-dependent manner during the G2 phase when the demand for deoxyribonucleotides decreases.9 Overexpression of RRM2 is observed in numerous tumor types, including non-small-cell lung carcinoma, glioma, breast cancer, head and neck cancer and ovarian cancer,16–20 as well as in melanoma, where it is associated with worse overall survival among patients.21 There are few reports which provide evidence of a direct association between cyclin F expression and cancer. One such report showed that low cyclin F expression is associated with poorer prognosis in hepatocarcinoma patients. Lower cyclin F expression correlated positively with increase tumor size, more advanced clinical stage and occurrence of multiple tumors. An inverse correlation between cyclin F expression and the extent of tumor differentiation was observed.12 Similarly, glioma cells are characterized by lower cyclin F expression in comparison with normal brain tissue. Silencing of cyclin F gene expression resulted in increased tumor size and formation of numerous metastatic nodules in the lungs and liver in an in vivo mouse model. More interestingly, this depletion evidently affected epithelial and mesenchymal markers,15 which was consistent with our observations.
The primary objective of this study was to determine the impact of cyclin F-RRM2 axis downregulation on the A-375 primary melanoma cell line in terms of hallmarks of cancer progression. We used shRNA lentiviral gene silencing to decrease cyclin F expression and observed how this intervention affected RRM2 expression. After successful viral transduction, we detected a significant decrease in cyclin F expression, however, RRM2 levels appeared undisturbed. It is possible that a more dramatic decrease in cyclin F expression may result in the accumulation of RRM2. There is no information available in the literature about cyclin F expression loss; hence, we assumed our model to be more biologically appropriate. Interestingly, after transduction we observed a dramatic increase in cell proliferation rate. This supports our hypothesis that lower cyclin F expression would have an oncogenic effect on melanoma cells. The increase in proliferation is not associated with alterations in the cell cycle. These findings are in accordance with those of Burdova et al, who reported that HeLa cells with CRISPR-knocked out cyclin F were characterized by similar cell cycle profiles as a parental line. This suggests that, in cell culture, loss of cyclin F activity may be compensated for by other pathways.22 In contrast, during embryogenesis, cyclin F is essential for placental development. Cyclin F −/− mice bear numerous developmental anomalies and die after 10.5 embryonic days. It is possible that the effect of cyclin F downregulation may depend on individual cellular circumstances.23 The increased proliferation rate in the A-375 cell line was associated with alterations of cell cycle proteins, including upregulation of cyclin D and downregulation of cyclin A and B. Overexpression of cyclin D1 is common in various cancer types and drives cancer proliferation and metastasis.24 It has been revealed that the only melanoma cells are vulnerable to apoptosis induction by a cyclin D1 inhibitor, whereas normal melanocytes were still viable after cyclin D1 silencing.25 Cyclin D influences cell proliferation, migration and aggressiveness in melanoma through many different pathways, including the MAPK and PI3K/AKT pathways, as well as being involved in the CDKN2A/p16INK4 senescence mechanism.26 It has been previously shown that cyclin D1 may be involved in the pathway responsible for increased metastatic potential of melanoma cells. Targeting cyclin D1 via miRNA-365 significantly suppressed migration and invasion in A-375 and A-2058 melanoma cells.27 We observed that the downregulation of cyclin F resulted in a significant increase in the migration and invasion capacity of A-375 cells. Along with cyclin D upregulation, we observed downregulation of cyclin B and cyclin A. The EMT process is a key program associated with enhanced malignancy and ability to metastasize, enabling cells to turn become invasive and spread throughout the whole body. In our study, after the depletion of cyclin F levels, we observed the canonical hallmarks of EMT transformation, including decreased levels of epithelial markers like ZO-1 and increases in expression of mesenchymal markers vimentin and N-cadherin. Additionally, we observed changes in morphology, with cells becoming elongated and spindle-like in shape, with visible actin stress fibers.
Several reports have postulated the involvement of cyclins in the EMT process. Downregulation of cyclin A2 and inhibition of CDK2 prevents the cell from creating a stable attachment between the mitotic spindle and the cell cortex. As a result, the spindle becomes misoriented, which affects cell polarity and facilitates cell detachment. The reverse correlation between cell motility and cyclin A2 expression has been shown in colorectal cancer and prostate cancer.28,29 Moreover, downregulation of cyclin A2 significantly increases motility and invasiveness of fibroblasts in 2D and 3D models.30 Our results suggest that the downregulation of cyclin F exerts its effect through Rho kinases resulting in a changed phenotype. Arsic et al detailed the elegant mechanism of direct interplay between cyclin A and RhoA proteins. Depletion of cyclin A2 may reduce the activity of RhoA protein with simultaneous activation of RhoC activity and may thereby introduce cytoskeleton impairments and appearance of the actins stress fibers.30,31 Moreover, it would appear that cyclin D exhibits the opposite activity to that of cyclin A, directly binding c27 and inhibiting the interaction between RhoA and RhoGEF.
Vimentin, talin and paxillin are important components of the focal-adhesion complex, connecting the cellular actin cytoskeleton with integrins, facilitating signal transduction from the extracellular matrix (ECM) and transmitting signals from the inside of the cell to regulate integrin activity.32 Talin plays an emerging role in integrin activation and indirectly regulates the interaction between the cell and ECM, casting it as a key component in the mediation of migration and metastasis. The attenuation of cell-ECM interaction is an important step in promoting metastasis and talin has been identified as a factor contributing to development of anoikis resistance.33 The overexpression of talin has been reported in several cancer types.34–36 Upon cyclin F gene silencing we observed an upregulation of talin expression, which may be another factor contributing to a more aggressive phenotype. Along with talin upregulation, we also noticed increased expression of the scaffold protein paxillin, another focal adhesion component. It has been reported that paxillin acquires gain of function mutations during transformation in many different tumor types including melanoma. Paxillin promotes cancer cell adhesion and migration.37 Additionally, under the expression of ganglioside GD3, paxillin contributes to various malignant properties in melanoma. However, targeting paxillin with siRNA has had limited effect on suppressing tumor growth in vivo.38 These results suggest that cyclin F is involved in signal transduction between ECM and cell, which may at least in part be related to higher levels of paxillin and vimentin. Vimentin is an intermediate filament stabilizing the actin cytoskeleton and is an established EMT marker. It has been demonstrated in melanoma cells that overexpression of vimentin alone can induce the EMT and promigratory phenotype.
Another crucial event during the EMT is the loss of tight junctions responsible for cell–cell interactions. ZO-1 is a scaffolding protein which directly binds to actin filaments and participates in the organization of tight junction transmembrane proteins. Evidence regarding the role of ZO-1 in tumorigenesis is still controversial. It has been reported that the downregulation of ZO-1 increases the proliferation and invasiveness of liver cancer and breast cancer.39,40 In contrast, in isolated human melanoma cells, it has been reported that upregulation of ZO-1 is associated with a more aggressive phenotype. Additionally, it was proposed that ZO-1 can delocalize from the tight junctions and affect signaling inside the cell.41 Our study showed that cyclin F downregulation results both in decreased migration and decreased expression of ZO – 1, suggesting that ZO-1 may possibly play a dual role in melanoma progression. Further investigation is needed to describe circumstances inducing switching of ZO-1 between the roles of oncoprotein and tumor suppressor.
Interestingly, we also observed strong downregulation of thrombospondin-1 (TSBP1), a potent inhibitor of angiogenesis, upon silencing of cyclin F expression. It has been shown that TSBP1 is able to limit the metastatic potential of melanoma cells. Wang et al demonstrated a dramatic decrease in TSBP1 expression during the progression of uveal melanoma.42 In melanoma mouse models, angiogenesis, lung colonization and spontaneous pulmonary metastases were inhibited in animals with tumors overexpressing TSBP1.43 Moreover, the melanoma cell lines with higher metastatic potential were characterized by lower TSBP1 mRNA and protein levels.44 It has been shown that mutant K-ras protein can inhibit the TSBP1 promoter in intestinal epithelial cells and the silencing of mutant K-ras in colon cancer with an activated Wnt signaling did not increase TSBP1 levels. Both K-ras mutations and Wnt upregulation are common in melanoma, therefore a similar mechanism may explain the downregulation of TSBP1 upon cyclin F silencing.45,46 Additionally, it has been reported that cyclin D1 may suppress the TSBP1 and ROCK II, promoting cell motility.47 Our results are consistent with the aforementioned findings and present another possible pathway affected by cyclin F depletion.
Our data suggest that cyclin F expression alters several crucial processes, but the details of the precise mechanisms remain to be elucidated. To date, it has been shown that low cyclin F expression inversely correlates with tumor stage and extent of differentiation only in hepatocarcinoma and glioma cells.12,15 Low cyclin F expression is associated with downregulation of isocitrate dehydrogenase 1 (IDH1) via the transcription factor recombination signal binding protein for immunoglobulin kappa J region (RBPJ). The increased levels of cyclin F and IDH1 observed under metabolic stress conditions indicate that cyclin F may act as a tumor suppressor. Low cyclin F expression corresponds with higher amount of circulating tumor cells and increased expression of mesenchymal markers.15 In converse, cyclin F overexpression in ovarian cancer activates the OCT4-Nipp1/Ccnf-PP1-pRb pathway, promoting cell growth48. It is thus possible that cyclin F plays a dual role in human cancers and that the nature of this role is dependent on cell type, as well as the accompanying mutations and post-transcriptional alterations.
Conclusion
Our results suggest that even partial depletion of cyclin F resulted in a massive change in A-375 morphology and behavior. This emphasizes how important this factor is to cellular homeostasis, in that even slight changes in protein expression can drive cells into a more aggressive malignant phenotype. Further research is needed to resolve the mechanistic details of the action of cyclin F in human cancers.
Funding
This work was supported by a grant to A.G. from the National Science Center (2016/21/B/NZ7/01121).
Disclosure
The authors report no conflicts of interest in this work.
References
1. Kozar I, Margue C, Rothengatter S, Haan C, Kreis S. Many ways to resistance: how melanoma cells evade targeted therapies. Biochim Biophys Acta Rev Cancer. 2019;1871(2):313–322. doi:10.1016/j.bbcan.2019.02.002
2. Lim SY, Menzies AM, Rizos H. Mechanisms and strategies to overcome resistance to molecularly targeted therapy for melanoma: resistance to melanoma targeted therapy. Cancer. 2017;123(S11):2118–2129. doi:10.1002/cncr.30435
3. Mani SA, Guo W, Liao M-J, et al. The epithelial-mesenchymal transition generates cells with properties of stem cells. Cell. 2008;133(4):704–715. doi:10.1016/j.cell.2008.03.027
4. Shibue T, Weinberg RA. EMT, CSCs, and drug resistance: the mechanistic link and clinical implications. Nat Rev Clin Oncol. 2017;14(10):611–629. doi:10.1038/nrclinonc.2017.44
5. Derynck R, Weinberg RA. EMT and cancer: more than meets the eye. Dev Cell. 2019;49(3):313–316. doi:10.1016/j.devcel.2019.04.026
6. Saitoh M. Involvement of partial EMT in cancer progression. J Biochem. 2018;164(4):257–264. doi:10.1093/jb/mvy047
7. Cardozo T, Pagano M. The SCF ubiquitin ligase: insights into a molecular machine. Nat Rev Mol Cell Biol. 2004;5(9):739–751. doi:10.1038/nrm1471
8. Wang D, Ma L, Wang B, Liu J, Wei W. E3 ubiquitin ligases in cancer and implications for therapies. Cancer Metastasis Rev. 2017;36(4):683–702. doi:10.1007/s10555-017-9703-z
9. D’Angiolella V, Donato V, Forrester FM, et al. Cyclin F-mediated degradation of ribonucleotide reductase M2 controls genome integrity and DNA repair. Cell. 2012;149(5):1023–1034. doi:10.1016/j.cell.2012.03.043
10. Klein DK, Hoffmann S, Ahlskog JK, et al. Cyclin F suppresses B-Myb activity to promote cell cycle checkpoint control. Nat Commun. 2015;6:5800. doi:10.1038/ncomms6800
11. Bai C, Richman R, Elledge SJ. Human cyclin F. EMBO J. 1994;13(24):6087–6098. doi:10.1002/j.1460-2075.1994.tb06955.x
12. Fu J, Qiu H, Cai M, et al. Low cyclin F expression in hepatocellular carcinoma associates with poor differentiation and unfavorable prognosis. Cancer Sci. 2013;104(4):508–515. doi:10.1111/cas.12100
13. Yu Y, Nakagawa T, Morohoshi A, et al. Pathogenic mutations in the ALS gene CCNF cause cytoplasmic mislocalization of Cyclin F and elevated VCP ATPase activity. Hum Mol Genet. 2019;28(20):3486–3497. doi:10.1093/hmg/ddz119
14. Goldman MJ, Craft B, Hastie M, et al. Visualizing and interpreting cancer genomics data via the xena platform. Nat Biotechnol. 2020;38(6):675–678. doi:10.1038/s41587-020-0546-8
15. Deshmukh RS, Sharma S, Das S. Cyclin F-dependent degradation of RBPJ inhibits IDH1 R132H -mediated tumorigenesis. Cancer Res. 2018. doi:10.1158/0008-5472.CAN-18-1772
16. Grossi F, Rijavec E, Dal Bello MG, et al. Ribonucleotide reductase subunit 2 (RRM2) predicts shorter survival in resected stage I–III non-small cell lung cancer (NSCLC) patients. Lung Cancer. 2012;77:S23. doi:10.1016/j.lungcan.2012.05.038
17. Putluri N, Maity S, Kommagani R, et al. Pathway-centric integrative analysis identifies RRM2 as a prognostic marker in breast cancer associated with poor survival and tamoxifen resistance. Neoplasia. 2014;16(5):390–402. doi:10.1016/j.neo.2014.05.007
18. Rahman MA, Amin ARMR, Wang D, et al. RRM2 regulates Bcl-2 in head and neck and lung cancers: a potential target for cancer therapy. Clin Cancer Res. 2013;19(13):3416–3428. doi:10.1158/1078-0432.CCR-13-0073
19. Sun H, Yang B, Zhang H, et al. RRM2 is a potential prognostic biomarker with functional significance in glioma. Int J Biol Sci. 2019;15(3):533–543. doi:10.7150/ijbs.30114
20. Wang L-M, Lu -F-F, Zhang S-Y, Yao R-Y, Xing X-M, Wei Z-M. Overexpression of catalytic subunit M2 in patients with ovarian cancer. Chin Med J. 2012;125(12):2151–2156.
21. Aird KM, Zhang G, Li H, et al. Suppression of nucleotide metabolism underlies the establishment and maintenance of oncogene-induced senescence. Cell Rep. 2013;3(4):1252–1265. doi:10.1016/j.celrep.2013.03.004
22. Burdova K, Yang H, Faedda R, et al. E2F1 proteolysis via SCF -cyclin F underlies synthetic lethality between cyclin F loss and Chk1 inhibition. EMBO J. 2019;38(20). doi:10.15252/embj.2018101443
23. Tetzlaff MT, Bai C, Finegold M, et al. Cyclin F disruption compromises placental development and affects normal cell cycle execution. Mol Cell Biol. 2004;24(6):2487–2498. doi:10.1128/mcb.24.6.2487-2498.2004
24. Albero R, Enjuanes A, Demajo S, et al. Cyclin D1 overexpression induces global transcriptional downregulation in lymphoid neoplasms. J Clin Invest. 2018;128(9):4132–4147. doi:10.1172/JCI96520
25. Bastian BC. Understanding the progression of melanocytic neoplasia using genomic analysis: from fields to cancer. Oncogene. 2003;22(20):3081–3086. doi:10.1038/sj.onc.1206463
26. González‐Ruiz L, González‐Moles MÁ, González‐Ruiz I, Ruiz‐Ávila I, Ayén Á, Ramos‐García P. An update on the implications of cyclin D1 in melanomas. Pigment Cell Melanoma Res. 2020;33(6):788–805. doi:10.1111/pcmr.12874
27. Zhu Y, Wen X, Zhao P. MicroRNA-365 inhibits cell growth and promotes apoptosis in melanoma by targeting BCL2 and cyclin D1 (CCND1). Med Sci Monit. 2018;24:3679–3692. doi:10.12659/MSM.909633
28. Fang Y, Liang X, Jiang W, Li J, Xu J, Cai X. Cyclin B1 suppresses colorectal cancer invasion and metastasis by regulating E-cadherin. Guan X-Y, ed. PLoS One. 2015;10(5):e0126875. doi:10.1371/journal.pone.0126875
29. Mashal RD, Lester S, Corless C, et al. Expression of cell cycle-regulated proteins in prostate cancer. Cancer Res. 1996;56(18):4159–4163.
30. Arsic N, Bendris N, Peter M, et al. A novel function for cyclin A2: control of cell invasion via RhoA signaling. J Cell Biol. 2012;196(1):147–162. doi:10.1083/jcb.201102085
31. Bendris N, Cheung CT, Leong HS, et al. Cyclin A2, a novel regulator of EMT. Cell Mol Life Sci. 2014;71(24):4881–4894. doi:10.1007/s00018-014-1654-8
32. Desiniotis A, Kyprianou N. Significance of talin in cancer progression and metastasis. Int Rev Cell Mol Biol. 2011;289:117–147. doi:10.1016/B978-0-12-386039-2.00004-3
33. Cao Z, Livas T, Kyprianou N. Anoikis and EMT: lethal “liaisons” during cancer progression. Crit Rev Oncog. 2016;21(3–4):155–168. doi:10.1615/CritRevOncog.2016016955
34. Fang K, Dai W, Ren Y-H, Xu Y-C, Zhang S, Qian Y-B. Both talin-1 and talin-2 correlate with malignancy potential of the human hepatocellular carcinoma MHCC-97 L cell. BMC Cancer. 2016;16(1):1. doi:10.1186/s12885-016-2076-9
35. Lai M-T, Hua C-H, Tsai M-H, et al. Talin-1 overexpression defines high risk for aggressive oral squamous cell carcinoma and promotes cancer metastasis. J Pathol. 2011;224(3):367–376. doi:10.1002/path.2867
36. Xu Y-F, Ren X-Y, Li Y-Q, et al. High expression of talin-1 is associated with poor prognosis in patients with nasopharyngeal carcinoma. BMC Cancer. 2015;15(1):1. doi:10.1186/s12885-015-1351-5
37. López-Colomé AM, Lee-Rivera I, Benavides-Hidalgo R, López E. Paxillin: a crossroad in pathological cell migration. J Hematol Oncol. 2017;10(1). doi:10.1186/s13045-017-0418-y
38. Makino Y, Hamamura K, Takei Y, et al. A therapeutic trial of human melanomas with combined small interfering RNAs targeting adaptor molecules p130Cas and paxillin activated under expression of ganglioside GD3. Biochim Biophys Acta Gen Subj. 2016;1860(8):1753–1763. doi:10.1016/j.bbagen.2016.04.005
39. Martin TA, Watkins G, Mansel RE, Jiang WG. Loss of tight junction plaque molecules in breast cancer tissues is associated with a poor prognosis in patients with breast cancer. Eur J Cancer. 2004;40(18):2717–2725. doi:10.1016/j.ejca.2004.08.008
40. Zhang X, Wang L, Zhang H, Tu F, Qiang Y, Nie C. Decreased expression of ZO-1 is associated with tumor metastases in liver cancer. Oncol Lett. 2019;17(2):1859–1864. doi:10.3892/ol.2018.9765
41. Smalley KSM, Brafford P, Haass NK, Brandner JM, Brown E, Herlyn M. Up-regulated expression of zonula occludens protein-1 in human melanoma associates with N-cadherin and contributes to invasion and adhesion. Am J Pathol. 2005;166(5):1541–1554. doi:10.1016/S0002-9440(10)62370-X
42. Wang S, Neekhra A, Albert DM, Sorenson CM, Sheibani N. Suppression of thrombospondin-1 expression during uveal melanoma progression and its potential therapeutic utility. Arch Ophthalmol. 2012;130(3):336–341. doi:10.1001/archopthalmol.2011.1503
43. Rofstad EK, Graff BA. Thrombospondin-1-mediated metastasis suppression by the primary tumor in human melanoma xenografts. J Invest Dermatol. 2001;117(5):1042–1049. doi:10.1046/j.0022-202x.2001.01552.x
44. Zabrenetzky V, Harris CC, Steeg PS, Roberts DD. Expression of the extracellular matrix molecule thrombospondin inversely correlates with malignant progression in melanoma, lung and breast carcinoma cell lines. Int J Cancer. 1994;59(2):191–195. doi:10.1002/ijc.2910590209
45. Jo W-S, Mizukami Y, Duerr E-M, Zukerberg LR, Chung DC. Wnt signaling can repress thrombospondin-1 expression in colonic tumorigenesis. Cancer Biol Ther. 2005;4(12):1361–1366. doi:10.4161/cbt.4.12.2201
46. Kaur A, Webster MR, Weeraratna AT. In the Wnt-er of life: wnt signalling in melanoma and ageing. Br J Cancer. 2016;115(11):1273–1279. doi:10.1038/bjc.2016.332
47. Li Z, Wang C, Jiao X, et al. Cyclin D1 regulates cellular migration through the inhibition of thrombospondin 1 and ROCK signaling. Mol Cell Biol. 2006;26(11):4240–4256. doi:10.1128/MCB.02124-05
48. Comisso E, Scarola M, Rosso M, et al. OCT4 controls mitotic stability and inactivates the RB tumor suppressor pathway to enhance ovarian cancer aggressiveness. Oncogene. 2017;36(30):4253–4266. doi:10.1038/onc.2017.20
 © 2020 The Author(s). This work is published and licensed by Dove Medical Press Limited. The
full terms of this license are available at https://www.dovepress.com/terms
and incorporate the Creative Commons Attribution
- Non Commercial (unported, 3.0) License.
By accessing the work you hereby accept the Terms. Non-commercial uses of the work are permitted
without any further permission from Dove Medical Press Limited, provided the work is properly
attributed. For permission for commercial use of this work, please see paragraphs 4.2 and 5 of our Terms.
© 2020 The Author(s). This work is published and licensed by Dove Medical Press Limited. The
full terms of this license are available at https://www.dovepress.com/terms
and incorporate the Creative Commons Attribution
- Non Commercial (unported, 3.0) License.
By accessing the work you hereby accept the Terms. Non-commercial uses of the work are permitted
without any further permission from Dove Medical Press Limited, provided the work is properly
attributed. For permission for commercial use of this work, please see paragraphs 4.2 and 5 of our Terms.