Back to Journals » International Journal of Nanomedicine » Volume 18
Customizable Dual-Fluorescent Nanoparticles for Tracing and Quantifying of Cell Transport
Authors Ta W, Li X, Song J, Hua R, Zheng Y, Lu W
Received 8 November 2022
Accepted for publication 7 March 2023
Published 5 April 2023 Volume 2023:18 Pages 1823—1834
DOI https://doi.org/10.2147/IJN.S394953
Checked for plagiarism Yes
Review by Single anonymous peer review
Peer reviewer comments 2
Editor who approved publication: Dr Yan Shen
Wenjing Ta, Xingyue Li, Jihong Song, Ruochen Hua, Yuting Zheng, Wen Lu
School of Pharmacy, Health Science Center, Xi’an Jiaotong University, Xi’an, People’s Republic of China
Correspondence: Wen Lu, School of Pharmacy, Health Science Center, Xi’an Jiaotong University, Xi’an, 710061, People’s Republic of China, Email [email protected]
Purpose: Nanotechnology-based drug delivery systems (nano-DDS) have been developed to be a promising strategy to improve the efficacy, safety, physicochemical and pharmacokinetic/pharmacodynamics properties of drugs. It is very necessary to elucidate the delivery process in vivo or in cells for the rational design and accurate preparation of nano-DDS. The aim of this study was to construct a nano-DDS to visualize and quantify the intracellular behavior of the loaded cargo and carrier in such a system.
Methods: A carboxyl-terminal end of poly(lactic-co-glycolic acid) polymer was fluorescently labeled with rhodamine B by conjugation of ethylenediamine. Dual-fluorescent nanoparticles (DFPs) were prepared from this fluorescently labeled polymer to encapsulate a fluorescent cargo, coumarin 6. The carrier and cargo of DFPs were monitored by confocal fluorescence microscopy during cellular uptake. Furthermore, the transcellular transportation of DFPs was evaluated quantitatively by measuring the fluorescence intensity.
Results: The obtained fluorescent polymer showed stable and quantifiable characteristics. DFPs could be customized in terms of coumarin 6 content (97.7± 1.0%), size (367.3± 1.7 nm) and dual-emission fluorescence (green cargo and red carrier). DFPs did not significantly affect cell viability, the integrity of cell monolayers and the microscopic morphology at concentrations below 0.7 mg/mL within 3 h of co-incubation with Caco-2 cells. Multichannel fluorescence monitoring revealed that the fluorescence intensity of the carrier and cargo increased with time, but not synchronously. By calculating the residual, intracellular, and transport amounts of DFPs, the material balance between the total amount of cellular transport and the dose administered was obtained.
Conclusion: Based on the advantages of dual fluorescent labeling, the differential behavior of cell trafficking can be visualized and quantitatively analyzed for the cargo and carrier of DFPs. These results provide insights into the cellular transport process of holistic nanoparticles and complement our understanding of the biological behaviors of nano-DDS.
Keywords: dual-fluorescent nanoparticles, tracking cellular uptake, fluorescence imaging, quantitative cell transport, drug delivery
Introduction
Over the past few decades, nanotechnology-based drug delivery systems (nano-DDS) have attracted great attention, and many efforts have been made for the development and commercial application of nano-based pharmaceutical products in both academic and industrial institutions. In 1995, Doxil® was approved for commercialization as a pegylated liposomal formulation of doxorubicin, which was considered the best example of how nano-DDS can advance patient care.1 Currently, many novel nano-DDS are being developed to improve the efficacy, safety, physicochemical or pharmacokinetic/pharmacodynamics properties. In particular, multifunctional nano-DDS offered numerous advantages simultaneously,2–4 and they have been developed for the detection, diagnosis and treatment of diseases.5
With the rapid increase in research and products of nano-DDS, it is essential to provide a comprehensive biological behaviors characterization. Many studies have focused on elucidating the delivery process of nano-DDS in vivo or in cells, including pharmacokinetics, drug distribution, excretion and cellular transport, endocytosis as well as intercellular trafficking.6–9 The method to analyze behavior in vivo is to quantify a transported substance using liquid chromatography-mass spectrometry (LC-MS) or other quantitative instruments. For example, plasma pharmacokinetics and brain tissue distribution of zolmitriptan loaded chitosan nanoparticles in rats were presented by establishing an LC-MS assay to determine the content of zolmitriptan.10 A common method to study cellular transport is to investigate temporal trends of the transported substance with the help of a recognized device, Transwell. In one study, photosensitizer loaded mucus-penetrating nanoparticles were prepared for photodynamic therapy, and the uptake and transport characteristics of cells were analyzed using high-performance liquid chromatography with fluorescence detection to quantify photosensitizers in Transwell model.11 In another Transwell model study, Alexa Fluor 647 labeled salmon calcitonin was synthesized and encapsulated into penetratin-conjugated liposomes for cell permeation imaging studies.12 These studies have clearly demonstrated the in vitro or in vivo behavior of loaded substances in nano-DDS. However, the in vitro and in vivo behavior of the carrier (another important component of nano-DDS) has been reported rarely. It is a pending problem at what time the behavior of carrier is consistent with the behavior of loaded substance or at what time the load is released from the carrier. A deeper understanding of the transport process and behavior of holistic nano-DDS is strongly recommended.
Poly-(lactic-co-glycolic acid) polymers (PLGA) are a well-researched class of polymers with good biocompatibility and high encapsulation capacity for hydrophobic drugs.13 Therefore, they are “ideal” carrier for nano-DDS preparation to deliver drugs and tracers. Rhodamine B is a typical fluorescent organic dye with high fluorescence efficiency and photostability, and can be readily detected in cell experiments. In order to visualize and quantify the carrier of nano-DDS, rhodamine B-modified PLGA was designed and synthesized in this study. Based on the hydrophobic core of PLGA, coumarin 6 was loaded into PLGA nanoparticles for visualization and quantization of nano-DDS payload. Thus, dual-fluorescent nanoparticles (DFPs) were constructed, and their transcellular transport processes were elucidated comprehensively using fluorescence imaging and quantitative analysis techniques, which contributes to a clearer understanding of the cellular behavior of nano-DDS.
Materials and Methods
Materials
Detailed information on materials was provided in the Supplementary Material.
Fluorescent Polymer Preparation and Characterization
Detailed methods for the synthesis and characterization of Rhodamine B modified PLGA were described in the Supplementary Material.
Preparation and Characterization of DFPs
DFPs were prepared according to a method described previously.14 Briefly, B-PLGA (60 mg) in 2.0 mL of dichloromethane containing 1.0 mg of coumarin 6 was added dropwise to 1% (w/v) aqueous PVA solution (20.0 mL) and emulsified using an ultrasonic cell crusher (JY 92-II, Ningbo Scienta Biotechnology CO. LTD. China). The emulsion was stirred overnight, and DFPs were collected by centrifugation at 12,000 r/min under 4°C for 15 min, washed with double distilled water and lyophilized for 24 h. The supernatant was recycled for quantification of payload.
The aliquot supernatant was condensed and dissolved in methanol. The fluorescence intensity of coumarin 6 in the supernatant was measured using a fluorescence spectrophotometer (FTIR-8400s, Shimadzu, Japan) at an excitation wavelength of 450 nm and an emission wavelength of 493 nm. The content was calculated using a calibration curve constructed from different concentrations of coumarin-6 prepared in methanol. The encapsulation efficiency was calculated as the difference between the added content of coumarin-6 and the content in the supernatant.15
Coumarin 6 release from DFPs was determined by suspending DFPs in Hank’s balanced salt solution (HBSS, 2.0 mL) at pH 7.2. The suspension was placed in a dialysis bag (molecular weight cutoff=5000 Da), followed by immersion in another 20.0 mL HBSS at 37°C with agitation at a constant speed of 100 r/min. At predetermined time intervals, the release medium (2.0 mL) was withdrawn and an equal volume of fresh HBSS was added. The coumarin-6 released was quantified by the fluorescence assay described above.
The mean diameter and polydispersity of DFPs were measured by dynamic light scattering (HYL-1080, DanDong Hylology Instruments Co., Ltd., China). The morphology of DFPs was examined by Transmission Electron Microscopy (TEM, JEM-2100F, Electronics Corporation of Japan).16 The fluorescence characteristics of DFPs were investigated using a fluorescence spectrophotometer and fluorescence microscope (ECLIPSE Ti-U, Niko, Tokyo, Japan).
Exposure Experiments of DFPs to Caco-2 Cells
Effects on Cell Viability
The in vitro cytotoxicity of DFPs was assessed by measuring the inhibition of cell growth using 3-[4,5-dimethylthiazol-2-yl]-2,5-diphenyltetrazolium bromide (MTT) assay.17 Caco-2 cells were obtained from the CHI Scientific Ltd. (Jiangsu, China). Cells (5×10³ cells/well) were incubated with prepared concentrations of DFPs (0~0.8 mg/mL) for 4 h and 24 h. At the end of the incubation period, 20 μL of MTT (5.0 mg/mL) solution was added to each well and cells were incubated for an additional 4 h. Cell viability was calculated using the equation:  .
.
Effects on the Integrity of Cell Monolayer
Caco-2 cells (1×10⁵ cells/cm2) were seeded on polycarbonate 24-well Transwell® inserts (mean pore size=3.0 μm, surface area=0.3 cm2, Millipore, Bedford, MA, USA) and differentiated to a monolayer of polarized cells. Trans-epithelial electric resistance (TEER) value was monitored by a Millicell® ERS-2 voltmeter (Millipore, USA). The monolayer was confluent when TEER value reached a plateau with a reading above 300 Ω•cm2 and was then used for experiments.14 Freshly prepared DFPs were dispersed in HBSS (pH 7.2) at a concentration of 0.5 mg/mL and added to the apical side of Transwell® inserts. Then, cells were incubated at 37°C on a thermostatic shaker at 50 r/min. TEER value was recorded after 0.5, 1.0, 1.5, 2.0, 2.5, 3.0 and 4.0 h. Cells incubated with blank HBSS were used as the control.
Effects on Cell Morphology
DFPs dispersion (0.5 mg/mL) was added to Caco-2 cells on cover slips and incubated for 3 h. Cells incubated with blank HBSS were used as the control. At the end of the incubation period, cells were preserved in glutaraldehyde solution at 4°C overnight. Followed by dehydrated through a series of increasing concentrations of ethanol solutions, cells were dried and coated with gold. Cell layers were examined by scanning electron microscope (SEM, TM-1000, Hitachi High-tech Ltd., Japan).
Cell Imaging
Cellular internalization of DFPs was confirmed by confocal laser scanning microscopy. Caco-2 cells were cultured on cover slips up to confluence and then incubated with 0.2 mg/mL of DFPs dispersion. At predetermined times, treated cells were washed thrice with phosphate buffer solution, fixed with 4.0% paraformaldehyde for 20 min at 4°C and stained with Hoechst 33258 for 15 min at room temperature. Cells were imaged with a confocal laser scanning microscope (C2, Nikon Ltd., Japan). For multi-channel fluorescence co-localization, cell nuclei stained by Hoechst were excited at 405 nm and the emission was recorded around 440 nm. The cargo of DFPs (coumarin 6) was excited at 460 nm, and the emission was recorded around 500 nm. The carrier of DFPs (B-PLGA) was excited at 525 nm, and the emission was recorded around 580 nm.
DFPs Transport in Caco-2 Cell Monolayers
Caco-2 cells were seeded on 24-well Transwell® inserts and cultured until TEER > 300 Ω•cm2. After rinsing of cells, DFPs dispersion (0.5 mg/mL) was added to apical side (AP) of inserts and 1.0 mL of HBSS was added to basolateral side (BL). Cells were maintained at 37°C on a thermostatic shaker at 50 r/min. At pre-determined intervals, samples were collected and processed as follows: (1) AP solution was collected and cells were washed gently twice with fresh HBSS. Then washing solution was incorporated into the AP solution as the residual sample. (2) 0.3 mL of RIPA lysate was added to the cell layer of inserts, and cells were lysed on an ice bath for 30 min. The lysate mixture was divided evenly into three parts. One part was used to determine the total protein amount of each specimen using the bicinchoninic-acid method. One portion was added to methanol (2.0 mL) to dissolve the released coumarin 6 and used as the released-drug sample. The third portion was used as the intracellular sample to determine the total amount of coumarin 6 and B-PLGA in cells. (3) HBSS from the BL was collected as a transport sample. The collected residual, intracellular and transport samples were concentrated to dryness by a vacuum concentrator. DFPs in concentrates were depolymerized by ultrasound with dichloromethane (2.0 mL) for 3 min. After dichloromethane was recycled, 2.0 mL of methanol was added to re-dissolve coumarin 6 and B-PLGA. The content of coumarin 6 in the released-drug sample as well as the content of coumarin 6 and B-PLGA in the residual, intracellular and transport samples were analyzed quantitatively by fluorescence assay. All contents were calculated using the following equation:

where Q is the release amount, residual amount, intracellular amount or transport amount (μg/mg protein, abbreviation: μg/mg pro); cx is the content of coumarin 6 or B-PLGA (μg/mL) in each sample; D is the dilution ratio of each sample; V is the volume of each sample (mL); W is total protein amount in each sample (mg).
Statistical Analysis
Data were presented as the mean ± standard deviation (SD). Statistical analysis was performed by the Student’s t-test for two groups and one-way ANOVA for three or more groups. P<0.05 was considered statistically significant.
Results and Discussion
Conjugation of Rhodamine B and PLGA Formation Fluorescent Polymer
Considering the molecular structural characteristics of the terminal carboxyl group in PLGA and the free carboxyl group in rhodamine B, ethylenediamine was selected as the intermediate linking molecule. As shown in the schematic representation of rhodamine B modified PLGA (Figure 1), the carboxyl terminal end of PLGA was first activated with N-hydroxysuccinimide (NHS) and N-Ethyl-N’-(3-dimethylaminopropyl) carbodiimide hydrochloride (EDCI) to form aminated PLGA by conjugating ethylenediamine (Figure S1). The aminated PLGA was functionalized by conjugating a free-amine terminal group to the carboxylic group of rhodamine B. Thus, a polymer with fluorescence properties was obtained.
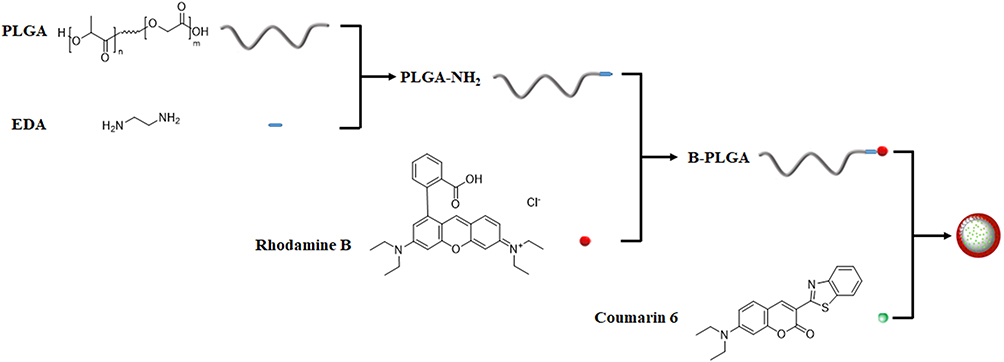 |
Figure 1 Scheme of the assembly of the dual-fluorescent nanoparticles encapsulated coumarin 6 via the conjugation of Rhodamine B and PLGA to form fluorescent polymer. |
Figure 2A FS exhibited fluorescence spectra of rhodamine B, PLGA, PLGA-NH2 and B-PLGA. Rhodamine B and B-PLGA showed strong fluorescence properties in the range of 550–600 nm at the excitation wavelength of rhodamine B (525 nm), suggesting that the π-conjugation of rigid chromophore had not been destroyed.18 However, PLGA and PLGA-NH2 did not exhibit fluorescence emission spectra in the same wavelength range.
 |
Figure 2 Characteristics of B-PLGA, PLGA-NH2 and PLGA. (A) Fluorescence spectra (FS). (B) Fourier-transform infrared spectra (FTIR). (C) Differential scanning calorimetric curve (DSC). (D) X-ray photoelectron spectra (XPS). |
The differential scanning calorimetry (DSC) thermograms of PLGA, rhodamine B, PLGA-NH2 and B-PLGA are presented in Figure 2B DSC. The endothermic peak from PLGA at 48.73°C corresponded to the glass transition temperature of PLGA, which was consistent with previous research.19 The peak for rhodamine B at 198.06°C corresponded to the melting point peak, which was consistent with the data obtained by the melting point tester. In the case of the physical mixture of PLGA and rhodamine B, peaks at both 48.02°C and 197.34°C were found on the DSC thermogram. However, these two peaks disappeared on the DSC thermogram of B-PLGA and a wide endothermic peak appeared at 319.92°C instead, suggesting that PLGA had chemical interactions with rhodamine B.
The possibilities of covalent binding between PLGA and rhodamine B were further investigated by Fourier-transform infrared (FTIR), X-ray Photoelectron Spectroscopy (XPS) and Nuclear Magnetic Resonance Spectroscopy (1H-NMR). The FTIR spectrum of PLGA showed characteristic peaks at 1750 cm−1 corresponding to –C=O stretching vibrations, 2850 cm−1 and 3000 cm−1 corresponding to –CH–, –CH2– and –CH3 stretching vibrations,20 1188 cm−1 and 1094 cm−1 related to –C–O–C– stretching vibrations. The spectrum of PLGA-NH2 had the characteristic peaks stated above for PLGA, but also absorption peaks at 1674 cm−1 (amide I, –C=O stretching vibrations) and 1542 cm−1 (amide II, CN–H bending vibration), which suggested an interaction between the amino groups of ethylenediamine and the terminal carboxyl group in PLGA.21 For B-PLGA, the characteristic peaks of PLGA, the amide I band at 1674 cm−1 and the amide II band at 1550 cm−1 were visible in the FTIR spectrum. Moreover, B-PLGA showed characteristic peaks corresponding to the vibration of benzene ring skeleton at 1596 cm−1 and 1519 cm−1, and the peak at 2260 cm−1 related to the stretching vibration of the =C–H on the benzene ring, which was ascribed to the combination of rhodamine B and PLGA. XPS spectra of PLGA-NH2 and B-PLGA showed peaks attributable to carbon C1s, oxygen O1s and nitrogen N1s, whereas the spectra of PLGA only appeared oxygen and carbon peaks. The N1s characteristic peak at the binding energy near 397–398 eV in PLGA-NH2 and B-PLGA spectra was related to the nitrogen from ethylenediamine and rhodamine B.
The 1H-NMR spectrum of B-PLGA was used to further characterize the structure of conjugate (Figure S2). The characteristic signals appearing between 6.74 ppm and 8.35 ppm were assigned to the aromatic ring of rhodamine B. The multiplets at 5.24–5.31 ppm, 4.62–4.89 ppm and 1.25–1.55 ppm corresponded to the methine hydrogen of lactide units, methylene hydrogen of glycolide units and the methyl hydrogen of lactide units, respectively, and these peaks also appeared in the 1H-NMR spectrum of PLGA-NH2 and PLGA. In Figure S2 B-PLGA and PLGA-NH2, the peaks at 3.00–3.30 ppm were contributed by the –CH2 of the ethylenediamine unit of PLGA-NH2 or B-PLGA. Due to the high molecular weight of the polymer, 1H signals from the amino protons near 7 ppm were not distinct for PLGA-NH2 or B-PLGA. The peak at 7.29 ppm was attributed to the signal of residual CHCl3 from CDCl3.
These results indicated the covalent binding of rhodamine and PLGA to form fluorescent polymers. The fluorescence characteristics of the fluorescent polymer were detailed in the Supplementary Material. Due to the good correlation between fluorescence intensity and concentration, B-PLGA could be analyzed quantitatively using fluorescence spectrophotometry (Table S1 and S3). In addition, B-PLGA could maintain stable fluorescence intensity under low temperature in the dark (Figure S4).
Creation of Customized Dual-Fluorescent Nanoparticles
To track the carrier of nanoparticles independently from its cargo, B-PLGA was used as a carrier material to prepare DFPs (Figure 1). Coumarin 6 is a lipophilic fluorescent dye that is encapsulated readily in PLGA nanoparticles and can be used for cargo tracing.22 Thus, a high encapsulation efficiency of 97.7 ± 1.0% was obtained for DFPs. The release of coumarin 6 from DFPs was relatively slow, and the cumulative release rate of 6 h was less than 2%, without a burst release. DFPs were discrete, spherical or quasi-spherical microstructure with a smooth surface, as shown in Figure 3A. The mean particle size was 367.3 ± 1.7 nm with a span of 0.51, indicating low polydispersity (Figure 3B). Due to dual-fluorescence labeling of the nanoparticles, the red fluorescence of carrier (B-PLGA) and the green fluorescence of cargo (coumarin 6) can be observed clearly at different excitation wavelengths by fluorescence microscopy, and yellow or yellow-green fluorescence was also observed at the overlap part (Figure 3C).
 |
Figure 3 Characteristics of dual-fluorescent nanoparticles (DFPs). (A) Transmission electron microscopy images. (B) Size distribution histogram. (C) Fluorescence microscopy images, coumarin 6 fluorescence was shown in green fluorescence and B-PLGA was shown in red fluorescence while the overlap part was yellow or yellow-green fluorescence. (D) Fluorescence spectra of DFPs in the intact and broken states. |
To obtain deeper insight into the fluorescence characteristics of DFPs, the fluorescence spectra of nanoparticles in the intact and broken states were recorded (Figure 3D). When DFPs were dispersed in methanol, a fluorescence emission peak was observed at 550–610 nm at an excitation wavelength of 525 nm, which was consistent with the fluorescence spectrum of B-PLGA. However, the emission peak of coumarin-6 at 480–520 nm was not observed at an excitation wavelength of 450 nm. When DFPs were dissolved in dichloromethane and then dispersed in methanol, fluorescence emission peaks at 550–610 nm were observed, but emission peaks at 480–520 nm were also documented at the corresponding excitation wavelength. These results suggested that a well-organized fluorescent polymer permitted DFPs preparation.
Maintenance of the Viability and Integrity of Caco-2 Cells
The in vitro toxicity of nanoparticles has been reported to be highly dependent upon cell type and to be controlled by their shape, size and surface function.23 It is important to evaluate the cytotoxicity of nanoparticles. The effects of DFPs on the viability of Caco-2 cells are shown in Figure 4A. Survival rate of cells in various concentrations of DFPs was close to 100% after 4 h of incubation, and there was no significant effect on cell viability. Toxicity was observed after 24 h of incubation at DFPs concentrations of 0.7 and 0.8 mg/mL, and the population of living cell dropped to 80% of the initial number.
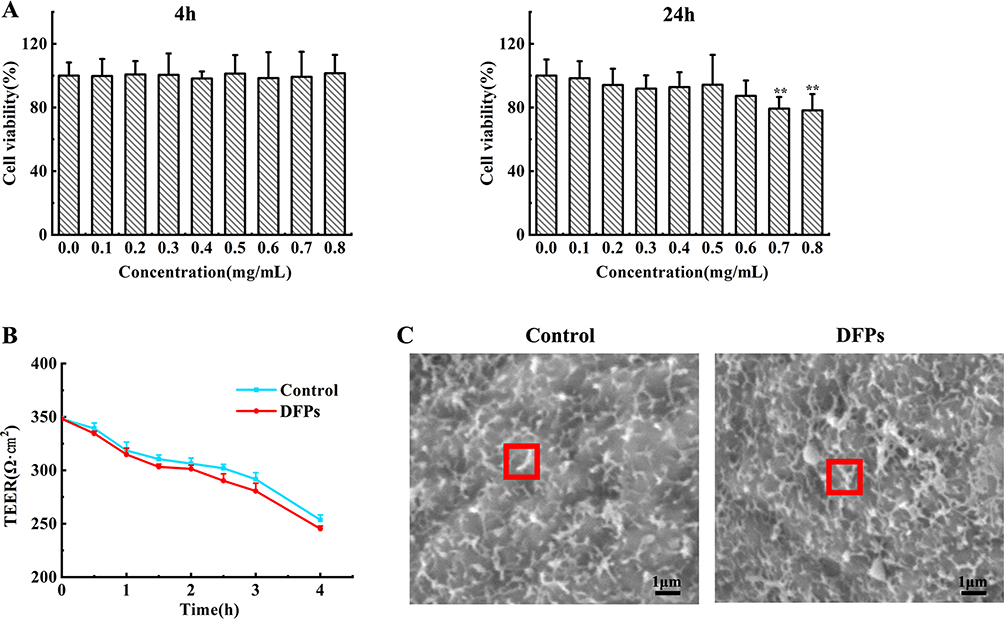 |
Figure 4 Viability and integrity of Caco-2 cells exposed to dual-fluorescent nanoparticles (DFPs). (A) Cell viability test (n=6). (B) TEER test (n=3). (C) SEM Image (Red box represents microvilli on the surface of Caco-2.). Each value represents the mean ± S.D. *P < 0.05, DFPs vs control. |
TEER is an important parameter to evaluate the integrity of Caco-2 cell monolayer.24 TEER was monitored during incubation of cells with DFPs or HBSS up to 4 h. Results showed that TEER value decreased gradually with incubation time and there was no significant difference between DFPs and HBSS groups (Figure 4B). Their TEER values were reduced simultaneously by ~28% after 4 h of incubation, but within the limits required to conduct the experiment (~250 Ω•cm2). The decrease in TEER value may be due to the change of culture environment from an incubator at 37°C and 5% CO2 to a shaker at 37°C.25
SEM images representing the morphology of Caco-2 cells after incubation with DFPs are presented in Figure 4C. In terms of microscopic morphology, microvilli were observed as strip-shaped on the cell surface in DFPs group. Moreover, a similar homogeneity in morphology was found on the cell surface between the control group and DFPs group. These data suggested that there was no significant change in cell surface morphology after incubation with DFPs for 3 h.
Dual Fluorescence Visualization of DFPs Within Cells
Figure 5A shows multi-channel fluorescence co-localization of Caco-2 cells incubated with DFPs over time. The nucleus (blue fluorescence), coumarin 6 (green fluorescence) and B-PLGA (red fluorescence) can be observed clearly. In the merged images, the overlap of green fluorescence and red fluorescence was visible. Obviously, these images provided information about the uptake of DFPs into Caco-2 cells as well as the distribution of DFPs within cytoplasm. In addition, the brightness of green fluorescence and red fluorescence increased gradually over time, reaching a maximum at 120 min, and brightness decreased slowly to the end of experimental observation. However, this variation trend was slightly different for merged images. Although the overlap in fluorescence brightness increased initially and then decreased with time, more green fluorescence was observed at 150 min and more red fluorescence was observed at 180 min after the maximum peak of 120 min. These results speculated that coumarin 6 may be released from DFPs, in other words, the cargo was separated from the carrier. Accordingly, cargo and carrier presented different behaviors within cells. The images shown in Figure 5B reveal that the fluorescence intensity increased gradually with time at the initial phase. At 120 min, the intensity of green fluorescence and red fluorescence reached a maximum, indicating that DFPs internalization reached saturation.
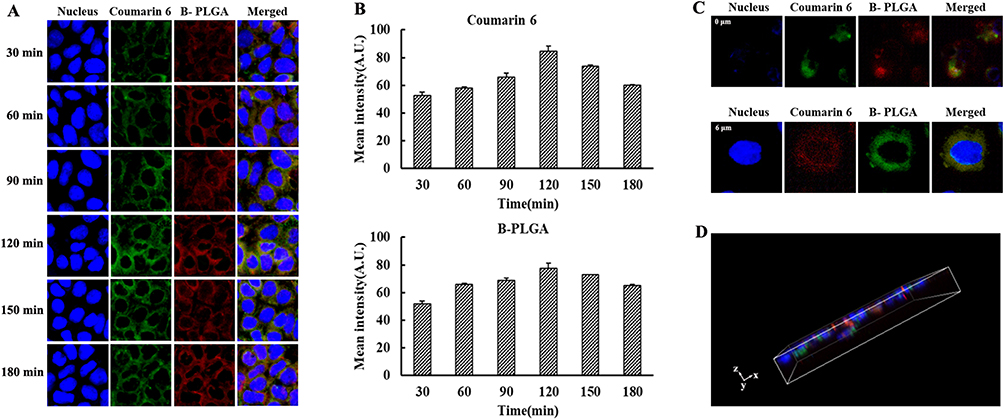 |
Figure 5 Multi-channel fluorescence images of Caco-2 cell monolayer co-incubated with dual-fluorescent nanoparticles (DFPs). (A) Represents fluorescence images incubation with DFPs over time. (B) Represents the corresponding quantitative analysis of A. (C) Represents fluorescence images of 0 μm at the top and 6 μm at the middle along the longitudinal direction of the cell monolayer. (D) Represents three-dimensional distribution of intracellular DFPs. |
To obtain more spatial information, vertical and three-dimensional views of the intracellular distribution of DFPs were obtained (Figure 5C and Figure 5). The monolayer of Caco-2 cells was scanned by X-Y-Z tomography from 0 μm at the top of the cell monolayer to 6 μm in the middle of the cell monolayer. In the cross-section image of the top of the cell monolayer, the cargo’s green fluorescence (coumarin 6) and the carrier’s red fluorescence (B-PLGA) of DFPs, as well as their overlapping fluorescence, could be seen clearly (Figure 5C). In the next image, a cross-section in the middle of the cell monolayer (6 μm in the vertical direction), a representative image of a single cell was captured. It was clearly visible that the double fluorescence of the cargo and carrier of DFPs overlapped completely in the cytoplasm surrounding the blue-stained nucleus. In the 3D image of Figure 5D, a stereoscopic distribution of DFPs in the cell monolayer is presented. The spatial distribution of the fluorescence for the stained nucleus and the double fluorescence of DFPs can be seen and was consistent with the cross-section results of the intracellular distribution mentioned above.
Quantitative Transport of DFPs in Caco-2 Cells
An important feature of DFPs is that they can simultaneously determine the amount of cargo and carrier. The transport behavior of DFPs in Caco-2 cells was analyzed quantitatively. Residual, intracellular and transport amounts of DFPs, depicted together by the amounts of coumarin 6 and B-PLGA, were normalized according to total protein in cells (Figure 6A). The residual amounts of coumarin 6 and B-PLGA decreased with the incubation duration of DFPs with cells. Moreover, these amounts decreased rapidly in the first 30 min, and then showed a slow downward trend. DFPs were taken up by Caco-2 cells from the top of the cell and then discharged from the basal end of the cell, which was a dynamic process. The intracellular amounts of coumarin 6 and B-PLGA showed an increasing trend over time. The transport amounts of coumarin 6 and B-PLGA increased gradually over time, but their growth rate was not synchronous. The growth rate of coumarin 6 was relatively slow, and its transport amount increased from 0.24 μg/mg pro to 0.74 μg/mg pro within 120 min. Meanwhile, the amount of B-PLGA increased from 12.35 μg/mg pro to 74.20 μg/mg pro during the same period. It was found that intracellular amount of coumarin 6 was significantly higher than its transport amount at all time tested and was 5.8- to 13.0-times higher than its transport amount. However, the transport amount of B-PLGA exceeded its intracellular amount in 90–120 min. To elucidate this phenomenon, the material balance of DFPs transport process in Caco-2 cells and the coumarin 6 release from intracellular DFPs were investigated.
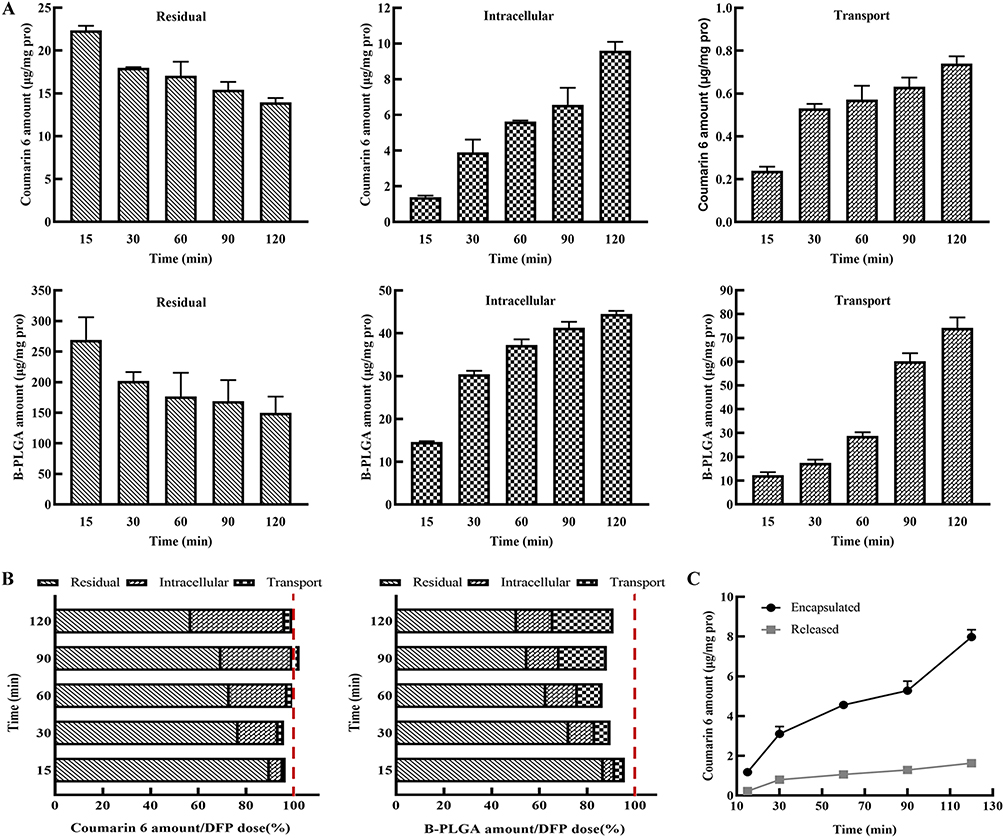 |
Figure 6 Quantification of the transport process of DFPs across Caco-2 cell monolayer. (A) Residual, intracellular, and transport amounts of DFPs depicted together by coumarin 6 and B-PLGA. (B) Material balance of carrier and cargo during cell transport of DFPs. (C) The amount of coumarin 6 released from DFPs and encapsulated in DFPs over time. The data represent mean± standard deviation (S.D.)of three independently performed experiments. |
To ensure sample parallelism in the transport experiment, the same dose of DFPs was administered to cells in each insert. Standardized with total protein, the DFPs dose per milligram of protein fluctuated slightly, but not significantly so. The values for relative standard deviation of coumarin 6 and B-PLGA were within 5% for parallel inserts at each time interval. For inter-groups at different times, the mean dose was 23.39±1.21 μg/mg pro for coumarin 6 and 291.81±12.65 μg/mg pro for B-PLGA. The inter-group variation of coumarin 6 and B-PLGA was 5.2% and 4.3%, respectively. The ratios of the residual amount, intracellular amount, and transport amount to the DFPs dose were calculated separately and plotted in Figure 6B. The sum of these three ratios ranged from 96.0% to 102.4% for coumarin 6 and from 86.5% to 95.7% for B-PLGA at different times. These data indicated that the dose of coumarin 6 administered and the sum of the measured amount at the three outlets during transportation were nearly equal, and this was also true for B-PLGA. These results indicate that the transport process of DFPs in Caco-2 cells was close to material balance.
Studies on DFPs characteristics showed that coumarin 6 encapsulated in DFPs could not be detected directly by fluorescence spectrophotometry if the nanoparticles remained intact. The coumarin 6 that can be detected in the methanol solution of cell lysates should be the released coumarin 6 from the DFPs. When DFPs in cell lysates were destroyed by dichloromethane and then dissolved by methanol, the total amount of intracellular coumarin 6 (released from and encapsulated in nanoparticles) could be measured. Hence, the difference in value between the total amount and released amount of coumarin 6 was the amount of coumarin 6 encapsulated in intracellular DFPs (Figure 6C). It was observed that the amount of coumarin 6 release increased as the number of DFPs entering and remaining in cells increased. Coumarin 6 is a lipophilic, small-molecule compound, which has been reported to be prone to intracellular or membrane retention.26,27 This feature was consistent with the result that the intracellular amount of coumarin 6 was significantly higher than the transport amount in this study. B-PLGA is a macromolecular, amphiphilic compound that can undergo exocytosis more readily than coumarin 6.28 Therefore, its transport amount was gradually higher than its intracellular amount. In conclusion, under the premise of material balance, the intracellular amount and transport amount of coumarin 6 showed different trends from those of B-PLGA, which might be related to their physicochemical properties. By virtue of the dual-indicator characterization of DFPs, we learned that the cellular-transport behavior of coumarin 6 was different from that of B-PLGA and DFPs when it is released from nanoparticles.
Conclusion
In this work, a fluorescently labeled polymer was synthesized and used as a carrier material to construct DFPs. The labeled polymer was stable and quantifiable according to its fluorescence intensity. The customized nanoparticles were acceptable for cell viability, structural integrity, and microscopic morphology upon incubation with Caco-2 cells at concentrations below 0.7 mg/mL for up to 3 h. Importantly, DFPs can be used to visualize the cellular internalization process of holistic nanoparticle, not only cargo but also carrier, which is based on the technique of dual fluorescent labeling. The time course and the quantification data of cargo and carrier were presented during cell internalization. A material balance is obtained in which the sum of the residual amount, intracellular amount, and transport amount was close to the DFPs dose administered. Therefore, our work provides a deeper understanding of transcellular transport of holistic nanoparticles, which will help to facilitate a comprehensive characterization of the behavior of nano-DDS and guide the design and application of nano-DDS.
Data Sharing Statement
The data that support the findings of this study are available from the corresponding author, Wen Lu, upon reasonable request.
Funding
This work was supported by the National Natural Science Foundation of China [grant numbers: 82173775, 81673397]; the Opening Research Fund from Key Laboratory of Shaanxi Province for Craniofacial Precision Medicine Research, College of Stomatology, Xi’an Jiaotong University [grant numbers: 2022LHM-KFKT003]; and the Natural Science Basic Research Plan in Shaanxi Province of China [grant numbers: 2020JM-023].
Disclosure
Dr Wen Lu reports a patent A preparation method for double emission fluorescence nanoparticles licensed to Wen Lu. The authors report no conflicts of interest in this work.
References
1. Barenholz Y. Doxil® -The first FDA-approved nano-drug: lessons learned. J Control Release. 2012;160:117–134. doi:10.1016/j.jconrel.2012.03.020
2. Li K, Liu CJ, Zhang XZ. Multifunctional peptides for tumor therapy. Adv Drug Delivery Rev. 2020;160:36–51. doi:10.1016/j.addr.2020.10.009
3. Guo X, Wei X, Chen Z, et al. Multifunctional nanoplatforms for subcellular delivery of drugs in cancer therapy. Prog Mater Sci. 2020;107:100599. doi:10.1016/j.pmatsci.2019.100599
4. Ma ZY, Foda FM, Zhao YL, et al. Multifunctional nanosystems with enhanced cellular uptake for tumor therapy. Adv Healthc Mater. 2022;11:2101703. doi:10.1002/adhm.202101703
5. Gao X, Li L, Cai XP, et al. Targeting nanoparticles for diagnosis and therapy of bone tumors: opportunities and challenges. Biomaterials. 2021;265:120404. doi:10.1016/j.biomaterials.2020.120404
6. Miao YB, Lin YJ, Chen KH, et al. Engineering nano- and microparticles as oral delivery vehicles to promote intestinal lymphatic drug transport. Adv Mater. 2021;33(51):2104139. doi:10.1002/adma.202104139
7. Wang Y, Zhang ZZ, Zheng CX, et al. Multistage adaptive nanoparticle overcomes biological Barriers for effective chemotherapy. Small. 2021;17(31):2100578. doi:10.1002/smll.202100578
8. Pires PC, Fazendeiro AC, Rodrigues M, et al. Nose-to-brain delivery of phenytoin and its hydrophilic prodrug fosphenytoin combined in a microemulsion-formulation development and in vivo pharmacokinetics. Eur J Pharm Sci. 2021;164:105918. doi:10.1016/j.ejps.2021.105918
9. Hussain T, Paranthaman S, Mohd Danish Rizvi S, et al. Fabrication and characterization of paclitaxel and resveratrol loaded soluplus polymeric nanoparticles for improved BBB penetration for glioma management. Polymers. 2021;13(19):3210. doi:10.3390/polym13193210
10. Khezri FA, Lakshmi CSR, Rama B, et al. Pharmacokinetic study and brain tissue analysis of Zolmitriptan loaded chitosan nanoparticles in rats by LC-MS method. Int J Biol Macromol. 2020;142:52–62. doi:10.1016/j.ijbiomac.2019.08.236
11. Mahlert L, Anderski J, Mulac D, et al. The impact of gastrointestinal mucus on nanoparticle penetration – in vitro evaluation of mucus-penetrating nanoparticles for photodynamic therapy. Eur J Pharm Sci. 2019;133:28–39. doi:10.1016/j.ejps.2019.03.010
12. Keum T, Noh G, Seo JE, et al. Examination of effective buccal absorption of salmon calcitonin using cell-penetrating peptide-conjugated liposomal drug delivery system. Int J Nanomed. 2022;17:697–710. doi:10.2147/IJN.S335774
13. Rocha CV, Goncalves V, da Silva MC, et al. PLGA-based composites for various biomedical applications. Int J Mol Sci. 2022;23(4):2034. doi:10.3390/ijms23042034
14. Dou TY, Wang J, Han CK, et al. Cellular uptake and transport characteristics of chitosan modified nanoparticles in Caco-2 cell monolayers. Int J Biol Macromol. 2019;138:791–799. doi:10.1016/j.ijbiomac.2019.07.168
15. Li K, Pi C, Wen J, et al. Formulation of the novel structure curcumin derivative–loaded solid lipid nanoparticles: synthesis, optimization, characterization and anti-tumor activity screening in vitro. Drug Deliv. 2022;29(1):2044–2057. doi:10.1080/10717544.2022.2092235
16. Bahjat HH, Ismail RA, Sulaiman GM, et al. Magnetic field‑assisted laser ablation of titanium dioxide nanoparticles in water for anti‑bacterial applications. J Inorg Organomet P. 2021;31:3649–3656. doi:10.1007/s10904-021-01973-8
17. Teo WZ, Chng EL, Sofer Z, et al. Cytotoxicity of halogenated graphenes. Nanoscale. 2014;6:1173. doi:10.1039/C3NR05275C
18. Battula H, Bommi S, Bobde Y, et al. Distinct rhodamine B derivatives exhibiting dual effect of anticancer activity and fluorescence property. J Photoch Photobio. 2021;6:100026. doi:10.1016/j.jpap.2021.100026
19. Park K, Otte A, Sharifi F, et al. Potential roles of the glass transition temperature of PLGA microparticles in drug release kinetics. Mol Pharmaceut. 2021;18(1):18–32. doi:10.1021/acs.molpharmaceut.0c01089
20. Eleraky NE, Swarnakar NK, Mohamed DF, et al. Permeation-enhancing nanoparticle formulation to enable oral absorption of enoxaparin. AAPS Pharm Sci Tech. 2020;21(3):88. doi:10.1208/s12249-020-1618-2
21. Chaea B, HoSon S, Kwak YJ, et al. Two-dimensional (2D) infrared correlation study of the structural characterization of a surface immobilized polypeptide film stimulated by pH. J Mol Struct. 2016;1124(15):192–196. doi:10.1016/j.molstruc.2016.02.008
22. Finke JH, Richter C, Gothsch T, et al. Coumarin 6 as a fluorescent model drug: how to identify properties of lipid colloidal drug delivery systems via fluorescence spectroscopy? Eur J Lipid Sci Technol. 2014;116:1234–1246. doi:10.1002/ejlt.201300413
23. Enea M, Pereira E, Costa J, et al. Cellular uptake and toxicity of gold nanoparticles on two distinct hepatic cell models. Toxicol in Vitro. 2021;70:105046. doi:10.1016/j.tiv.2020.105046
24. Felix K, Tobias S, Jan H, et al. Measurements of transepithelial electrical resistance (TEER) are affected by junctional length in immature epithelial monolayers. Histochem Cell Biol. 2021;156:609–616. doi:10.1007/s00418-021-02026-4
25. Pires CL, Praça C, Martins PA, et al. Re-Use of Caco-2 Monolayers in permeability assays-validation regarding cell monolayer integrity. Pharmaceutics. 2021;13:1563. doi:10.3390/pharmaceutics13101563
26. Lee Y, Choi SQ. Quantitative analysis for lipophilic drug transport through a model lipid membrane with membrane retention. Eur J Pharm Sci. 2019;134:176–184. doi:10.1016/j.ejps.2019.04.020
27. Ghaemi Z, Alberga D, Carloni P, et al. Permeability coefficients of lipophilic compounds estimated by computer simulations. J Chem Theory Comput. 2016;12(8):4093–4099. doi:10.1021/acs.jctc.5b01126
28. Baidya G, Tiwary R, Mudassir M, et al. Passive internalization and active extrusion determines PLGA-nanoparticle concentration in cancer cell lines. Nanomedicine. 2020;15(23):2229–2240. doi:10.2217/nnm-2020-0229
 © 2023 The Author(s). This work is published and licensed by Dove Medical Press Limited. The
full terms of this license are available at https://www.dovepress.com/terms
and incorporate the Creative Commons Attribution
- Non Commercial (unported, 3.0) License.
By accessing the work you hereby accept the Terms. Non-commercial uses of the work are permitted
without any further permission from Dove Medical Press Limited, provided the work is properly
attributed. For permission for commercial use of this work, please see paragraphs 4.2 and 5 of our Terms.
© 2023 The Author(s). This work is published and licensed by Dove Medical Press Limited. The
full terms of this license are available at https://www.dovepress.com/terms
and incorporate the Creative Commons Attribution
- Non Commercial (unported, 3.0) License.
By accessing the work you hereby accept the Terms. Non-commercial uses of the work are permitted
without any further permission from Dove Medical Press Limited, provided the work is properly
attributed. For permission for commercial use of this work, please see paragraphs 4.2 and 5 of our Terms.