Back to Journals » Cancer Management and Research » Volume 13
CT-Based Radiomics Nomogram for Prediction of Progression-Free Survival in Locoregionally Advanced Nasopharyngeal Carcinoma
Authors Yan C ![]() , Shen DS, Chen XB, SU DK
, Shen DS, Chen XB, SU DK ![]() , Liang ZG, Chen KH, Li L, Liang X, Liao H
, Liang ZG, Chen KH, Li L, Liang X, Liao H ![]() , Zhu XD
, Zhu XD ![]()
Received 21 June 2021
Accepted for publication 21 August 2021
Published 3 September 2021 Volume 2021:13 Pages 6911—6923
DOI https://doi.org/10.2147/CMAR.S325373
Checked for plagiarism Yes
Review by Single anonymous peer review
Peer reviewer comments 2
Editor who approved publication: Dr Sanjeev K. Srivastava
Chang Yan,1 De-Song Shen,1 Xiao-Bo Chen,2 Dan-Ke SU,3 Zhong-Guo Liang,1 Kai-Hua Chen,1 Ling Li,1 Xia Liang,1 Hai Liao,3 Xiao-Dong Zhu1,4
1Department of Radiation Oncology, Guangxi Medical University Cancer Hospital, Nanning, Guangxi, 530021, People’s Republic of China; 2School of First Clinical Medicine, Zhejiang Chinese Medical University, Hangzhou, 310053, People’s Republic of China; 3Department of Radiology, Guangxi Medical University Cancer Hospital, Nanning, Guangxi, 530021, People’s Republic of China; 4Affiliated Wuming Hospital of Guangxi Medical University, Nanning, Guangxi, 530100, People’s Republic of China
Correspondence: Xiao-Dong Zhu
Department of Radiation Oncology, Guangxi Medical University Cancer Hospital, 71 Hedi Road, Nanning City, Guangxi, 530021, People’s Republic of China
Tel +86 771 533 1466
Email [email protected]
Hai Liao
Department of Radiology, Guangxi Medical University Cancer Hospital, Nanning, Guangxi, 530021, People’s Republic of China
Tel +86 771 533 4950
Email [email protected]
Purpose: We aimed to construct of a nomogram to predict progression-free survival (PFS) in locoregionally advanced nasopharyngeal carcinoma (LA-NPC) with risk stratification using computed tomography (CT) radiomics features and clinical factors.
Patients and Methods: A total of 311 patients diagnosed with LA-NPC (stage III–IVa) at our hospital between 2010 and 2014 were included. The region of interest (ROI) of the primary nasopharyngeal mass was manually outlined. Independent sample t-test and LASSO-logistic regression were used for selecting the most predictive radiomics features of PFS, and to generate a radiomics signature. A nomogram was built with clinical factors and radiomics features, and the risk stratification model was tested accordingly.
Results: In total, 20 radiomics features most associated with prognosis were selected. The radiomics nomogram, which integrated the radiomics signature and significant clinical factors, showed excellent performance in predicting PFS, with C-index of 0.873 (95% CI: 0.803∼ 0.943), which was better than that of the clinical nomogram (C-index, 0.729, 95% CI: 0.620∼ 0.838) as well as of the TNM staging system (C-index, 0.689, 95% CI: 0.592– 0.787) in validation cohort. The calibration curves and the decision curve analysis (DCA) plot obtained suggested satisfying accuracy and clinical utility of the model. The risk stratification tool was able to predict differences in prognosis of patients in different risk categories (p< 0.001).
Conclusion: CT-based radiomics features, an in particular, radiomics nomograms, have the potential to become an accurate and reliable tool for assisting with prognosis prediction of LA-NPC.
Keywords: computed tomography, locoregionally advanced nasopharyngeal carcinoma, radiomics, nomogram
Introduction
Nasopharyngeal carcinoma (NPC) is one of the most prevalent head and neck malignant tumors in China, with a characteristic geographical distribution: the highest incidence is found in southern China.1 Due to its intrinsic biological characteristics and anatomical features, early disease symptoms and signs are not obvious, and many patients already present locally advanced stage when they are first diagnosed.2 Given that intensity-modulated radiotherapy (IMRT) is widely used in recent years, the local control of NPC has improved significantly, but patients with advanced disease still tend to experience local recurrence and distant metastasis.3 Combination of chemotherapy with radiotherapy can enhance the efficacy of radiotherapy alone in eliminating micrometastases, and improve the prognosis of locoregionally advanced nasopharyngeal carcinoma LA-NPC.4 Nevertheless, such combination strategy can also increase the radiotherapy and chemotherapy related side effects and add to the economic burden of health care. The TNM staging system (AJCC 8th edition) provide important information to help clinicians improve NPC clinical care and diagnosis. However, patients with similar TNM staging often have different prognosis and experience different course of the disease. The reason for this may be related to intrinsic biological variability and tumor heterogeneity in different patients. Therefore, how to personalize treatment regimens to minimize the toxic side effects of aggressive therapies while obtaining a promising prognosis remains a clinical challenge. A reliable prognostic model can assist clinicians with their predictions of a patient’s prognosis and help them make more informed therapeutic decisions.
Radiomics has become a popular research topic in recent years, especially in the research of solid tumors, with great potential given the current rapid development of artificial intelligence (AI). Radiomics aims to extract quantitative features from diagnostic images to make predictions about disease diagnosis, prognosis, and treatment response. These radiomics features include information which can be challenging for the human eye to recognize and evaluate.5 In the field of NPC research, several studies suggested that MRI-based imaging tags is a reliable method for assessing treatment response and unraveling prognostic markers.6–8 A retrospective study analyzing patients with LA-NPC from 2009 to 2014 confirmed that radiomics based on PET/CT can be valuable tools in the clinical decision process of LA-NPC.9
CT is another important imaging examination technology in the diagnosis and staging of NPC. A study that compared radiomics tools for image analyses and clinical prediction in NPC, found that the CT-based radiomics features are more stable and reproducible than MRI-based radiomics features.10 Another study in China found that CT-based radiomics can discriminate the subtle differences between NPC tumors and normal tissues in multi-phase CT images and objectively reflect their dynamic changes, assisting with the accurate diagnosis and quantitative analysis of NPC.11 However, few studies on CT-based radiomics have been conducted with the aim to predict the prognosis of NPC. Our study aims to investigate the value of CT-based radiomics in the prognosis prediction of locoregionally advanced nasopharyngeal carcinoma (LA-NPC) by constructing a prognostic prediction model. To our knowledge, our study is the first to use enhanced CT imaging radiomics in combination with clinical factors to generate a nomogram to predict progression-free survival (PFS) in LA-NPC.
Patients and Methods
Patients
This retrospective study was approved by our Institutional Review Board and was waived the need to sign an informed consent form. A total of 311 patients diagnosed with stage III–IVa NPC in our hospital were included. The inclusion criteria were: (1) Patients with initial diagnosis of NPC confirmed by pathology in our hospital from 2010–2014. (2) Patients who received IMRT with the following treatment modes: Induction chemotherapy (IC)+ Concurrent Chemoradiotherapy (CCRT), CCRT, and CCRT+ Adjuvant chemotherapy (AC). (3) Patients diagnosed with stage III–IVa tumors restaged according to the 8th Edition of American Joint Committee on Cancer (AJCC). (4) Patients in generally good condition (KPS ≥ 70), without serious medical or surgical diseases, and no other malignant tumors. (5) Patients with available complete initial medical history, pre-treatment CT and MRI, nasopharyngoscopy, and three major routines.
Treatment
All patients received complete IMRT treatment. The target dose prescription was GTVnx 70.06~74.58Gy (30~33f), GTVnd 60~73.6Gy (30~32f), CTV1 60~64Gy (30~32f), CTV2 54~57.6G (30~32f). With regards to the chemotherapy regimen, the induction regimen used was TP (docetaxel 75 mg/m2, d1; cisplatin 75 mg/m2, d1), PF (cisplatin 80 mg/m2, d1~3, 5-fluorouracil 750 mg/m2, continuous Intravenous drip 120h), TPF (docetaxel 60 mg/m2, d1; cisplatin 60 mg/m2, d1; 5-fluorouracil 600 mg/m2, continuous intravenous drip 120h), once every 3 weeks, total 1~4 cycles; concurrent chemotherapy used cisplatin (100 mg/m2, d1-3) once every 3 weeks for a total of 1 to 3 cycles; adjuvant chemotherapy used TPF, TP or PF regimens, once every 3 weeks, total 1~4 cycles.
Follow-Up and Clinical Endpoint
Patients were followed up by outpatient, telephone and inpatient review. Follow-up was scheduled every 3 months for the first 2 years after treatment, every 6 months for the third to fifth years, and annually thereafter. Progression-free survival (PFS) was selected as the endpoint event. This is because patients with NPC usually have a long survival period and it is important to avoid the risk of having too few endpoint events and to reduce the follow-up time. PFS is the time from the start of treatment to the onset of any aspect of disease progression or death by any cause. Recurrent and metastatic cases were diagnosed by nasopharyngoscopy, biopsy, imaging, and physical examination.
CT Acquisition and Segmentation
Enhanced CT was performed in all patients. A large-aperture spiral CT scanner (Light SpeedRT, GE) was used for axial scanning. The scanning range was from the cranial vault to the subclavian plane. The CT scanning parameters were: tube voltage 140 kV; tube current 380 mA; image resolution 512*512; and layer thickness 2.5 mm. 70mL of iodixanol was injected into the vein at a rate of 2.0 mL/s. Patients were scanned and the images were saved after 50 seconds. The CT scan images were then transferred to the MIM planning system (MIM Software Inc.) in DICOM format. Images with substantial CT artifacts were excluded to avoid confounding on subsequent feature extraction and analysis. ROI was manually outlined layer by layer on post-contrast CT images by an experienced radiologist using the MIM planning system, and confirmed by a senior radiologist. Another radiologist outlined the ROI of 50 randomly selected patients for subsequent calculation of the interclass correlation coefficient (ICC). The outline principles were described in the International Commission on the International Commission on Radiation Units (ICRU) and Measurements Reports 50 and 62. The lesion area was confirmed using MRI in order to match the lesion margins as closely as possible.
Radiomics Feature Extraction and Radiomics Signature Building
Radiomics features were extracted using the AI radiotherapy imaging workstation AccuContour business software (version 3.0.4, CHN). In total, 1409 features were extracted from the original post-contrast CT images and after filter conversion. These feature categories include: (1) Shape features, which are used to describe the geometric properties of the ROI, including size features describing the volume and surface area of the ROI, and features describing the similarity between the sphere and ROI, such as spherical disproportion. (2) First-order features, which are features describing the intensity distribution of voxels within the ROI, calculated by histogram analysis, and include mean, median and other features. (3) Texture features, which describe the intensity levels of the voxel spatial distribution. These include gray level co-generation matrix (GLCM), gray level length run length matrix (GLRLM), gray level size zone matrix (GLSZM), neighborhood gray tone difference matrix (NGTDM) and gray level dependence matrix (GLDM).
Before feature selection, Z-score standardization was performed on all radiomics features. Subsequently, patients were randomly divided into training and validation cohorts in a 7:3 ratio. After filtering out features with ICC < 0.75, the independent samples t-test was used for initial feature selecting. The LASSO-logistic regression model was then performed to obtain the most predictive radiomics features in the training cohort. The radiomic signature (rad-score) was calculated by addition of the selected radiomic features that were weighted by their respective coefficients.
Construction and Validation of Nomogram and Risk Stratification Tool
Multivariate logistic regression was used for selecting independent predictive clinical factors in the training cohort. In order to provide a quantitative tool to predict PFS in LA-NPC, we incorporated some risk factors of PFS into three nomograms, which were constructed with TNM staging, clinical factors and rad-scores. The discrimination power of nomograms was evaluated by consistency index (C-index). Calibration curves were used to estimate the risk of progression (recurrence, metastasis or death) in patients predicted by the nomogram. The statistical difference between the C-index of different models was tested by the DeLong test. Sensitivity, specificity, and accuracy indexes were used to evaluate the model’s performance. Decision curves analysis (DCA) were used to assess the net benefit of a nomogram for clinical decision making at different threshold probabilities. A total nomogram score was calculated for each patient and to generate risk strata. Survival analysis of PFS was performed for patients in different risk strata.
Statistical Analysis
The radiomic features of the CT-enhanced images were extracted by the AccuContour business software (version 3.0.4, CHN). The Python software (version 3.7.1, US) package “SciPy” was used for univariate analysis; the chi-square test was used to clinical count factors, and the t-test or calibrated t-test were used to compare the differences between groups for the radiomics features. The “glmnet” package of R software (version 4.0.3, US) was used to perform LASSO-logistic regression to select predictive radiomics features. The “rms” package was used to construct nomograms and calibration curves. Patients were stratified by X-tile software (Rimm Lab, US) according to their nomogram total score, and the Kaplan-Meier method was used to analyze the PFS of the different risk groups. p<0.05 indicates statistically significant differences.
Results
Patient Characteristics and Follow-Up
Based on the inclusion criteria, 311 patients were included in this study, with 218 cases in the training cohort and 93 cases in the validation cohort. Baseline information of patients in both groups is shown in Table 1. There were no statistical differences in age, gender, smoking history, family history of NPC, T-stage, N-stage, clinical stage, treatment mode and progression rate between the training and validation cohorts (p>0.05). The median follow-up time for all patients was 78 months (range: 3–122 months). The 1-, 3-, 5- and 7-year PFS (%) were 95.2, 84.2, 76.2 and 70.9% respectively.
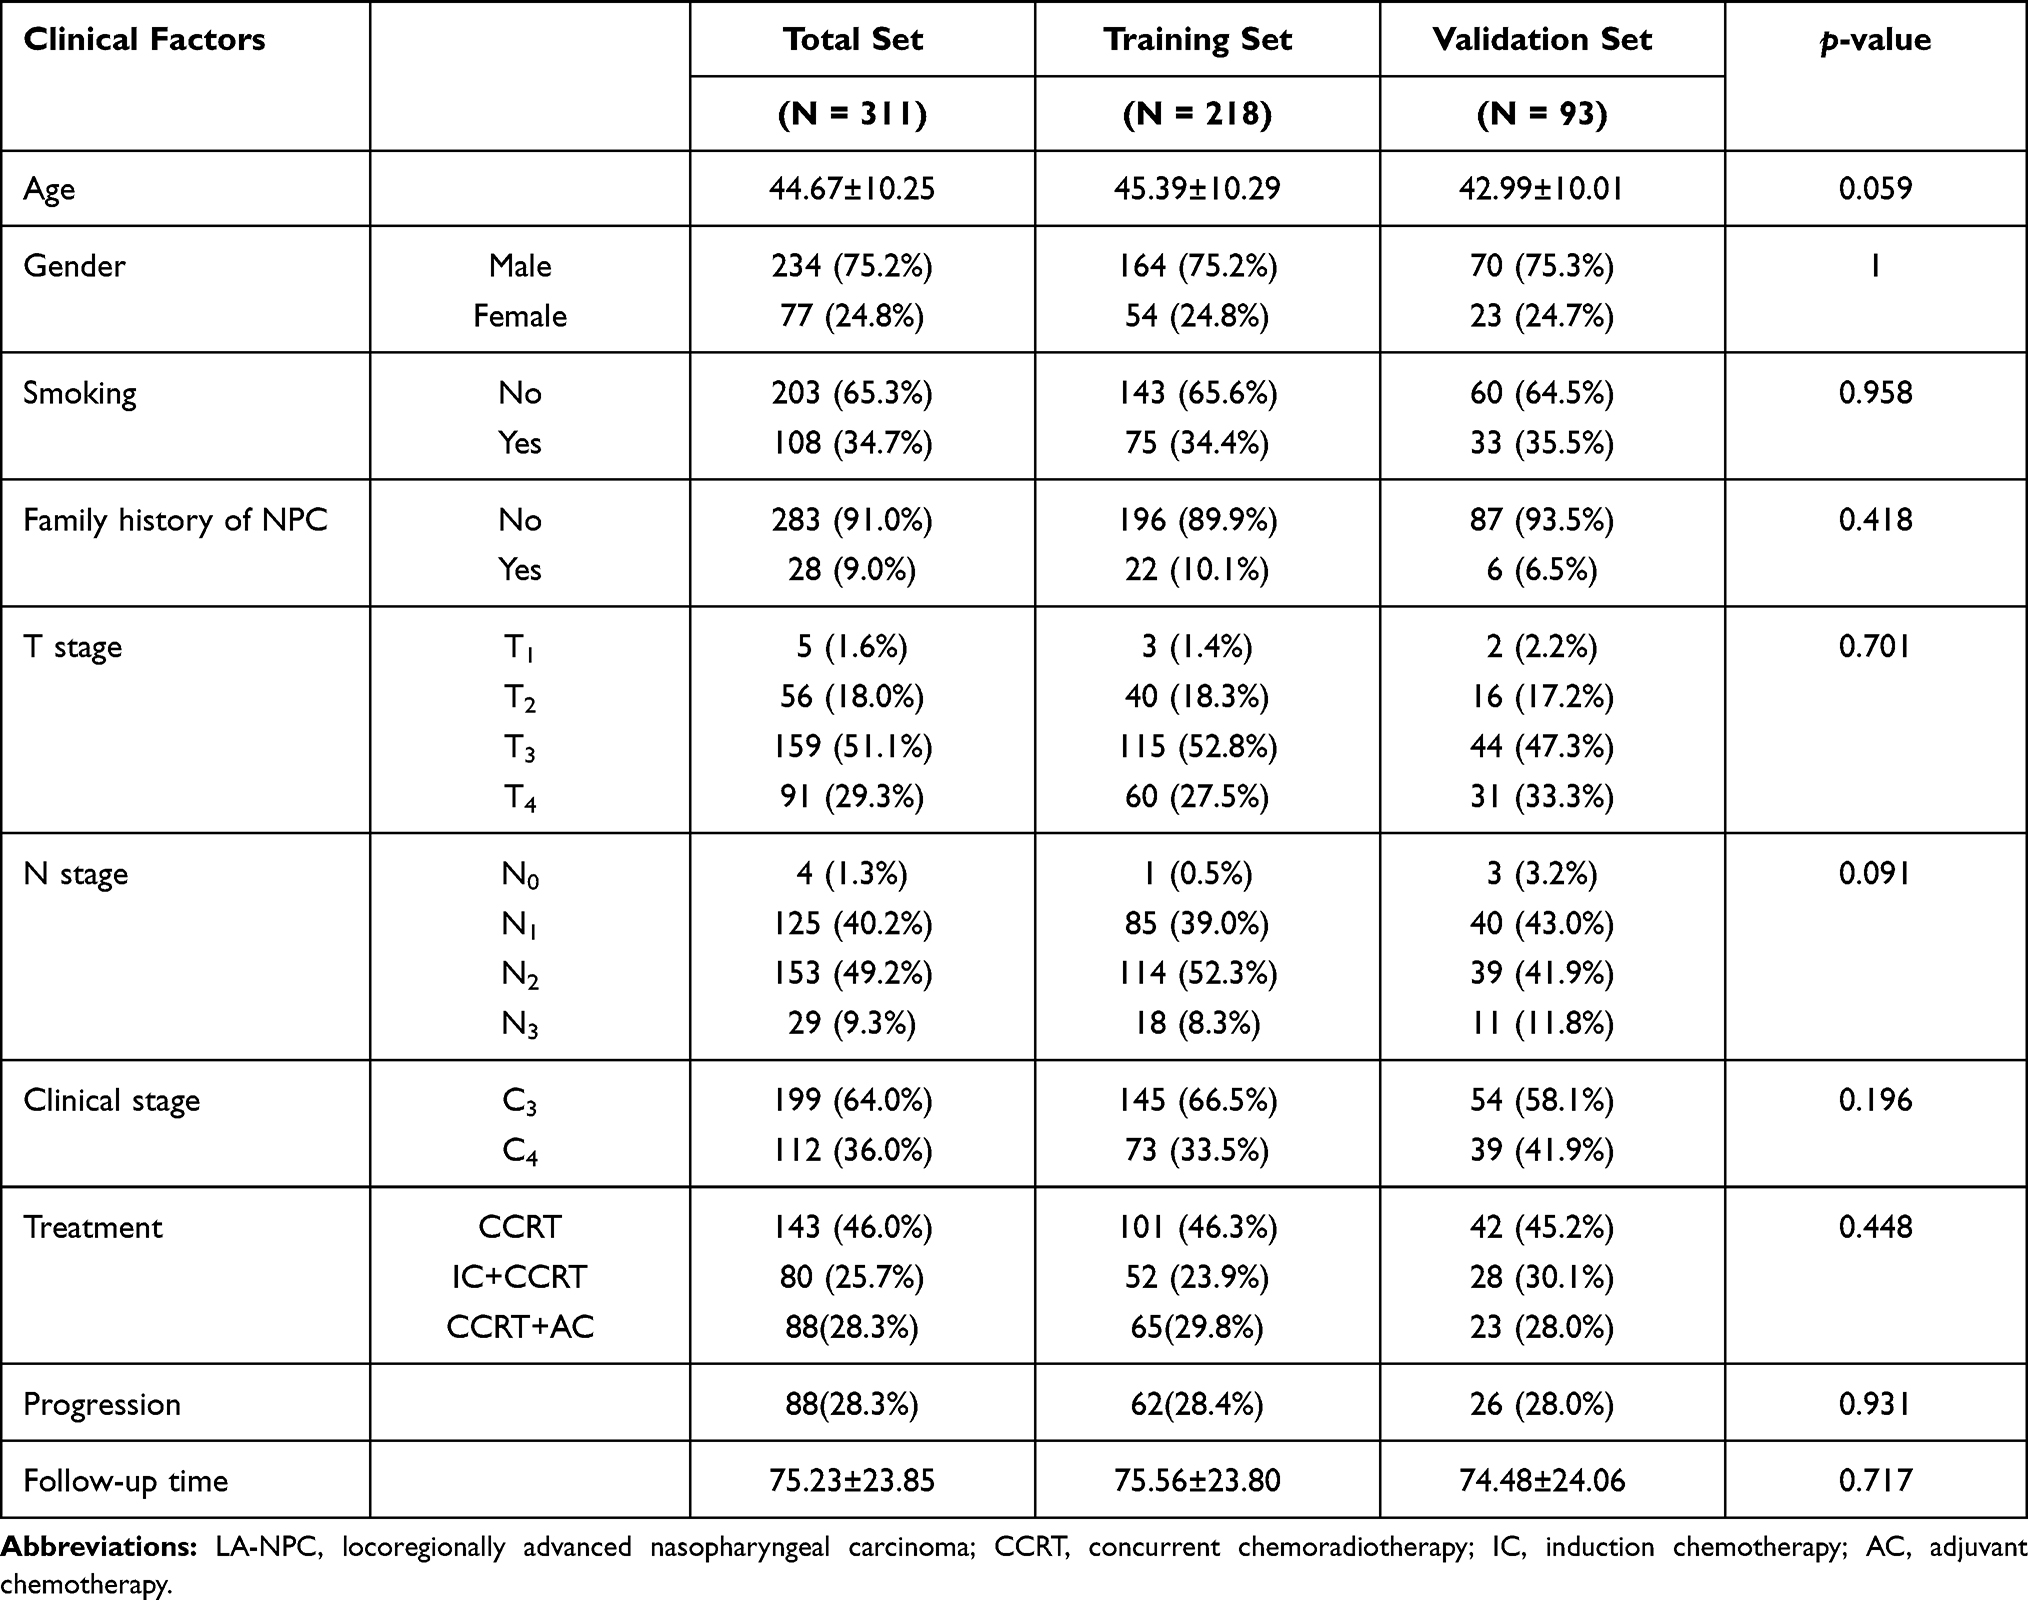 |
Table 1 Characteristics of Patients with LA-NPC in the Training and Validation Cohorts |
Construction and Validation of a Radiomics Signature
The radiomics workflow and modeling are shown in Figure 1. For each case, 1409 features were extracted, and 527 features associated with PFS were initially selected by ICC (>0.75) and independent sample t-test (p < 0.05). In the training set, the 20 most predictive features were selected by LASSO-logistic regression (Figure 2A and B). Selected features and their respective image category are shown in Table 2. Rad-scores were further calculated for each patient (Figure 2C and D). The receiver operating characteristic curves (ROC) of the rad-score are presented in Figure 4A and B. ROC curves resulted in an area under the curve (AUC) of 0.897 and 0.856 in the training and the validation cohorts, respectively, with accuracies of 0.775 and 0.763, sensitivities of 0.903 and 0.846, and specificities of 0.724 and 0.731, respectively (Table 3).
 |
Table 2 Coefficient Profiles, Category and Filters of the 20 Radiomics Features Selected by LASSO-Logistic |
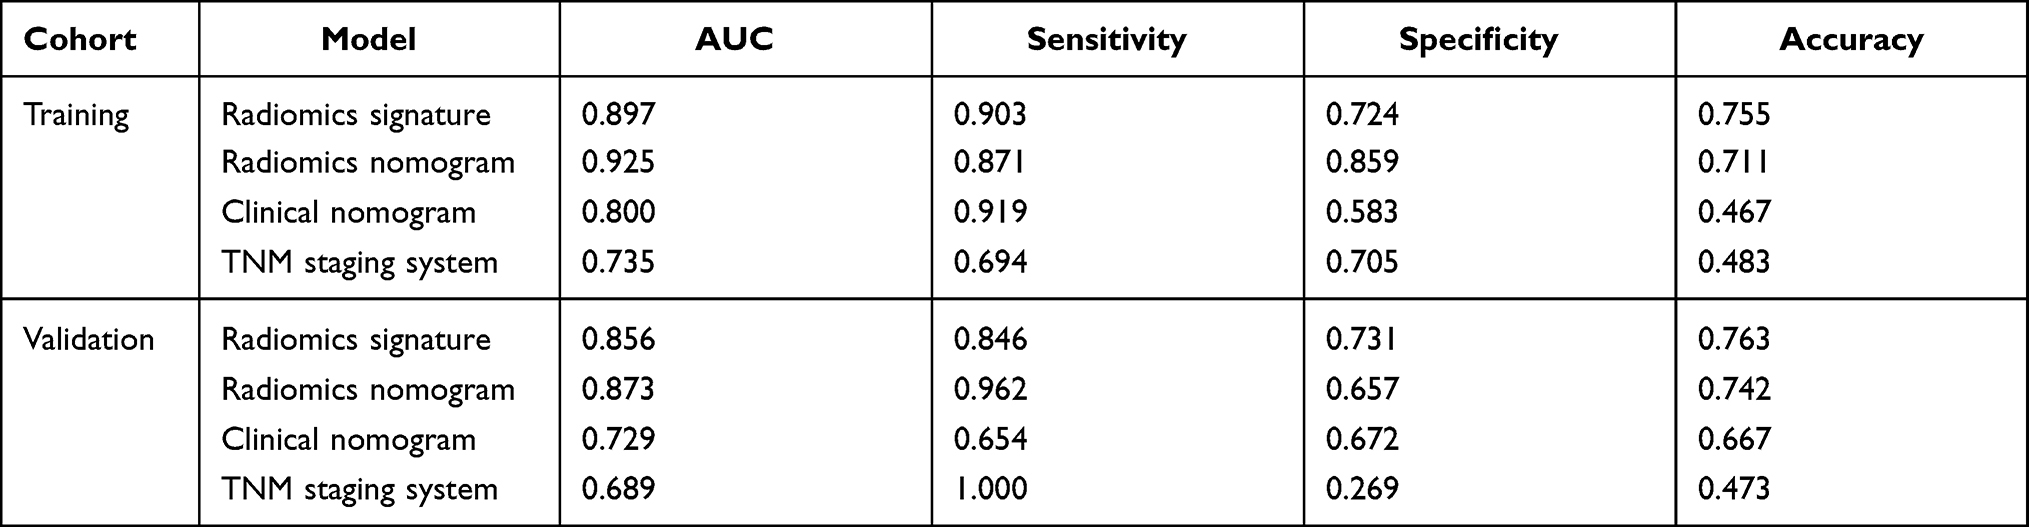 |
Table 3 Performance of Radiomics Nomogram, Clinical Nomogram and TNM Staging System |
 |
Figure 1 Framework of the study (A) Regions of interest (ROI). (B) Three types of features. (C) Feature selection by T-test and Lasso-logistic regression. (D) Establishment and validation of radiomics signature. (E) Establishment and validation of Nomogram. |
 |
Figure 2 LASSO-logistic regression analysis for selection of radiomics features and the distribution of radiomics signature (A) The tuning parameters (λ) in Lasso-Logistic regression were selected by 10-fold cross-validation. When log(λ) is equal to −3.87, the AUC reaches its maximum value. (B) LASSO coefficient profiles of 527 radiomics features. 20 features with non-zero coefficients are selected at the optimal λ. Rad-score distribution of (C) patients in the training cohort and (D) patients in the validation cohort. Red bars show scores for patients were progression-free; green bars show scores for patients who experienced tumor progression or death by any cause. |
Establishment and Validation of the Nomogram
We calculated the cut-off values for hemoglobin (Hb, 116.5g/L), albumin (ALB, 41.7g/L), alkaline phosphatase (ALP, 59.5U/L), lactate dehydrogenase (LDH, 181U/L), neutrophil-to-lymphocyte ratio (NLR, 2.51) and platelet-to-lymphocyte ratio (PLR, 151.58) based on the ROC curves. The cut-off values transformed continuous variables into binary variables. Multivariate logistic suggested that LDH, treatment mode, N stage and T stage were LA-NPC independent predictive factors (p<0.05), while age, gender, smoking history, family history, Hb, ALB, ALP, NLR and PLR were not (p>0.05). The radiomics nomogram was generated based on independent predictive clinical factors combined with rad-scores (Figure 3A). In addition, the clinic nomogram was only constructed by clinical factors (Figure 3B). TNM staging model was built based on the T stage and N stage (Figure 3C). The radiomics nomogram showed excellent performance in predicting PFS, with C-index of 0.925 (95% CI: 0.892~0.958) in the training cohort, and 0.873 (95% CI: 0.803~0.943) in the validation cohort. This performance was better than that of the clinical nomogram, with C-index of 0.800 (95% CI: 0.743~0.858) and 0.729 (95% CI: 0.620~0.838) for the training and validation cohorts, respectively. The radiomics nomogram also performed better than the TNM staging system in both the training cohort (C-index, 0.735, 95% CI: 0.674–0.796) and validation cohort (C-index, 0.689, 95% CI: 0.592–0.787). The DeLong test was used to confirm the statistically significance difference between the C-index of the radiomics nomogram and the other two models (p<0.05). Figure 4A and B showed the ROC curves of the three models in the two cohorts. The results of the models’ performances are shown in Table 3. The calibration curve suggested that the accuracy of radiomic nomogram was satisfactory (Figure 4C and D), and the net benefit rate was higher than clinical nomogram and TNM staging as shown in DCA (Figure 4E and F).
 |
Figure 3 Establishment of Nomograms. (A) Radiomics nomogram, (B) Clinical nomogram and (C)TNM staging model. |
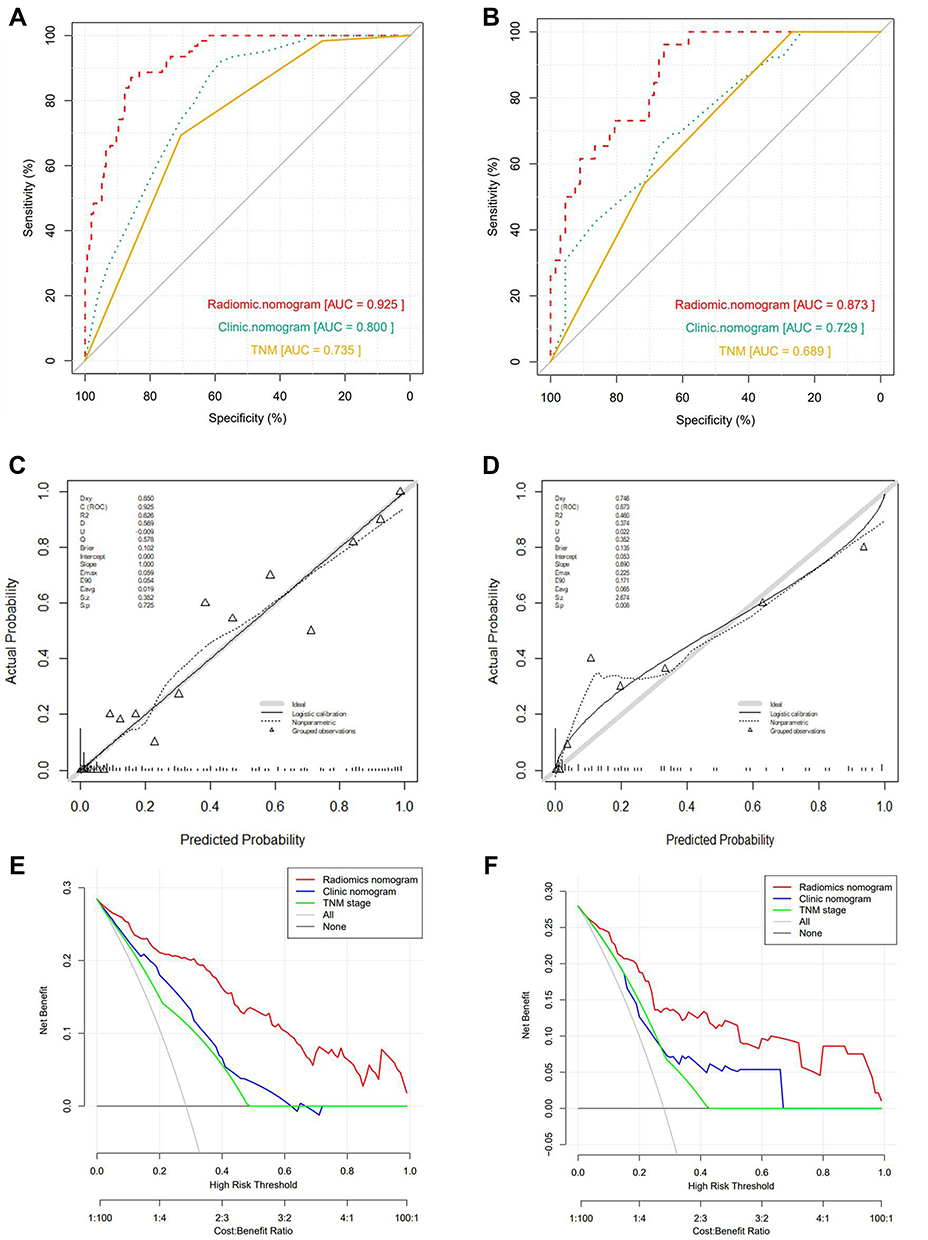 |
Figure 4 Validation of Nomograms. The ROC curves of three models for (A) The training cohort and (B) the validation cohort. The Calibration curves of radiomics nomogram for (C) the training cohort and (D) the validation cohort. The Calibration curves are close to the standard curves, suggesting that the model has high accuracy in both cohorts. Decision curve analysis (DCA) for the radiomics nomogram and clinical nomogram of (E) the training cohort and (F) the validation cohort. The DCA indicates that radiomics nomogram provide more net benefit than the clinical nomogram and TNM staging model with threshold probability in both cohorts. |
Risk Stratification Model and Survival Analysis
We calculated the best cut-off values of radiomics nomogram total scores 34.7 and 48.1 through the X-tile software, and divided the patients into low-risk (<34.7), middle-risk (≥34.7 and <48.1) and high-risk (≥48.1) groups. The Kaplan-Meier method was used to plot the survival curves for PFS. The survival curves of the total population, and the training and validation cohorts indicated a statistically significant difference in survival between the different risk groups (p<0.001). Similarly, the prognosis was better in the low-risk group and worse in the high-risk group (Figure 5). The 1-, 3-, 5- and 7-year PFS were 99.4, 98.1, 96.8 and 96.8% in the low-risk group, 92.6, 73.6, 62.0 and 56.4% in the medium-risk group, and 85.3, 58.8, 32.4 and 17.6% in the high-risk group respectively.
 |
Figure 5 Kaplan–Meier analysis for (A) All patients, (B) Training cohort and (C) Validation cohort. |
Discussion
Imaging is a clinically important examination tool that is often used to assist in the diagnosis, staging and treatment decisions of tumors. Currently, clinical practice in oncology relies mostly on the visual evaluation of images by clinicians, which can be subjective and yield limited information. With the increased digitization of clinical information and the popularization of AI research, radiomics has recently become a hot topic of research.12 Solid tumors are often spatially and temporally heterogeneous, and radiomics can non-invasively capture such heterogeneity and translate it in terms of pixel density and spatial distribution, which can be correlated to tumor aggressiveness, pathological grading, post-treatment response, and prognosis.13–15 Recent developments in the treatment of NPC, such as IMRT methods, have improved local tumor control. At the same time, reducing LA-NPC recurrence and metastasis, and mortality have become important aims of clinical research in this field of oncology, as in others.16 Reliable and accurate predictive factors and prognostic models can help guide clinical decisions for the clinical benefit of patients. Against this backdrop, we screened 20 radiomics features from LA-NPC primary lesions based on CT-enhanced images, and successfully constructed a nomogram and established a risk stratification model by combination of clinical factors.
Prior studies on tumor prognosis have confirmed the potential of CT-based radiomics as a reliable biomarker for predicting prognosis.17–20 In head and neck cancer research, a study showed an association between the radiomics signature of CT images with survival and control after radiotherapy for locoregionally advanced head and neck cancer.21 Similarly, Chen et al found that CT-based imaging histological signatures and nomogram showed good overall survival prediction accuracy in patients with laryngeal squamous cell carcinoma.22 However, several limitations in using enhanced CT radiomics in the prognosis of LA-NPC still exist.
We used univariate analysis and LASSO-logistic regression to select significant features and establish radiomics signature. LASSO regression is an effective machine learning algorithm select the most predictive features for the results while avoiding model overfitting.23 We filtered 20 features in the training cohort. The rad-score suggested well discrimination, with an AUC of 0.897 and 0.856 in the training and validation cohorts, respectively, which is consistent with previous CT-based radiomics studies (AUC: 0.736–0.898).17,18,24–26 A PET/CT-based radiomics study in which the plain scan CT radiomics signature predicted the AUC of LA-NPC PFS was 0.73, which is lower than the AUC obtained in our study.27 There may be several reasons for this difference, including the fact that we have used enhanced CT while the study by Lv et al used plain CT, and therefore may have captured insufficient anatomical information. In addition, The ROI studied by Lv et al is depicted on a PET/CT fusion image, and some information on the ROI may be unclear. Finally, the number of cases included in the Lv et al study is small (128 cases), and for this reason their method of screening features and modeling is different from ours. In this study, the AUC of PET-based radiomics signature was 0.77–0.73, which is also lower than the one obtained with our model. The reason for this difference might be that the radiomics extract obtained from post-contrast CT might decode more biological information.28
Nomograms integrate different biological and clinical predictive factors to visualize a regression model, and compensate for the inclusion only anatomical factors in TNM staging,29 and hence can be helpful in tumor prognosis. We constructed a nomogram by rad-score and four clinical independent predictive factors, with a C-index of 0.925 (95% CI: 0.892~0.958) and 0.873 (95% CI: 0.803~0.943) in the training and validation cohorts, respectively, which are better than clinical nomogram. In this study, LDH>181U/L, treatment mode, T stage and N stage were considered the clinical risk factors for PFS of LA-NPC. The T stage and N stage are important predictive factors in the TNM staging system. LDH is an enzyme in the glycolysis pathway, which increases with the release of hypoxia from malignant tumors, and is considered to be a potential predictive biomarker in the prognosis of a variety of cancers.30 CCRT is the basis of treatment for LA-NPC. Compared with CCRT, IC+CCRT provide additional survival benefits to patients with LA-NPC, as has been suggested by a number of large multi-center Phase III clinical trials and meta-analysis.31–33 AC+CCRT is another treatment mode for LA-NPC, however, whether it can bring survival benefits remains unclear. In this study, the treatment mode was incorporated into the multivariate logistic analysis. The treatment mode was also an independent predictive factor of PFS, and patients who received IC+CCRT treatment would get a smaller risk score. Although some factors such as Hb, NLR, and PLR have been associated to the predictive power of NPC in some studies,34–36 they were not independent predictive factors in this study. This might have been due to several reasons. Firstly, the research did not unify the method to calculate the cut-off values. Reliable measurement methods and cut-off values will need to be further explored. Secondly, population heterogeneity along with the known limitations of retrospective studies with small samples might lead to bias in the results. Finally, the best time to collect data on hematological indicators has not yet been determined. In some studies, post-treatment Hb level was considered to be of predictive value, but the value of pre-treatment Hb level needs to be further confirmed.37,38 In addition, malignant tumors, infections and other factors can also activate the immune and inflammatory system and affect the levels of Hb, NLR and PLR and other parameters.39,40
The radiomics nomogram generated in this study combines TNM staging, serological indicators, treatment mode and a radiomics signature which includes a broader type of clinical and laboratory characteristics that can reflect the biological differences of different patients from various aspects. The utility of these indicators and the imaging approach are well recognized in clinical practice and also have several other advantages, including convenience and low-costs.
For the evaluation of a nomogram, in addition to the AUC, other models’ performance indexes, the calibration curve and the decision curve are also important factors to consider. The radiomic nomogram has the greatest predictive value (Table 3). Our calibration curve in the training and validation cohorts suggests that the prediction power of the radiomics nomogram is better than that of the clinical nomogram, TNM staging system. DCA shows that adding a rad-score prediction model can offer more net benefits than a purely clinical prognostic model. This finding confirms the important role of rad-scores in the prognosis of NPC. Zhang et al constructed a nomogram using MRI-based radiomics, and their C-index in the training and test cohort was 0.776 and 0.649, respectively, which were lower than those obtained in our model. These differences might be attributed to the heterogeneity of the two tools, the different modeling methods and the different clinical factors included.41 A recent study generated a prediction model for local recurrence in full-stage (stage I–IVa) NPC using enhanced CT imaging histology with an AUC of 0.931 in the training cohort and 0.799 in the test cohort. However, this model has been overfitted to some extent due to its small training data.42 In contrast, in our study, we collected a larger number of cases and selected patients with locally advanced disease who were more likely to have a poor prognosis. PFS, defined as time to progression or death, is commonly used clinically to assess tumor prognosis, and was chosen as the endpoint event. PFS can more accurately reflect poor prognostic, and PFS improvement is more likely to reflect clinical benefit than other surrogate markers. We further constructed a risk stratification nomogram based on rad-score, which can accurately evaluate the risk of patients with poor prognosis. Individualized treatment plans and interventions for patients with different risks are likely to help improve survival of patients.
Our study has some limitations. First, this was a single-center retrospective study, and some bias in the selection of patients may have occurred. Second, we were not able to include all tools and prognostic factors in our model. Although MRI and PET are also important imaging tools in the management of NPC, we did not perform cross-sectional comparisons and joint predictions. In addition, EBV-DNA has been shown to be a potential prognostic factor for NPC prognosis,43 but we decided not include it given that EBV-DNA screening methods have not yet been standardized across different laboratory and test results are highly variable. Finally, we have not yet analyzed the efficacy, adverse events and the clinical benefits associated with different treatment modes in different risk groups. These and other limitations merit further investigation and will be addressed in our subsequent studies.
Conclusion
Based on our results, we expect CT-based radiomics to be a valuable new prognostic marker for LA-NPC. We have demonstrated that a nomogram can provide accurate prognostic risk prediction information in patients with LA-NPC, and help clinicians in their pre-treatment assessment and treatment planning. Additional research to verify and improve our model is warranted.
Abbreviations
PFS, progression-free survival; LA-NPC, locoregionally advanced nasopharyngeal carcinoma; CT, computed tomography; ROI, the region of interest; C-index, consistency index; DCA, the decision curve analysis; NPC, nasopharyngeal carcinoma; IMRT, intensity-modulated radiotherapy; IC, Induction chemotherapy; CCRT, Concurrent Chemoradiotherapy; AC, Adjuvant chemotherapy; GLCM, gray level co-generation matrix; GLRLM, gray level length run length matrix; GLSZM, gray level size zone matrix; NGTDM, neighborhood gray tone difference matrix; GLDM, gray level dependence matrix; ICC, Intraclass correlation coefficient; Hb, hemoglobin; NLR, neutrophil to lymphocyte ratio; PLR, platelet to lymphocyte ratio; ALP, alkaline phosphatase; LDH, lactate dehydrogenase.
Ethical Approval and Consent to Participate
This study was approved by the Ethics Committee of Guangxi Medical University Cancer Hospital (LW2021034), in compliance with the Declaration of Helsinki. Due to the retrospective nature of the study, the risk to patients in this study is not greater than the minimum risk, so patient consent to review their medical records is not applicable. All patient information is anonymous.
Acknowledgments
This work was supported by the Key Research and Development Program Project of Guangxi Zhuang Autonomous Region [Grant No. GuikeAB18221007]; and The Independent Project of Key Laboratory of Early Prevention & Treatment for Regional High‐Incidence‐Tumor [Grant No. GKE-ZZ202014]; Guangxi Science and Technology Department research program [Grant No. AB18126031]; Wu Jieping Medical Foundation Clinical Research [Grant No. 320.6750.2020-08-15]; and Zhejiang Xinmiao Talent Plan Project in 2020 [Grant No.2020R410006].
Disclosure
The authors report no conflicts of interest in this work.
References
1. Chen YP, Chan ATC, Le QT, et al. Nasopharyngeal carcinoma. Lancet. 2019;394(10192):64–80. doi:10.1016/S0140-6736(19)30956-0
2. Lee HM, Okuda KS, González FE, et al. Current perspectives on nasopharyngeal carcinoma. Adv Exp Med Biol. 2019;1164:11–34.
3. Sun XS, Li XY, Chen QY, et al. Future of radiotherapy in nasopharyngeal carcinoma. Br J Radiol. 2019;92(1102):20190209. doi:10.1259/bjr.20190209
4. Lee AW, Tung SY, Chua DT, et al. Randomized trial of radiotherapy plus concurrent-adjuvant chemotherapy vs radiotherapy alone for regionally advanced nasopharyngeal carcinoma. J Natl Cancer Inst. 2010;102(15):1188–1198. doi:10.1093/jnci/djq258
5. Mayerhoefer ME, Materka A, Langs G, et al. Introduction to radiomics. J Nucl Med. 2020;61(4):488–495. doi:10.2967/jnumed.118.222893
6. Ouyang FS, Guo BL, Zhang B, et al. Exploration and validation of radiomics signature as an independent prognostic biomarker in stage III-IVb nasopharyngeal carcinoma. Oncotarget. 2017;8(43):74869–74879. doi:10.18632/oncotarget.20423
7. Zhao L, Gong J, Xi Y, et al. MRI-based radiomics nomogram may predict the response to induction chemotherapy and survival in locally advanced nasopharyngeal carcinoma. Eur Radiol. 2020;30(1):537–546. doi:10.1007/s00330-019-06211-x
8. Yang K, Tian J, Zhang B, et al. A multidimensional nomogram combining overall stage, dose volume histogram parameters and radiomics to predict progression-free survival in patients with locoregionally advanced nasopharyngeal carcinoma. Oral Oncol. 2019;98:85–91. doi:10.1016/j.oraloncology.2019.09.022
9. Peng H, Dong D, Fang MJ, et al. Prognostic value of deep learning PET/CT-based radiomics: potential role for future individual induction chemotherapy in advanced nasopharyngeal carcinoma. Clin Cancer Res. 2019;25(14):4271–4279. doi:10.1158/1078-0432.CCR-18-3065
10. Liang ZG, Tan HQ, Zhang F, et al. Comparison of radiomics tools for image analyses and clinical prediction in nasopharyngeal carcinoma. Br J Radiol. 2019;92(1102):20190271. doi:10.1259/bjr.20190271
11. Tengxiang L, Guanzhong G, Qingtao Q, et al. Quantitative analysis of CT radiomics features of nasopharyngeal carcinoma. Chinese J Med Phys. 2019;36(05):551–555.
12. van Timmeren JE, Cester D, Tanadini-Lang S, et al. Radiomics in medical imaging-”how-to” guide and critical reflection. Insights Imaging. 2020;11(1):91. doi:10.1186/s13244-020-00887-2
13. Lambin P, Rios-Velazquez E, Leijenaar R, et al. Radiomics: extracting more information from medical images using advanced feature analysis. Eur J Cancer. 2012;48(4):441–446. doi:10.1016/j.ejca.2011.11.036
14. Goh V, Sanghera B, Wellsted DM, et al. Assessment of the spatial pattern of colorectal tumour perfusion estimated at perfusion CT using two-dimensional fractal analysis. Eur Radiol. 2009;19(6):1358–1365. doi:10.1007/s00330-009-1304-y
15. Skogen K, Ganeshan B, Good C, et al. Measurements of heterogeneity in gliomas on computed tomography relationship to tumour grade. J Neurooncol. 2013;111(2):213–219. doi:10.1007/s11060-012-1010-5
16. Mao YP, Tang LL, Chen L, et al. Prognostic factors and failure patterns in non-metastatic nasopharyngeal carcinoma after intensity-modulated radiotherapy. Chin J Cancer. 2016;35(1):103. doi:10.1186/s40880-016-0167-2
17. Ji GW, Zhang YD, Zhang H, et al. Biliary tract cancer at CT: a radiomics-based model to predict lymph node metastasis and survival outcomes. Radiology. 2019;290(1):90–98. doi:10.1148/radiol.2018181408
18. Wang Y, Liu W, Yu Y, et al. CT radiomics nomogram for the preoperative prediction of lymph node metastasis in gastric cancer. Eur Radiol. 2020;30(2):976–986. doi:10.1007/s00330-019-06398-z
19. Bogowicz M, Riesterer O, Stark LS, et al. Comparison of PET and CT radiomics for prediction of local tumor control in head and neck squamous cell carcinoma. Acta Oncol. 2017;56(11):1531–1536. doi:10.1080/0284186X.2017.1346382
20. Kang B, Sun C, Gu H, et al. T1 stage clear cell renal cell carcinoma: a CT-based radiomics nomogram to estimate the risk of recurrence and metastasis. Front Oncol. 2020;10:579619. doi:10.3389/fonc.2020.579619
21. Cozzi L, Franzese C, Fogliata A, et al. Predicting survival and local control after radiochemotherapy in locally advanced head and neck cancer by means of computed tomography based radiomics. Strahlentherapie Und Onkologie. 2019;195(9):805–818. doi:10.1007/s00066-019-01483-0
22. Chen L, Wang H, Zeng H, et al. Evaluation of CT-based radiomics signature and nomogram as prognostic markers in patients with laryngeal squamous cell carcinoma. Cancer Imaging. 2020;20(1):28. doi:10.1186/s40644-020-00310-5
23. Vasquez MM, Hu C, Roe DJ, et al. Least absolute shrinkage and selection operator type methods for the identification of serum biomarkers of overweight and obesity: simulation and application. BMC Med Res Methodol. 2016;16(1):154. doi:10.1186/s12874-016-0254-8
24. Wu S, Zheng J, Li Y, et al. A radiomics nomogram for the preoperative prediction of lymph node metastasis in bladder cancer. Clin Cancer Res. 2017;23(22):6904–6911. doi:10.1158/1078-0432.CCR-17-1510
25. Zhou Y, He L, Huang Y, et al. CT-based radiomics signature: a potential biomarker for preoperative prediction of early recurrence in hepatocellular carcinoma. Abdominal Radiol. 2017;42(6):1695–1704. doi:10.1007/s00261-017-1072-0
26. Yuan C, Wang Z, Gu D, et al. Prediction early recurrence of hepatocellular carcinoma eligible for curative ablation using a Radiomics nomogram. Cancer Imaging. 2019;19(1):21. doi:10.1186/s40644-019-0207-7
27. Lv W, Yuan Q, Wang Q, et al. Radiomics analysis of PET and CT components of PET/CT imaging integrated with clinical parameters: application to prognosis for nasopharyngeal carcinoma. Mol Imaging Biol. 2019;21(5):954–964. doi:10.1007/s11307-018-01304-3
28. Bogowicz M, Vuong D, Huellner MW, et al. CT radiomics and PET radiomics: ready for clinical implementation? Quart J Nucl Med Mol Imaging. 2019;63(4):355–370. doi:10.23736/S1824-4785.19.03192-3
29. Wei KR, Zheng RS, Zhang SW, et al. Nasopharyngeal carcinoma incidence and mortality in China, 2013. Chin J Cancer. 2017;36(1):90. doi:10.1186/s40880-017-0257-9
30. Deme D, Telekes A. [Prognostic importance of lactate dehydrogenase (LDH) in oncology]. Orv Hetil. 2017;158(50):1977–1988. [Danish]. doi:10.1556/650.2017.30890
31. Yang Q, Cao SM, Guo L, et al. Induction chemotherapy followed by concurrent chemoradiotherapy versus concurrent chemoradiotherapy alone in locoregionally advanced nasopharyngeal carcinoma: long-term results of a phase III multicentre randomised controlled trial. Eur J Cancer. 2019;119:87–96. doi:10.1016/j.ejca.2019.07.007
32. Sun Y, Li WF, Chen NY, et al. Induction chemotherapy plus concurrent chemoradiotherapy versus concurrent chemoradiotherapy alone in locoregionally advanced nasopharyngeal carcinoma: a Phase 3, multicentre, randomised controlled trial. Lancet Oncol. 2016;17(11):1509–1520. doi:10.1016/S1470-2045(16)30410-7
33. Tan TH, Soon YY, Cheo T, et al. Induction chemotherapy for locally advanced nasopharyngeal carcinoma treated with concurrent chemoradiation: a systematic review and meta-analysis. Radiother Oncol. 2018;129(1):10–17. doi:10.1016/j.radonc.2018.02.027
34. Zeng X, Liu G, Pan Y, et al. Development and validation of immune inflammation-based index for predicting the clinical outcome in patients with nasopharyngeal carcinoma. J Cell Mol Med. 2020;24(15):8326–8349. doi:10.1111/jcmm.15097
35. Jiang Y, Qu S, Pan X, et al. Prognostic value of neutrophil-to-lymphocyte ratio and platelet-to-lymphocyte ratio in intensity modulated radiation therapy for nasopharyngeal carcinoma. Oncotarget. 2018;9(11):9992–10004. doi:10.18632/oncotarget.24173
36. Topkan E, Ekici NY, Ozdemir Y, et al. Baseline hemoglobin <11.0 g/dL has stronger prognostic value than anemia status in nasopharynx cancers treated with chemoradiotherapy. Int J Biol Markers. 2019;34(2):139–147.
37. Zeng Q, Shen LJ, Li S, et al. The effects of hemoglobin levels and their interactions with cigarette smoking on survival in nasopharyngeal carcinoma patients. Cancer Med. 2016;5(5):816–826. doi:10.1002/cam4.647
38. Gao J, Hu JY, Xia YF, et al. Continuous fall in hemoglobin level is a poor prognostic factor in patients with nasopharyngeal carcinoma treated with radiotherapy. Chin J Cancer. 2010;29(5):561–566. doi:10.5732/cjc.009.10533
39. Templeton AJ, McNamara MG, Šeruga B, et al. Prognostic role of neutrophil-to-lymphocyte ratio in solid tumors: a systematic review and meta-analysis. J Natl Cancer Inst. 2014;106(6):dju124. doi:10.1093/jnci/dju124
40. Janssens GO, Rademakers SE, Terhaard CH, et al. Improved recurrence-free survival with ARCON for anemic patients with laryngeal cancer. Clin Cancer Res. 2014;20(5):1345–1354. doi:10.1158/1078-0432.CCR-13-1730
41. Zhang B, Tian J, Dong D, et al. Radiomics features of multiparametric MRI as novel prognostic factors in advanced nasopharyngeal carcinoma. Clin Cancer Res. 2017;23(15):4259–4269. doi:10.1158/1078-0432.CCR-16-2910
42. Zhu C, Huang H, Liu X, et al. A clinical-radiomics nomogram based on computed tomography for predicting risk of local recurrence after radiotherapy in nasopharyngeal carcinoma. Front Oncol. 2021;11:637687. doi:10.3389/fonc.2021.637687
43. Nilsson JS, Forslund O, Andersson FC, et al. Intralesional EBV-DNA load as marker of prognosis for nasopharyngeal cancer. Sci Rep. 2019;9(1):15432. doi:10.1038/s41598-019-51767-9
 © 2021 The Author(s). This work is published and licensed by Dove Medical Press Limited. The
full terms of this license are available at https://www.dovepress.com/terms
and incorporate the Creative Commons Attribution
- Non Commercial (unported, 3.0) License.
By accessing the work you hereby accept the Terms. Non-commercial uses of the work are permitted
without any further permission from Dove Medical Press Limited, provided the work is properly
attributed. For permission for commercial use of this work, please see paragraphs 4.2 and 5 of our Terms.
© 2021 The Author(s). This work is published and licensed by Dove Medical Press Limited. The
full terms of this license are available at https://www.dovepress.com/terms
and incorporate the Creative Commons Attribution
- Non Commercial (unported, 3.0) License.
By accessing the work you hereby accept the Terms. Non-commercial uses of the work are permitted
without any further permission from Dove Medical Press Limited, provided the work is properly
attributed. For permission for commercial use of this work, please see paragraphs 4.2 and 5 of our Terms.