Back to Journals » International Journal of Chronic Obstructive Pulmonary Disease » Volume 14
Cross-sectional and longitudinal assessment of muscle from regular chest computed tomography scans: L1 and pectoralis muscle compared to L3 as reference in non-small cell lung cancer
Authors Sanders KJC, Degens JHRJ, Dingemans AMC, Schols AMWJ ![]()
Received 9 November 2018
Accepted for publication 23 January 2019
Published 3 April 2019 Volume 2019:14 Pages 781—789
DOI https://doi.org/10.2147/COPD.S194003
Checked for plagiarism Yes
Review by Single anonymous peer review
Peer reviewer comments 2
Editor who approved publication: Prof. Dr. Richard Russell
Karin JC Sanders,1 Juliette HRJ Degens,1 Anne-Marie C Dingemans,2 Annemie MWJ Schols1
1Department of Respiratory Medicine, NUTRIM School of Nutrition and Translational Research in Metabolism, Maastricht University Medical Centre, Maastricht, the Netherlands; 2Department of Respiratory Medicine, GROW School for Oncology and Developmental Biology, Maastricht University Medical Centre, Maastricht, the Netherlands
Background: Computed tomography (CT) is increasingly used in clinical research for single-slice assessment of muscle mass to correlate with clinical outcome and evaluate treatment efficacy. The third lumbar level (L3) is considered as reference for muscle, but chest scans generally do not reach beyond the first lumbar level (L1). This study investigates if pectoralis muscle and L1 are appropriate alternatives for L3.
Methods: CT scans of 115 stage IV non-small cell lung cancer patients were analyzed before and during tumor therapy. Skeletal muscle assessed at pectoralis and L1 muscle was compared to L3 at baseline. Furthermore, the prognostic significance of changes in muscle mass determined at different locations was investigated.
Results: Pearson’s correlation coefficient between skeletal muscle at L3 and L1 was stronger (r=0.90, P<0.001) than between L3 and pectoralis muscle (r=0.71, P<0.001). Cox regression analysis revealed that L3 (HR 0.943, 95% CI: 0.92–0.97, P<0.001) and L1 muscle loss (HR 0.954, 95% CI: 0.93–0.98, P<0.001) predicted overall survival, whereas pectoralis muscle loss did not.
Conclusion: L1 is a better alternative than pectoralis muscle to substitute L3 for analysis of muscle mass from regular chest CT scans.
Keywords: body composition, muscle mass, computed tomography, respiratory disease
Introduction
It is now widely recognized that loss of skeletal muscle mass adversely impacts clinical outcome and increases health care utilization in patients facing cancer or a chronic disease like COPD.1–7 Since low muscle mass is not restricted to those with lean stature,5 there is a growing interest to assess muscle mass with use of techniques that are easily applicable in the clinic or are already being used in regular clinical care for other diagnostic purposes. Whole body skeletal muscle mass can be estimated in clinical settings by measuring fat-free mass using bioimpedance analysis and dual-energy X-ray absorptiometry.8 Since these modalities are not typically incorporated in routine clinical care, other strategies to evaluate muscle mass have been employed. Computed tomography (CT) is increasingly used as a research tool for local quantification of skeletal muscle. These medical images provide the opportunity to obtain information about skeletal muscle quantity and quality. CT-derived skeletal muscle at the third lumbar level (L3) is considered as reference because muscle cross-sectional area at L3 is linearly related to whole-body muscle mass assessed by magnetic resonance imaging (MRI).9 As most chest CT scans do not reach beyond the first lumbar level (L1), attempts have been made to assess muscles at other levels. For this reason, in COPD research pectoralis muscle has been proposed as an alternative.10–12 However, it is unclear whether this pectoralis muscle reflects a reliable representation of whole body muscle area, as to date no studies compared the method with appropriate reference methods. The first aim of this study is therefore to investigate the association between pectoralis muscle cross-sectional area (CSA) and L3 muscle CSA.
The advantage of L3 and L1 as opposed to pectoralis is that besides skeletal muscle, adipose tissue CSA and distribution can also be quantified. Recently, skeletal muscle cut-off values for sarcopenia at L1 have been proposed based on CT analysis in a healthy American population. The authors reported good correlations regarding skeletal muscle CSA at L1 compared to L3. However, pectoralis muscle was not assessed, and data comparing adipose tissue between both regions are lacking.13 The second aim of the study is therefore to compare skeletal muscle and adipose tissue analysis between L1 and L3.
The added value of CT-derived analysis of body composition may not only be to phenotype patients with respiratory disease but even more to detect treatment-induced subtle changes in muscle CSA that may adversely affect disease progression or treatment outcome. The third aim of the study is to evaluate the association between changes in skeletal muscle CSA assessed from pectoralis muscle, L1, and L3 after tumor treatment to overall survival.
Materials and methods
Study subjects
To address the research questions, CT scans derived from a randomized clinical trial involving patients with non-small cell lung cancer (NSCLC) were analyzed. This multicenter randomized Phase II trial investigated nitroglycerin patches added to paclitaxel–carboplatin–bevacizumab in 223 therapy-naïve patients with stage IV non-squamous NSCLC. As part of standard workup, patients received an 18F-fluorodeoxyglucose positron emission tomography (PET) scan combined with CT scan at baseline. The study protocol pre-specified a second 18F-fluorodeoxyglucose PET/CT scan between days 22 and 24 (after second chemotherapy infusion). The study was performed in accordance with the provisions of the Declaration of Helsinki. The study was approved by the medical ethical committee of University Medical Center Groningen in the Netherlands (METC 2010.241) and registered at ClinicalTrial.gov (NCT01171170). All patients provided written informed consent before performing any study-related activities. Adding nitroglycerin to first-line carboplatin–paclitaxel–bevacizumab did not improve progression-free survival and overall survival in this cohort. The detailed methodology of this study has been published previously.14
Image analysis
CT scans were made at baseline and after the second chemotherapy infusion for response assessment. Cross-sectional measurements of skeletal muscle areas (CSA in cm2) were made on transverse images. Three images were selected for each patient. The pectoralis muscle slice was selected by scrolling toward the apex of the lungs and identifying the first axial image above the aortic arch. Bilaterally, the area of pectoralis major and minor muscles was measured. For slices at lumbar levels, the first image at the third and first lumbar levels with both vertebral transverse processes clearly visible was used in the analysis. The measurements included the psoas, erector spinae, quadratus lumborum, transversus abdominis, external and internal oblique, and rectus abdominis muscles.
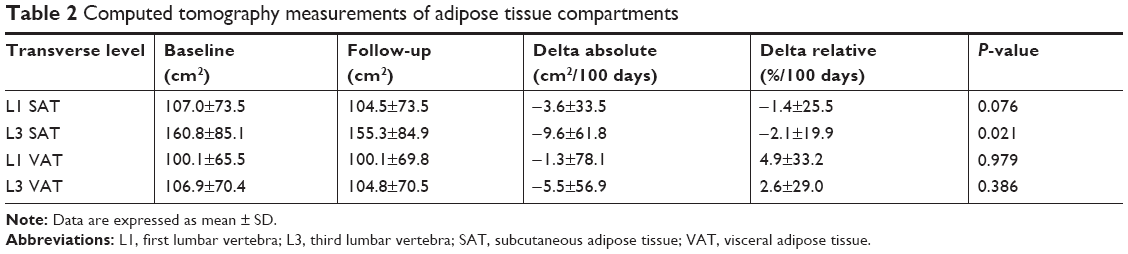
Additionally, adipose tissue compartments including subcutaneous adipose tissue (SAT) CSA and visceral adipose tissue (VAT) CSA were analyzed at L3 and L1. Proportional changes in CSA between CT scans were normalized for the time interval between scans. We therefore divided the proportional CSA change by the number of days between scans and multiplied by 100 days to standardize for all patients (percentage change per 100 days).
All analyses were performed with Slice-O-Matic software v5.0 (Tomovision, Montreal, QC, Canada). CSA of these structures was quantified on the basis of pre-established thresholds of Hounsfield units (skeletal muscle −29 to 150, inter-muscular adipose tissue −190 to −30, SAT −190 to −30, and VAT −150 to −50). Boundaries were corrected manually when necessary.
Statistical analyses
Patients were included if CT scans both at baseline and follow-up were available and contained images of pectoralis, L1, and L3. Descriptive statistics of demographic and clinical variables were obtained. Mean and SDs were provided for continuous normally distributed variables, median (range) for continuous not-normally distributed variables, and percentages for categorical variables. Comparisons within groups were performed with paired t-test or Wilcoxon signed-rank test.
To measure the strength of the linear association of different assay methods (pectoralis, L1, and L3 at baseline and during follow-up), Pearson’s correlation coefficient (r) was used.
Additionally, a Bland–Altman plot was drawn to investigate the existence of systematic bias and to identify possible outliers. Differences between assay methods are expressed as percentage of the values on the Y-axis. L3 was used as reference method and therefore plotted on the X-axis. If the mean value of the difference between assay methods is different from 0, it indicates a systematic difference. If there is proportional bias, the Bland–Altman plot shows whether or not this bias is constant for all the measures of CSAs.
To evaluate if pectoralis, L1, and L3 measured the same construct (ie, internal consistency), Cronbach’s coefficient alpha was calculated. Cronbach’s coefficient alpha is expressed as a number between 0 and 1, and values closer to 1 indicate good reliability among assay methods.
Kaplan–Meier survival analysis was performed to assess the contribution of skeletal muscle loss measured at different slices to overall survival. Overall survival was defined as the interval from randomization to death from any cause. A mean coefficient of variation between observers of 1.3% for skeletal muscle CSA in a random sample of 15 patients was observed, which is in line with the variation of 0%–2% in other studies (reference).5,15 Therefore, a measurement error of 1.3% was adopted for L1 and L3. Changes equal to or larger than −1.3% were considered as “loss of tissue”, while changes smaller than −1.3% were considered “maintenance of tissue”. A variation regarding pectoralis muscle is not described in the literature, and therefore the median was chosen as cut-off. The HR indicates the effect of increased muscle mass on overall survival. In addition, multivariate Cox regression analysis was performed with change in muscle CSA at the level of pectoralis muscle, L1 and L3, gender, age, and Charlson comorbidity index as independent variables. The WHO performance score was between 0 and 1 in the majority of the patients and therefore not included in the regression analysis.
All analyses were performed using SPSS statistical software (SPSS Statistics for Windows, version 24.0; IBM, Armonk, NY, USA). Results with two-sided exact P-values (≤0.05) were considered statistically significant.
Results
Patients and characteristics
In total, 223 patients were enrolled in the randomized controlled trial. One hundred and three patients were excluded due to unavailability of one or both CT scans, three patients were excluded because pectoralis muscle or L3 was not evaluable, one patient was excluded due to lack of overall survival data, and one was excluded for insufficient quality of the scans. After exclusion, CT scans from 115 patients were eligible. Sixty-four patients (56%) were male, with mean age of 61 years and body mass index (mean ± SD) of 25.1±4.2 kg/m2. Patient characteristics, treatment arm, Charlson comorbidity index, and overall survival rates were not different between patients included (n=115) and patients excluded (n=108) (data not shown).
Skeletal muscle
Mean ± SD skeletal muscle CSA (in cm2) of pectoralis, L1, and L3 for pre-chemotherapy scans were 36.0±10.1 (Table 1, Figure 1), 116.1±24.5, and 134.8±28.0, respectively.
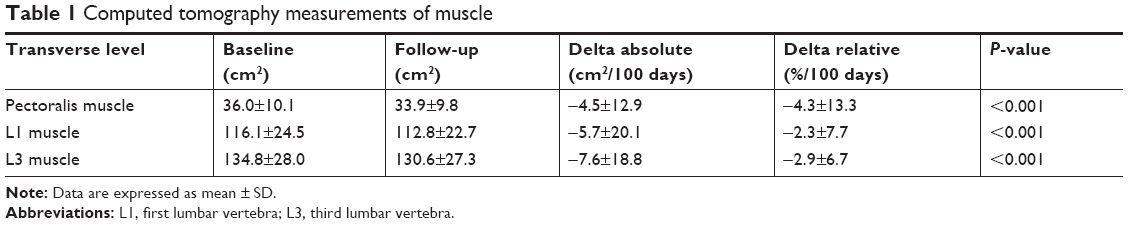 | Table 1 Computed tomography measurements of muscle |
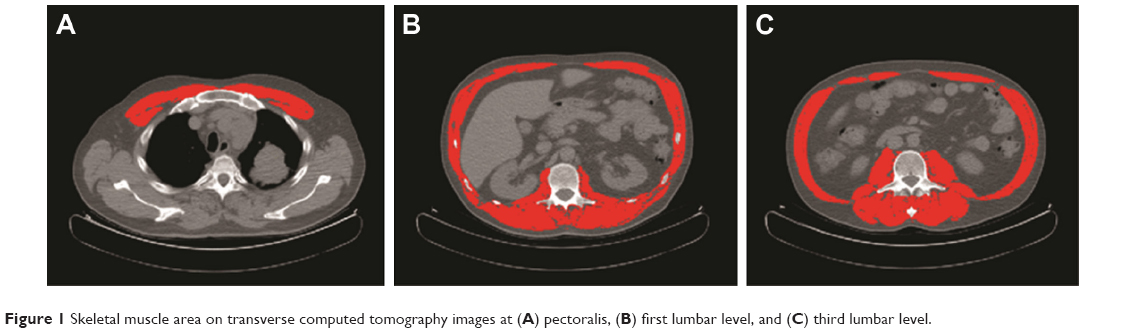 | Figure 1 Skeletal muscle area on transverse computed tomography images at (A) pectoralis, (B) first lumbar level, and (C) third lumbar level. |
Baseline r between pectoralis and L3 was 0.71 (P<0.001) (Figure S1A). The associating Bland–Altman plot shows that mean difference between pectoralis muscle and L3 muscle was 116.3%±13.6%, which was significantly different from 0 (P<0.001). The plot shows that the bias is relatively constant (Figure S1B). Cronbach’s alpha was 0.622.
Correlations, Bland–Altman plots, and Cronbach’s alpha were also performed for post-chemotherapy scans, showing similar results (data not shown).
Baseline Pearson’s r between L1 and L3 was 0.90 (P<0.001) (Figure S1C). The corresponding Bland–Altman plot shows that mean difference between L1 and L3 measuring muscle was 14.9%±9.0%, which was significantly different from 0 (P<0.001) (Figure S1D). The plot reveals that there is a bias which is almost constant for all measured CSAs. The muscle CSA of L3 is larger than L1. Cronbach’s alpha was 0.859, indicating a high internal consistency of skeletal muscle CSA measurement at L1 as compared to that at L3.
Adipose tissue
Mean ± SD SAT CSA (in cm2) of L1 and L3 for pre-chemotherapy scans were 107.0±73.5 and 160.8±85.1, respectively (Table 2).
 | Table 2 Computed tomography measurements of adipose tissue compartments |
Baseline r was 0.93 (P<0.001) (Figure S2A). The corresponding Bland–Altman plot shows that mean difference between L1 and L3 measuring SAT was 48.2%±26.5%, which was significantly different from 0 (P<0.001). The plot shows that the bias is not constant, as the difference is proportional to the magnitude of L3 muscle (Figure S2B). Cronbach’s alpha was 0.959, indicating a high internal consistency of SAT CSA measurement at L1 as compared to that at L3.
Mean ± SD VAT CSA (in cm2) of L1 and L3 for pre-chemotherapy scans were 100.1±65.5 and 106.9±70.4, respectively (Table 2). Baseline r was 0.90 (P<0.001) (Figure S2C). The corresponding Bland–Altman plot shows that mean difference between L1 and L3 measuring SAT was 5.4%±31.5%, which was significantly different from 0 (P<0.001). The plot shows that the bias is almost constant, with the exception of very low values of L3 VAT (Figure S2D). Cronbach’s alpha was 0.940, indicating a high internal consistency of VAT CSA measurement at L1 as compared to that at L3. Correlations, Bland–Altman plots, and Cronbach’s alpha were also performed for post-chemotherapy scans, showing similar results.
Longitudinal changes
Tables 1 and 2 display changes in body composition during the course of chemotherapy. Within two cycles of chemotherapy, muscle CSA significantly declined at the level of pectoralis, L1, and L3. SAT CSA at L3 decreased by −2.1%/100 days ±19.9 (P=0.021), while no significant changes in SAT CSA at L1 were observed. No changes were observed with respect to VAT.
Survival analysis
Kaplan–Meier survival analysis showed that skeletal muscle loss at L1 (HR 1.6, 95% CI: 1.08–2.36, P=0.020) and skeletal muscle loss at L3 (HR 1.9, 95% CI: 1.27–2.83, P=0.002), but not pectoralis muscle loss (HR 1.2, 95% CI: 0.79–1.70, P=0.463), were associated with overall survival (Figure 2).
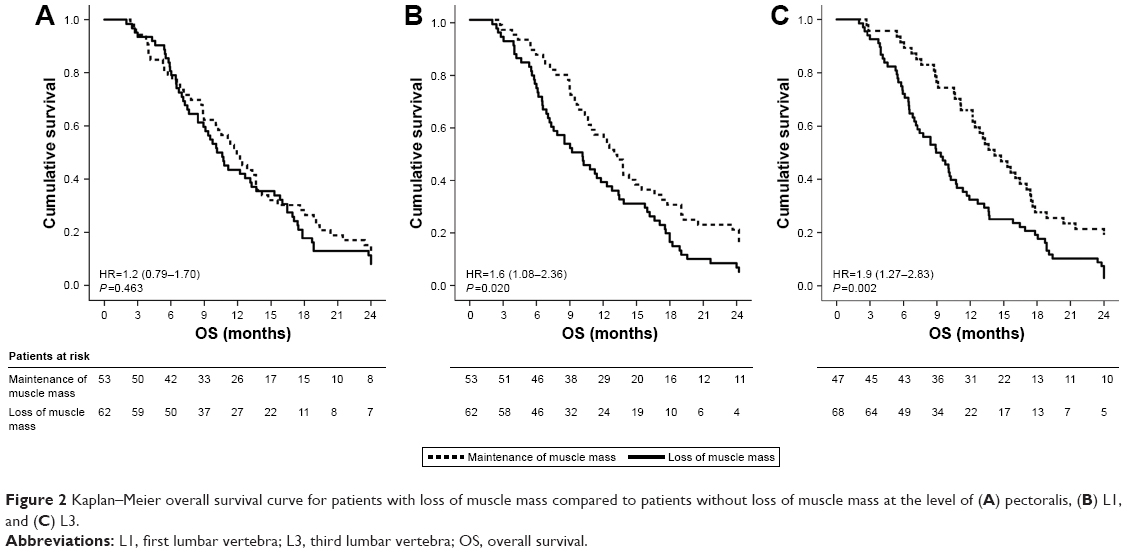 | Figure 2 Kaplan–Meier overall survival curve for patients with loss of muscle mass compared to patients without loss of muscle mass at the level of (A) pectoralis, (B) L1, and (C) L3. |
On multivariate analysis correcting for gender, age, and comorbidities, skeletal muscle loss at L3 and L1 levels was associated with overall survival, while pectoralis muscle loss was not (Table 3).
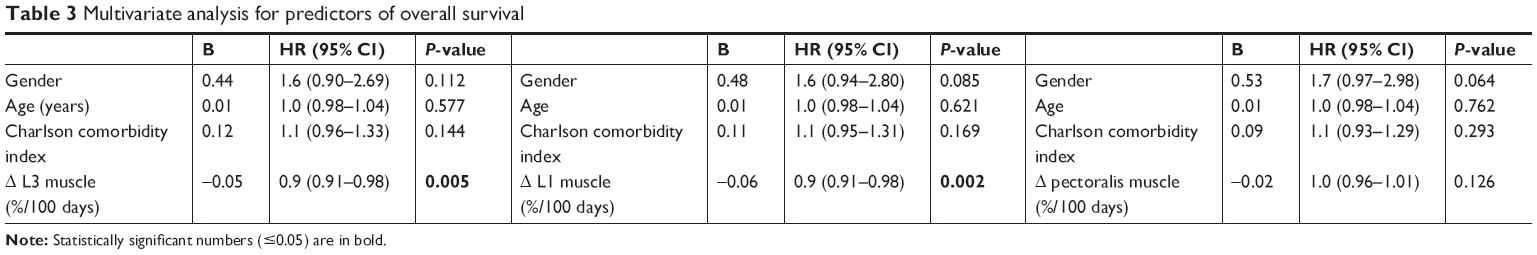 | Table 3 Multivariate analysis for predictors of overall survival |
Discussion
The main objective of this study was to investigate whether pectoralis muscle and L1 could be suitable alternatives for L3 to assess muscle CSA. Cross-sectional and longitudinal comparison revealed that L1 is strongly associated with L3 than pectoralis muscle.
To date, several studies have investigated CT-derived muscle mass to predict clinical outcome. The majority of studies conducted in patients with cancer involve quantification of L3. However, in COPD, a single-muscle approach has been used more frequently. Güerri et al showed in 20 COPD patients that those with a history of more frequent exacerbations exhibited smaller intercostal muscles, independent of age, gender, and body mass index. The authors failed to verify these results among other evaluated muscles including upper limb muscles and psoas muscle.16 Furthermore, attempts have been made to derive whole body fat-free mass from CT-based pectoralis muscle area by comparing pectoralis muscle with fat-free mass assessed by bioelectrical impedance analysis (BIA), but as BIA is a double indirect measure of fat-free mass,17 this cannot be considered as appropriate reference method, such as muscle mass derived by whole MRI. In addition, the unadjusted correlation between pectoralis and BIA-derived fat-free mass was low (R2=0.38).18 Also in other patient populations, similar attempts have been made to measure one muscle as representative for lumbar muscle CSA, including psoas muscle.19,20 However, Rutten et al found that change in psoas muscle area was not representative of total muscle area change.21 Overall, the idea that an individual muscle as opposed to total lumbar muscle reflects whole body muscle mass or fat-free mass has therefore not yet been appropriately validated.
Our results are in line with a previously published study performed in 90 small-cell lung cancer patients reporting similar baseline correlations between L3 and L1 muscles and between L3 and pectoralis muscle. Longitudinal data and adipose tissue CSA were not assessed.10 The advantage of lumbar assessment of muscle mass is that adipose tissue can also be assessed. Based on whole-body MRI, single slice adipose tissue quantification at different levels in the abdominal region (L4–5, 5 cm above and below) correlated well with total body adipose tissue.9 Analyzing adipose tissue at the level of L1 might be informative, as normal-weight COPD patients exhibited more VAT compared to smoking controls despite similar SAT.22 Additionally, the presence of excessive VAT contributed to increased plasma IL-6 and is associated with increased mortality in persons with obstructive lung disease,23 emphasizing the importance of body composition in chronic disease risk assessment.
The advantage of this study is that it included a well-defined randomized patient cohort. Limitations are that the CT scans were performed in different medical centers, which might have resulted in variation in acquisition and scanning procedures. However, the body composition data derived from pre- and post-chemotherapy scans were made in the same center, which implies that it will not have a major impact on the outcome of this research. Furthermore, not all CT scans could be retrieved and therefore only a subset of the scans has been analyzed. However, the data we presented here are very consistent. We therefore feel confident that this patient sample is representative of the whole study cohort.
Conclusion
The present study shows that L1 but not pectoralis muscle can substitute L3 to determine body composition from regular chest CT scans for cross-sectional and longitudinal purposes.
Data sharing statement
The data that support the findings of this study are available from the corresponding author upon request.
Disclosure
Anne-Marie C Dingemans reports a consulting or advisory role for Roche/Genentech, MSD Oncology, AstraZeneca, Pfizer, Lilly, Boehringer Ingelheim, Bristol-Myers Squibb, and Clovis Oncology, outside the submitted work. The other authors report no conflicts of interest in this work.
References
Schols AM, Broekhuizen R, Weling-Scheepers CA, Wouters EF. Body composition and mortality in chronic obstructive pulmonary disease. Am J Clin Nutr. 2005;82(1):53–59. doi:10.1093/ajcn.82.1.53 | ||
Shoup R, Dalsky G, Warner S, et al. Body composition and health-related quality of life in patients with obstructive airways disease. Eur Respir J. 1997;10(7):1576–1580. | ||
Vestbo J, Prescott E, Almdal T, et al. Body mass, fat-free body mass, and prognosis in patients with chronic obstructive pulmonary disease from a random population sample: findings from the Copenhagen city heart study. Am J Respir Crit Care Med. 2006;173(1):79–83. doi:10.1164/rccm.200506-969OC | ||
Decramer M, Gosselink R, Troosters T, Verschueren M, Evers G. Muscle weakness is related to utilization of health care resources in COPD patients. Eur Respir J. 1997;10(2):417–423. | ||
Prado CM, Lieffers JR, McCargar LJ, et al. Prevalence and clinical implications of sarcopenic obesity in patients with solid tumours of the respiratory and gastrointestinal tracts: a population-based study. Lancet Oncol. 2008;9(7):629–635. doi:10.1016/S1470-2045(08)70153-0 | ||
Malietzis G, Currie AC, Athanasiou T, et al. Influence of body composition profile on outcomes following colorectal cancer surgery. Br J Surg. 2016;103(5):572–580. doi:10.1002/bjs.10075 | ||
Shachar SS, Deal AM, Weinberg M, et al. Skeletal muscle measures as predictors of toxicity, hospitalization, and survival in patients with metastatic breast cancer receiving taxane-based chemotherapy. Clin Cancer Res. 2017;23(3):658–665. doi:10.1158/1078-0432.CCR-16-0940 | ||
Rozenberg D, Martelli V, Vieira L, et al. Utilization of non-invasive imaging tools for assessment of peripheral skeletal muscle size and composition in chronic lung disease: A systematic review. Respir Med. 2017;131:125–134. doi:10.1016/j.rmed.2017.08.007 | ||
Shen W, Punyanitya M, Wang Z, et al. Total body skeletal muscle and adipose tissue volumes: estimation from a single abdominal cross-sectional image. J Appl Physiol. 2004;97(6):2333–2338. doi:10.1152/japplphysiol.00744.2004 | ||
Diaz AA, Zhou L, Young TP, et al. Chest CT measures of muscle and adipose tissue in COPD: gender-based differences in content and in relationships with blood biomarkers. Acad Radiol. 2014;21(10):1255–1261. doi:10.1016/j.acra.2014.05.013 | ||
McDonald ML, Diaz AA, Ross JC, et al. Quantitative computed tomography measures of pectoralis muscle area and disease severity in chronic obstructive pulmonary disease. A cross-sectional study. Ann Am Thorac Soc. 2014;11(3):326–334. doi:10.1513/AnnalsATS.201307-229OC | ||
Tanimura K, Sato S, Fuseya Y, et al. Quantitative assessment of erector spinae muscles in patients with chronic obstructive pulmonary disease. Novel chest computed tomography-derived index for prognosis. Ann Am Thorac Soc. 2016;13(3):334–341. doi:10.1513/AnnalsATS.201507-446OC | ||
Derstine BA, Holcombe SA, Ross BE, et al. Skeletal muscle cutoff values for sarcopenia diagnosis using T10 to L5 measurements in a healthy US population. Sci Rep. 2018;8(1):11369. doi:10.1038/s41598-018-29825-5 | ||
Dingemans AM, Groen HJ, Herder GJ, et al. A randomized phase II study comparing paclitaxel-carboplatin-bevacizumab with or without nitroglycerin patches in patients with stage IV nonsquamous nonsmall-cell lung cancer: NVALT12 (NCT01171170) dagger. Ann Oncol. 2015;26(11):2286–2293. doi:10.1093/annonc/mdv370 | ||
Martin L, Birdsell L, Macdonald N, et al. Cancer cachexia in the age of obesity: skeletal muscle depletion is a powerful prognostic factor, independent of body mass index. J Clin Oncol. 2013;31(12):1539–1547. doi:10.1200/JCO.2012.45.2722 | ||
Guerri R, Gayete A, Balcells E, et al. Mass of intercostal muscles associates with risk of multiple exacerbations in COPD. Respir Med. 2010;104(3):378–388. doi:10.1016/j.rmed.2009.10.015 | ||
Lukaski HC, Johnson PE, Bolonchuk WW, et al. Assessment of fat-free mass using bioelectrical impedance measurements of the human body. Am J Clin Nutr. 1985;41(4):810–817. doi:10.1093/ajcn/41.4.810 | ||
McDonald MN, Diaz AA, Rutten E, et al. Chest computed tomography-derived low fat-free mass index and mortality in COPD. Eur Respir J. 2017;50(6). doi:10.1183/13993003.00711-2017 | ||
Amini N, Spolverato G, Gupta R, et al. Impact total psoas volume on short- and long-term outcomes in patients undergoing curative resection for pancreatic adenocarcinoma: a new tool to assess sarcopenia. J Gastrointest Surg. 2015;19(9):1593–1602. doi:10.1007/s11605-015-2835-y | ||
Kuroki LM, Mangano M, Allsworth JE, et al. Pre-operative assessment of muscle mass to predict surgical complications and prognosis in patients with endometrial cancer. Ann Surg Oncol. 2015;22(3):972–979. doi:10.1245/s10434-014-4040-8 | ||
Rutten IJG, Ubachs J, Kruitwagen R, et al. Psoas muscle area is not representative of total skeletal muscle area in the assessment of sarcopenia in ovarian cancer. J Cachexia Sarcopenia Muscle. 2017;8(4):630–638. doi:10.1002/jcsm.12180 | ||
Furutate R, Ishii T, Wakabayashi R, et al. Excessive visceral fat accumulation in advanced chronic obstructive pulmonary disease. Int J Chron Obstruct Pulmon Dis. 2011;6:423–430. doi:10.2147/COPD.S22885 | ||
van Den Borst B, Gosker HR, Koster A, et al. The influence of abdominal visceral fat on inflammatory pathways and mortality risk in obstructive lung disease. Am J Clin Nutr. 2012;96(3):516–526. doi:10.3945/ajcn.112.040774 |
Supplementary materials
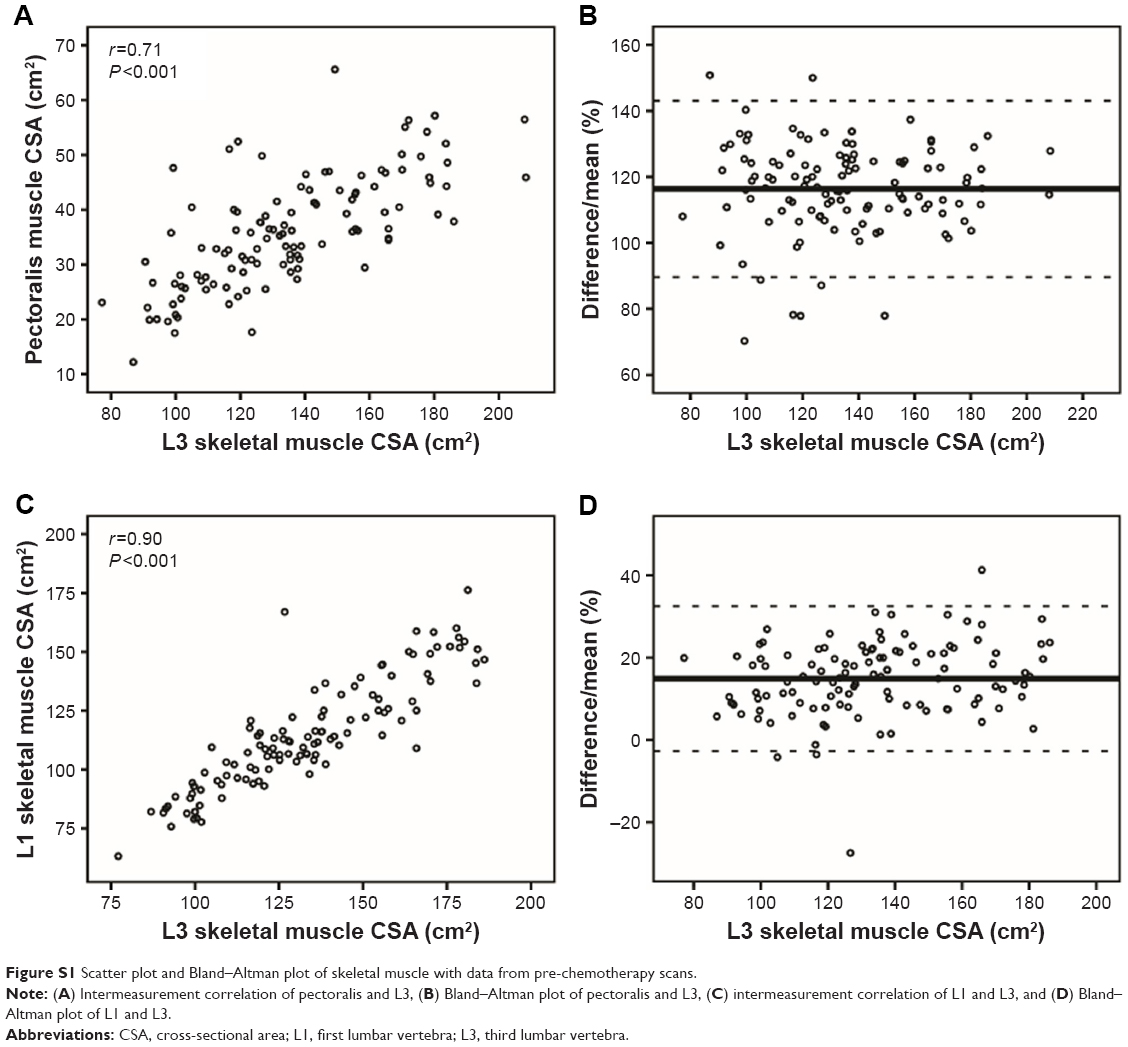 | Figure S1 Scatter plot and Bland–Altman plot of skeletal muscle with data from pre-chemotherapy scans. |
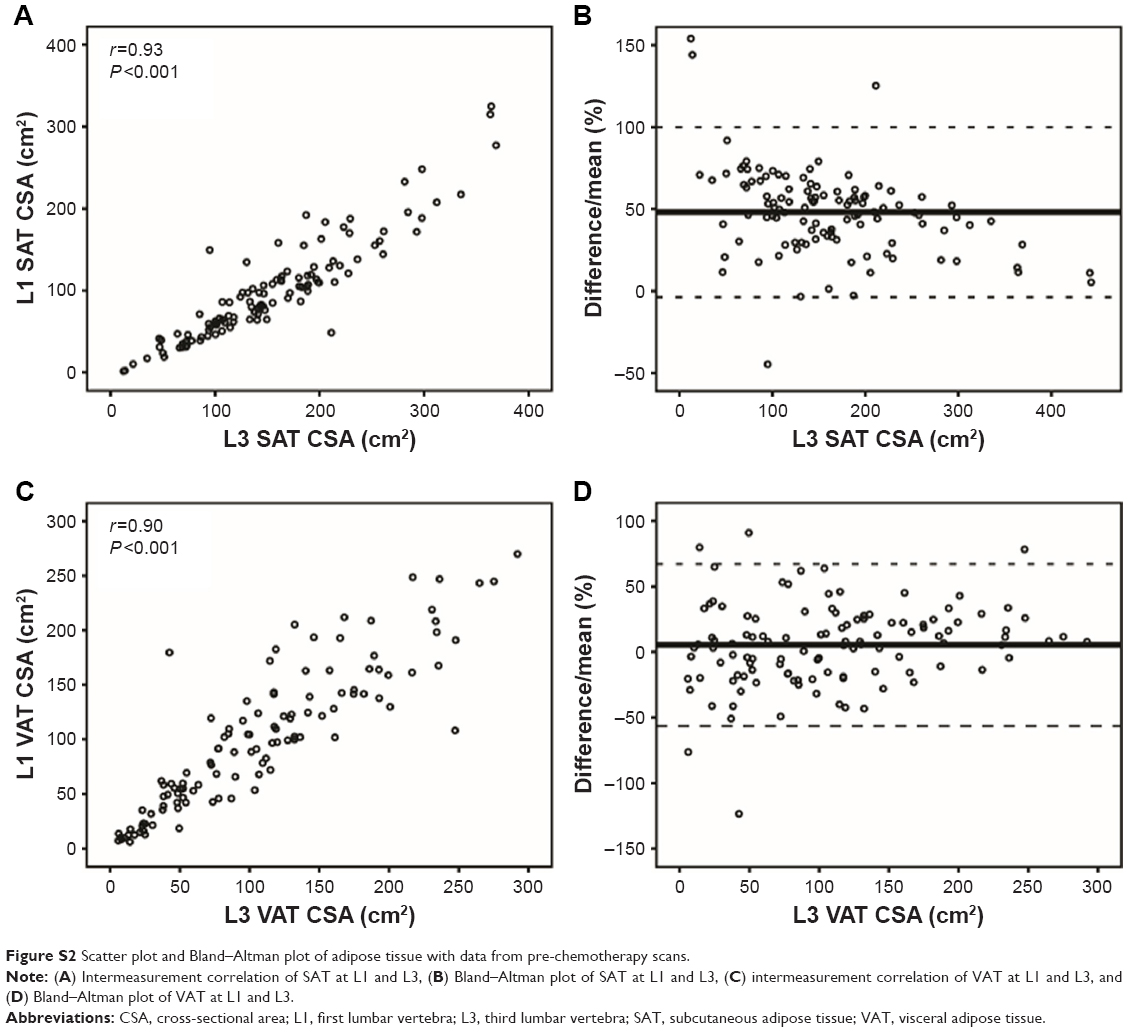 | Figure S2 Scatter plot and Bland–Altman plot of adipose tissue with data from pre-chemotherapy scans. |
 © 2019 The Author(s). This work is published and licensed by Dove Medical Press Limited. The
full terms of this license are available at https://www.dovepress.com/terms
and incorporate the Creative Commons Attribution
- Non Commercial (unported, 3.0) License.
By accessing the work you hereby accept the Terms. Non-commercial uses of the work are permitted
without any further permission from Dove Medical Press Limited, provided the work is properly
attributed. For permission for commercial use of this work, please see paragraphs 4.2 and 5 of our Terms.
© 2019 The Author(s). This work is published and licensed by Dove Medical Press Limited. The
full terms of this license are available at https://www.dovepress.com/terms
and incorporate the Creative Commons Attribution
- Non Commercial (unported, 3.0) License.
By accessing the work you hereby accept the Terms. Non-commercial uses of the work are permitted
without any further permission from Dove Medical Press Limited, provided the work is properly
attributed. For permission for commercial use of this work, please see paragraphs 4.2 and 5 of our Terms.