Back to Journals » Journal of Asthma and Allergy » Volume 17
Costs of Air Pollution in California’s San Joaquin Valley: A Societal Perspective of the Burden of Asthma on Emergency Departments and Inpatient Care
Authors Zarate-Gonzalez G ![]() , Brown P, Cisneros R
, Brown P, Cisneros R ![]()
Received 20 January 2024
Accepted for publication 25 March 2024
Published 17 April 2024 Volume 2024:17 Pages 369—382
DOI https://doi.org/10.2147/JAA.S455745
Checked for plagiarism Yes
Review by Single anonymous peer review
Peer reviewer comments 2
Editor who approved publication: Dr Luis Garcia-Marcos
Gilda Zarate-Gonzalez, Paul Brown, Ricardo Cisneros
Department of Public Health, University of California, Merced, CA, USA
Correspondence: Gilda Zarate-Gonzalez, Department of Public Health, University of California, Merced, 5200 N Lake Road, Merced, CA, 95343, USA, Tel + 1 559-269-3609, Email [email protected]
Introduction: The San Joaquin Valley (SJV) is often recognized as one of the most polluted regions in the US. Periods of pollution exposure are associated with increased health burden related to respiratory inflammation and undermined lung function, which aggravates respiratory diseases such as asthma and leads to symptoms such as coughing, wheezing, or difficulty breathing. Asthma costs US$ 82 billion annually in healthcare costs, missed work and school in the US.
Methods: Employing a societal perspective, a cost of illness design was combined with environmental epidemiological methods to analyze the economic impact of O3, NO2, and PM2.5-related adverse respiratory health outcomes amongst SJV residents who attended the emergency department (ED) or were hospitalized in 2016.
Results: Asthma exacerbations monetized value ranged from US$ 3353 to US$ 5003 per ED visit and for hospital admissions US$ 2584 per inpatient day for adults 65 years and older to US$ 3023 per child. The estimated value to society in healthcare costs, productivity losses, school absences, and opportunity costs from air pollution adverse health outcomes totaled US$ 498,014,124 in ED visits and US$ 223,552,720 in hospital admissions for the SJV population in 2016. The marginal reduction in the background concentrations of pollutants would avert 21,786 ED adverse events and 19,328 hospitalizations from the health burden on the SJV population or US$ 8,024,505 cost savings due to O3, US$ 82,482,683 from NO2 reductions, and US$ 46,214,702 from decreased concentration of PM2.5.
Conclusion: This study provides evidence that air pollution is a negative externality that imposes substantial social, environmental, and healthcare costs on the SJV. Furthermore, the region would avert significant adverse health outcomes realizing economic savings by reducing air pollution and exposures.
Keywords: health economics, air pollution, asthma, cost of illness, public health
Introduction
Compelling scientific literature has demonstrated the detrimental effects on human health of primary and secondary anthropogenic ambient air pollution: nitrogen dioxide (NO2), particulate matter (PM2.5), and ground-level ozone (O3).1–3 Children, adolescents, the elderly, and patients with cardiopulmonary diseases are particularly at risk of the deleterious effects of exposure to concentrations of criteria pollutants.4,5
Periods of pollution exposure are associated with increased health burden related to respiratory inflammation and undermined lung function, which aggravates respiratory diseases such as asthma and leads to symptoms such as coughing, wheezing, or difficulty breathing.6 Furthermore, the US Environmental Protection Agency (EPA) has recognized that human exposure to air pollutants, such as particular matter and ground-level ozone, are likely causes of asthma and respiratory infections.7
In the US asthma costs $82 billion annually in healthcare costs, missed work, and school absences.8 In other developed countries respiratory diseases account for 52 million DALY losses per year, a conservatively estimated value of $317 billion in healthcare costs, lost productivity, and disability.9 By 2050, global health-related costs from ozone exposure will be estimated to reach $580 billion.10 In just one region of India, economic losses due to PM2.5 pollution were valued at US$ 2.2 billion in 2013.11 NO2 has been deemed the “most harmful” of all nitrogen oxide compounds that humans are exposed to daily,12 and the National Health Service (NHS) of England has estimated that by 2025, NO2 will cost US$ 3.29 billion in healthcare and social costs for childhood asthma, coronary heart disease, stroke, and lung cancer.13
Current Evidence
The health and economic evidence of the impact of air pollution has been accumulating over time from studies worldwide. Existing research has examined the significant costs associated with exposure to particulate matter (PM) air pollution in France and Lebanon.14,15 These studies accounted for 135 million francs in medical care, pharmaceuticals, x-rays, and labs for one million residents living near a power plant who suffered asthma exacerbations, bronchitis, and other respiratory conditions, as well as a range of US$ 2,700,000 to US$ 126,000,000 for people 40–59 years old and 20 years of productivity loss associated with pneumonia, COPD and ED visits related to PM.
In the context of fast-growing economies, estimations indicate that air pollution costs India the equivalent of 8.5% of its annual growth domestic product.16 A peer-review study attributed US$ 113.08 million to PM and US$ 218.1 million to NO2 related adverse health outcomes such as bronchitis, asthma, and other acute respiratory symptoms in 13 months.17 In China, researchers estimated that excess deaths, premature mortality, hospital care, medicines, and outpatient visits for bronchitis and asthma related to PM2.5 resulted in a welfare loss of US$ 126.6 billion and productivity losses in the range of US$ 12.5 to US$ 44.6 billion.18 Another study determined that PM2.5 related asthma and acute and chronic bronchitis had a cost of US$ 55.01 billion in hospital care, outpatient visits, and labor income losses for 2013.19
In the United States, the focus has shifted towards transportation as a significant source of air pollution emissions and greenhouse gases.20 Existing studies in LA County and Southern California, quantified the costs associated with air pollution, especially near-roadway air pollution (NRAP).21,22 Their estimations included costs of US$ 441 million for ozone, and US$ 202 million for NO2 related asthma exacerbations and bronchitis in children from hospital admissions, emergency department visits, medications, and caregiver lost wages. Researchers found that the costs of coronary heart disease hospitalizations, treatment, and mortality associated with PM2.5 were US$ 16,751 million, and for NRAP as much as US$ 11,461 million.
The San Joaquin Valley Region
There is evidence that the San Joaquin Valley (SJV) region is overburdened by both air pollution and related ill health. California’s SJV is one of the most polluted regions in the US, exceeding state and national standards for ozone (O3) and particulate matter (PM2.5).23–25 Recent studies have demonstrated that NO2 has adverse impacts on asthma and respiratory symptoms for the region’s population despite meeting federal and state air quality standards.26–28 Also, the region has the highest prevalence of asthma (17.6%) compared to the state’s prevalence (15.7%), Los Angeles (15.1%), and the Bay Area’s (16%).29
In 2023, the American Lung Association gave every major city in the SJV a failing grade -F- in their “State of the Air” report for high ozone days, 24-hour particulate matter pollution, and annual particle pollution30 asserting that Bakersfield in Kern County had replaced the city of Fresno in having the worst short-term particle pollution, and has the most year-round particle pollution along with Visalia in Tulare County. Regional environmental scholars found a positive association between ground-level ozone exposure and increased emergency department visits, especially in children 6–18 years old (OR: 1.219) and people of color (OR: 1.159).24
California’s San Joaquin Valley (SJV) region is comprised of eight counties: Kern, Tulare, Kings, Fresno, Madera, Merced, Stanislaus, and San Joaquin. The region is the home of approximately 4.3 million residents,31 and it is situated at the midpoint between the San Francisco Bay Area and Los Angeles in Southern California,32 making transportation and distribution a considerable economic activity.33 Other economic drivers in the region include agriculture, and oil and gas production.
The SJV is an air basin with arid and semi-arid geography. Meteorological conditions in the area have distinct seasonal characteristics and combined with its unique topography, confine pollution emitted by sources, and gusted from contiguous regions.34 In recent years, the region has added wildfires and forest fires to the contributors of air pollutants in the region.35–37
Despite existing conditions and knowledge, there is only one peer-reviewed study addressing the health burden and associated costs of air pollution specifically for the SJV region published in 2008.38 Hall, Brajer & Lurmann measured the potential gains should the San Joaquin Valley region improve its air quality by estimating PM2.5 and ozone health effects and costs for ED visits, hospital admissions, school absences, work loss days, and restricted activity days of asthma, bronchitis, respiratory symptoms, and premature mortality using epidemiological estimates from other locations. They concluded that ozone-attributed health costs are US$ 32.64 million per year, and US$ 3,206 million per year are attributed to PM2.5 exposures; effectively $1000 per person in the Valley per year.
Aims and Research Questions
This study aims to analyze the economic impact of air pollution-related adverse respiratory health outcomes employing a societal perspective and cost-of-illness (COI) design.39 Using a prevalence approach, this research estimated the burden of air pollution on asthma and upper respiratory infections (URIs) amongst SJV residents who attended the ED and were hospitalized in 2016. The research questions to be answered in this work were: i) what are the asthma and URI direct and indirect health costs of SJV residents exposed to higher concentrations of NO2, PM2.5, and O3?, and ii) what are the effects of reducing pollution concentrations of O3, NO2, and PM2.5 in the attributable cases of asthma and URI ED visits and hospitalizations?
Materials and Methods
To test the research questions, the study’s design included strengthening factors from past economic-based health projects: 1) A COI study is a prevailing method for valuing the economic burden of disease; 2) The human capital theory40–42 is the leading approach used in COI or economic burden of disease studies; and 3) the study utilized a prevalence method43,44 to estimate ED and hospitalization costs related to air pollution in 2016.
The year 2016 was selected for this study as the SJV experienced fewer forest fires and wildfires ex-ante and ex-post, and could be employed in comparative analyses to other periods with further air pollution risks, particularly during climate-change-related events.45 Furthermore, after two congressional delays, 2016 was the first full year (12 months) of national ICD10 coding implementation which began on October 1, 201546 lessening execution uncertainty.
Exposure Assessment
The approach for assessing exposure in the SJV is derived from a regional epidemiological time-stratified case-crossover study28 that examined the relationship between exposure to NO2, O3, and PM2.5 and adverse health outcomes in asthma and upper respiratory infections using linked ED and hospitalization records as reported to the State of California Department of Health Care Access and Information (HCAI). The estimates describe the marginal effects of the associations between pollutant concentrations and adverse health outcomes that are the base for calculating population-attributable asthma outcomes. The health endpoints included in this study are shown in Table 1. For O3, the pollution-related asthma and URI estimate selected was for the ED visits in the SJV for 2016, since the hospital admissions estimate was not statistically significant in the regional epidemiological analysis,28 it was not included in this study.
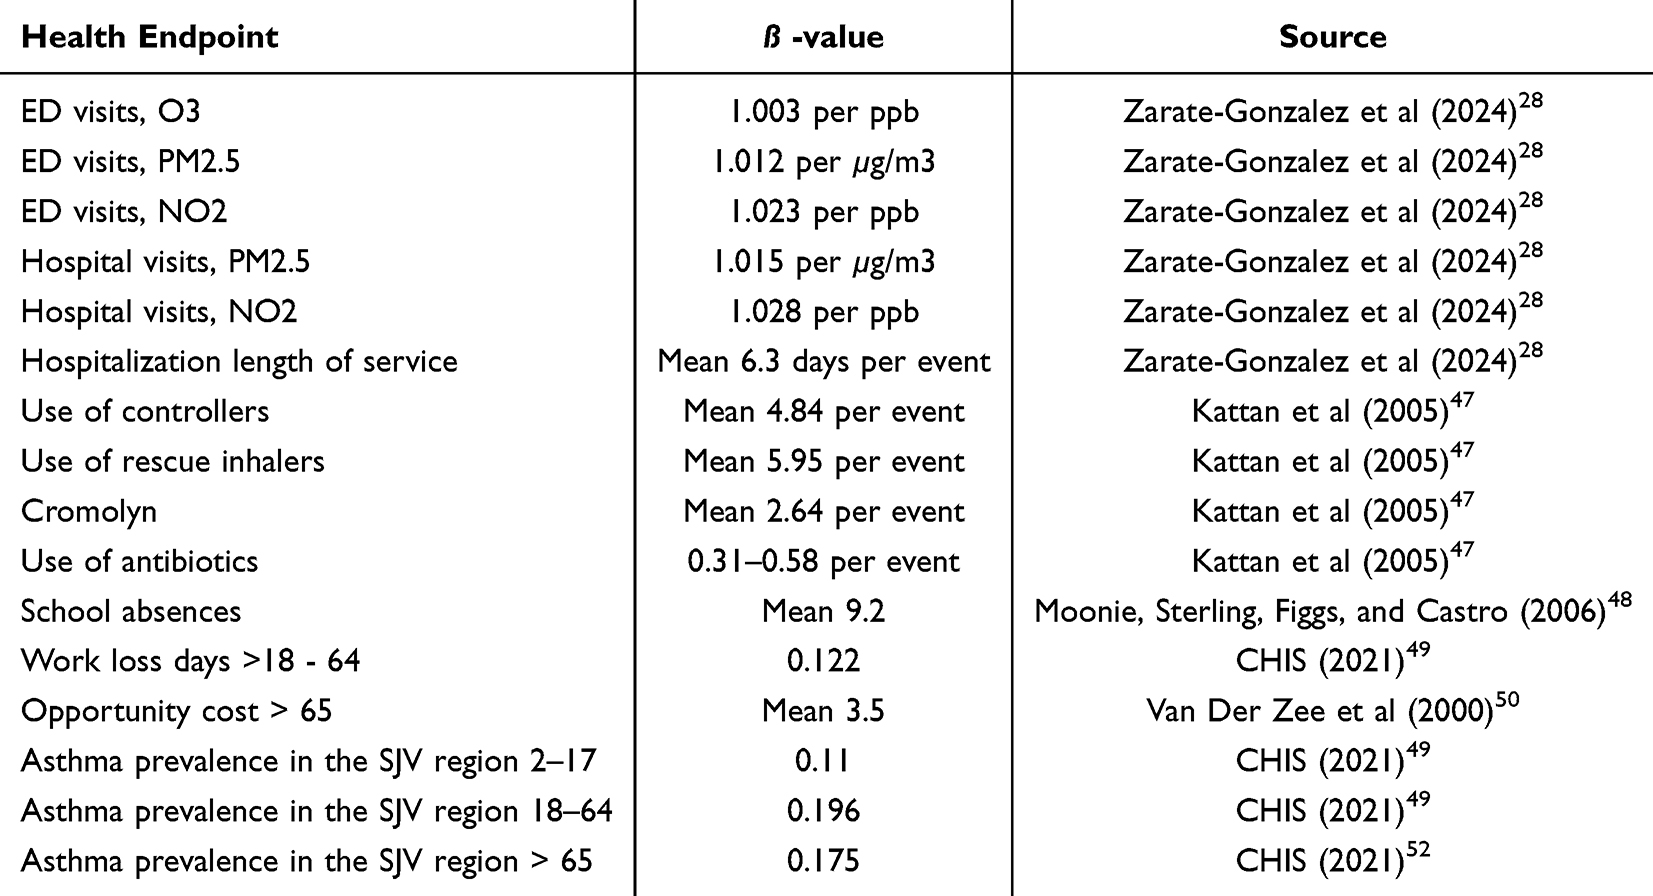 |
Table 1 Health Endpoints |
Air-Pollution Attributable Health Effects
Based on previous studies, the background levels of pollution selected were the interquartile ranges (IQR) for O3 and NO2 parts per billion measurements in the warm season and PM2.5 per µg/m3 in the cold season. The pollutant-related effects for the exposed population (Pe) were calculated per marginal increases in the IQR concentration levels at the 75th percentile to the maximum of each pollutant in the concentration-response function (CRF).
Using the 2016 population estimates from the California Department of Finance,51 the proportion of exposed (Pe) was estimated for each SJV county. The attributable risk percent (AP) for case-control studies52 was estimated to demonstrate the burden of ED visits and hospitalizations that are attributed to each pollutant among the exposed.
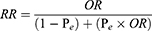
To model the number of events that may be averted with marginal decreases of pollutant concentrations in the SJV, the population-attributable fraction (PAF) was calculated using the modeled background concentration-response of exposure effects for ED visits and hospitalization cases adjusted for seasonality. The formula correction was applied for case-control designs (see Equation 1).53–55
The data from the California Health Interview Survey (CHIS) sources were used to identify the prevalence of asthma among people in the SJV. CHIS is a statewide health survey housed at the UCLA Center for Health Policy Research. The database was queried to gather estimated asthma rates by age of survey participants residing in the counties of the SJV.49
The analysis to estimate the adjusted PAF56 was conducted using STATA v.18.57
Monetized Value of Air Pollution-Related Morbidity
Cost Typology
The typology of the direct, indirect, and intangible morbidity costs attributed to O3, NO2, and PM2.5 pollution exposure is found in Figure 1. This approach accounts for a comprehensive estimate of healthcare and social costs attributed to ED visits and hospital admissions.
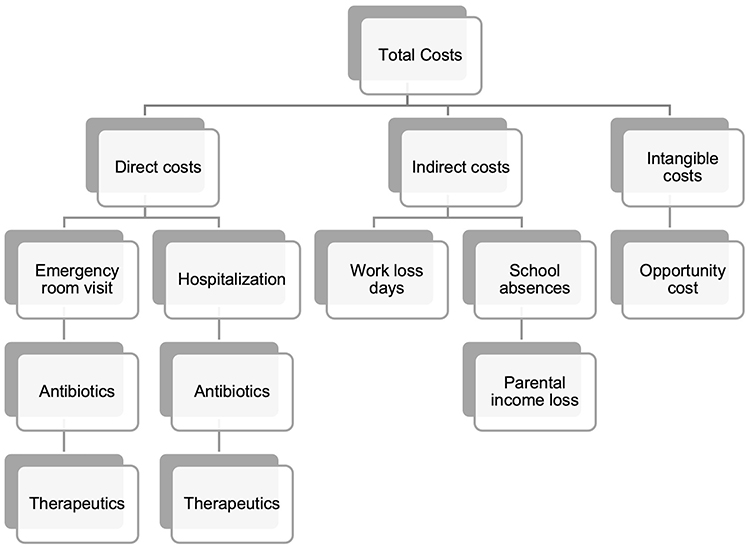 |
Figure 1 Cost typology for Asthma & URI ED visits and Hospitalizations. |
Economic Valuation: Direct Costs
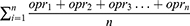
To monetize the air-pollution-related adverse health outcomes, the direct value attributed to ED and hospitalization cases was assessed using the 2016 Medicare Physician Fee Schedule and the Medicare Inpatient Hospitals Payments dataset from the Centers for Medicare and Medicaid Services (CMS).58 The approach to determine the cost of ED visits included estimating the mean amount paid for each operating procedure code reported in all encounters included in the exposure assessment, see Equation 2.
The estimation of an economic value for each hospitalization was retrieved from HCAI linked patient discharge data which included diagnostic-related groups (DRGs) for asthma and URI events in 2016. A uniform price was calculated using the CMS average paid dataset available by geography. The use of CMS payments by DRGs and procedure codes restricted potential underestimations or overestimations caused by variability in charges by providers or payments by health insurers and reduced uncertainty. Because DRGs are based on a resource-based valuation approach59–61 they more accurately reflect the value of the resources associated with treatments than payments by insurers. While DRGs characterize an improved measure of healthcare expenditures, the literature suggests that they may underestimate the costs to individuals (ie, out-of-pocket charges). Furthermore, research has found associations between the use of DRGs and shorter lengths of stays for inpatient stays which may be contradictory to the anticipated therapeutic benefits of medical interventions.62–67
The cost of medications associated with asthma management therapeutics such as antibiotics, controllers, and rescue inhalers were obtained using data from the available literature and the publicly available data. Existing literature was used to identify the characteristics and recommended frequency of pharmaceutical use and duration,47 such as clinical guidelines.
Market prices were used to estimate the cost of the treatments.68 Undergoing this approach allowed a comprehensive inclusion of all healthcare related to an ED visit or hospitalization due to asthma exacerbations or upper respiratory infections.
Economic Valuation: Indirect and Opportunity Costs
The indirect costs for ED visits and hospitalizations due to air pollution-related asthma and URI exacerbations were the value of adult (18+ years of age) SJV resident cases’ time waiting and receiving care. For children 2–17 years old, the value of time included a parent or caretaker’s time waiting and caring for the patient. Indirect and intangible cost data, such as loss of workdays or productivity loss, and school absences were obtained through the exposure assessment patient discharge data, peer-reviewed literature,48 and educational and labor agencies, such as the California Employment Development Department,69 see Table 2.
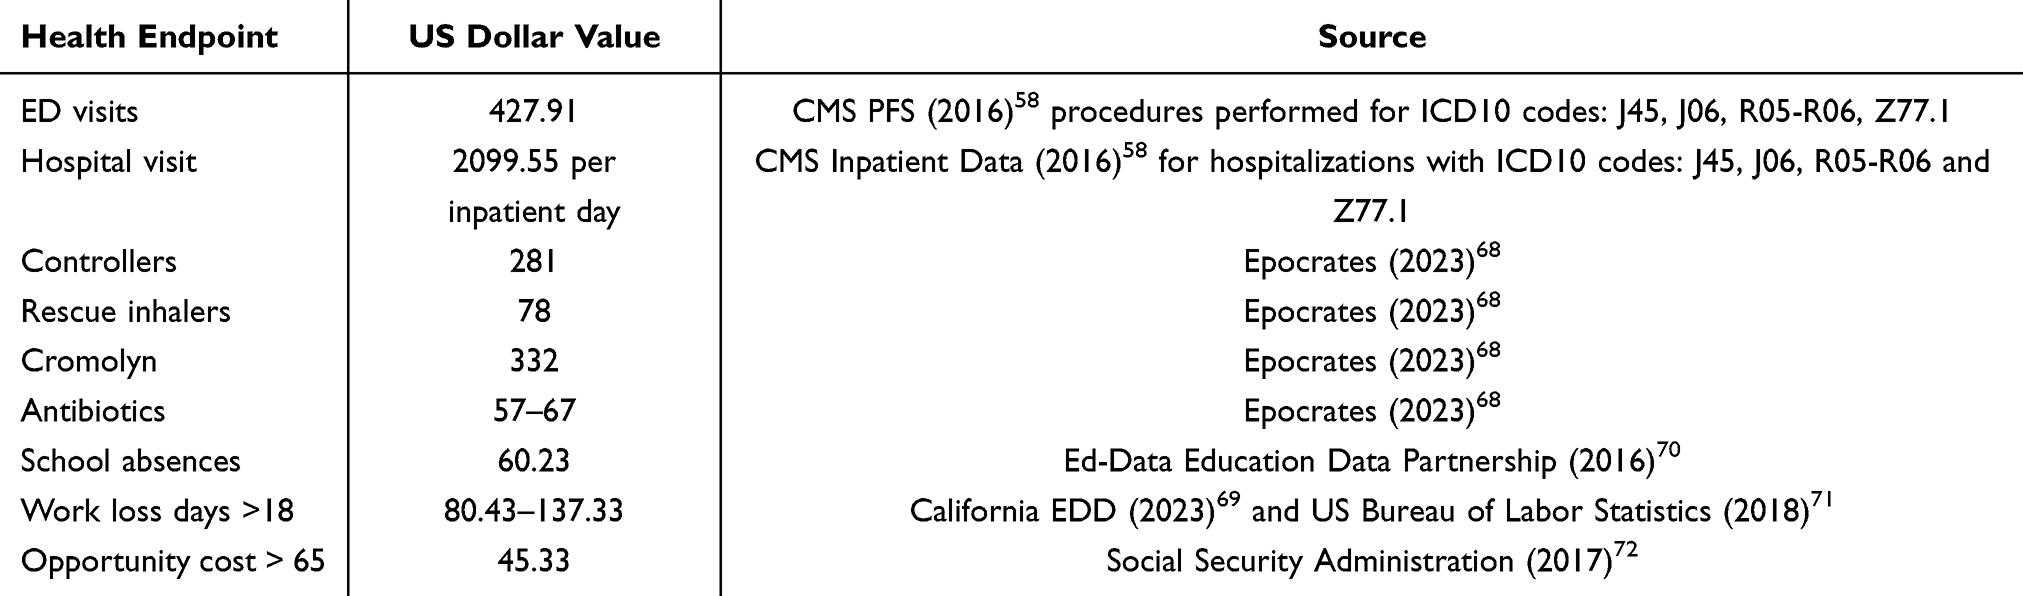 |
Table 2 Economic Values |
Furthermore, for ED visits, one workday was used as the time for missed school by children and a workday or productivity loss for the parent/caretaker and valued at the state reimbursement loss for the average daily attendance reimbursement70 and average wage rate in California.71 For the population 65+ years of age, the opportunity cost for ED visits and hospitalizations was estimated to assess the value of time that could be spent doing other activities, the base of the calculation was average symptom days for ED visits obtained from the literature,50 and the mean length of service days for 2016 hospitalizations. The economic value was retrieved from the Social Security Administration’s average retiree benefit amount in 2016.72
Results
Estimates of attributable risk proportion (AR%) for asthma and URI ED visits and hospitalizations in 2016 from exposure to the three criteria pollutants included in this study are presented in Table 3 with lower and upper limits. The highest risk among the exposed is attributed to PM2.5 in ED visits, and ground-level O3 had the lowest risk. Because NO2 was found to have higher odds of attending the ED and being hospitalized in the warm season of the SJV air basin, the risk for NO2 is also higher in the exposed than the effects of exposure to O3. The exponential odds ratio increases in IQR of each pollutant measured by federally regulated air monitors in 2016 are presented with 95% confidence intervals.
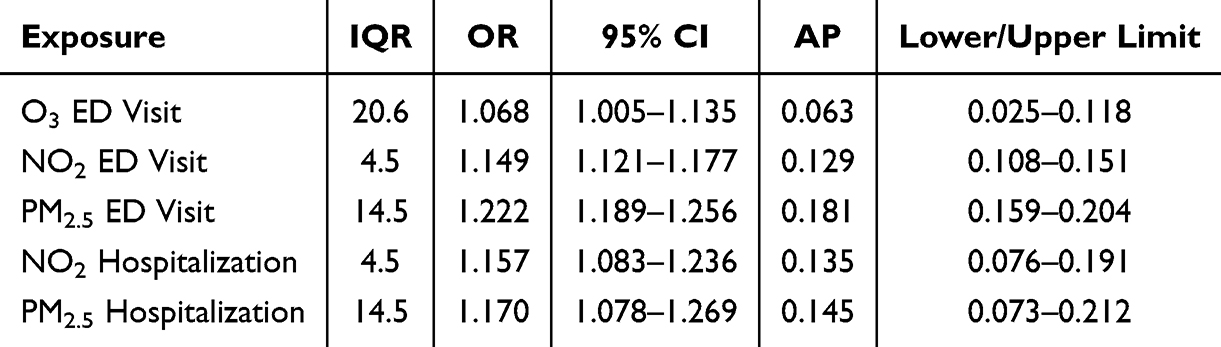 |
Table 3 Attributable Risk Proportion |
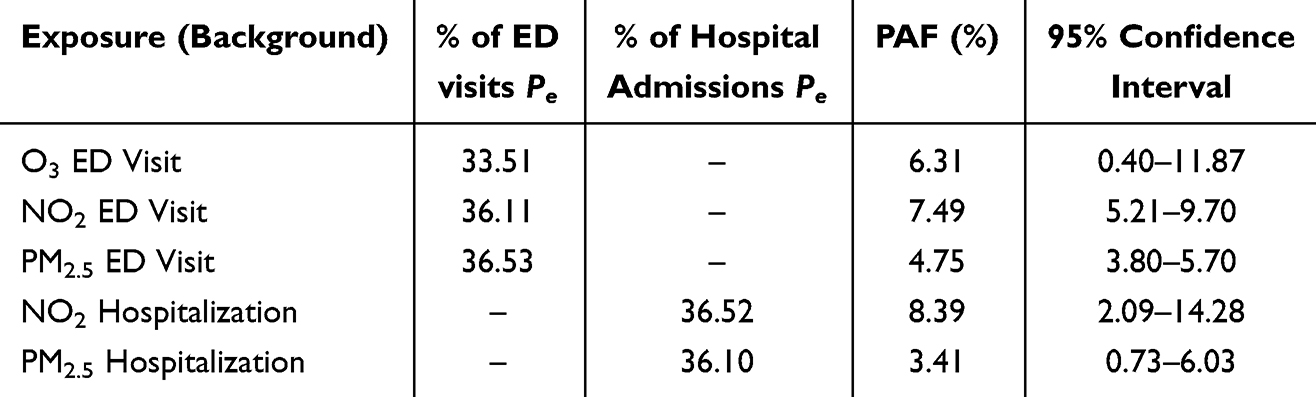 |
Table 4 SJV Region Population Attributable Fraction |
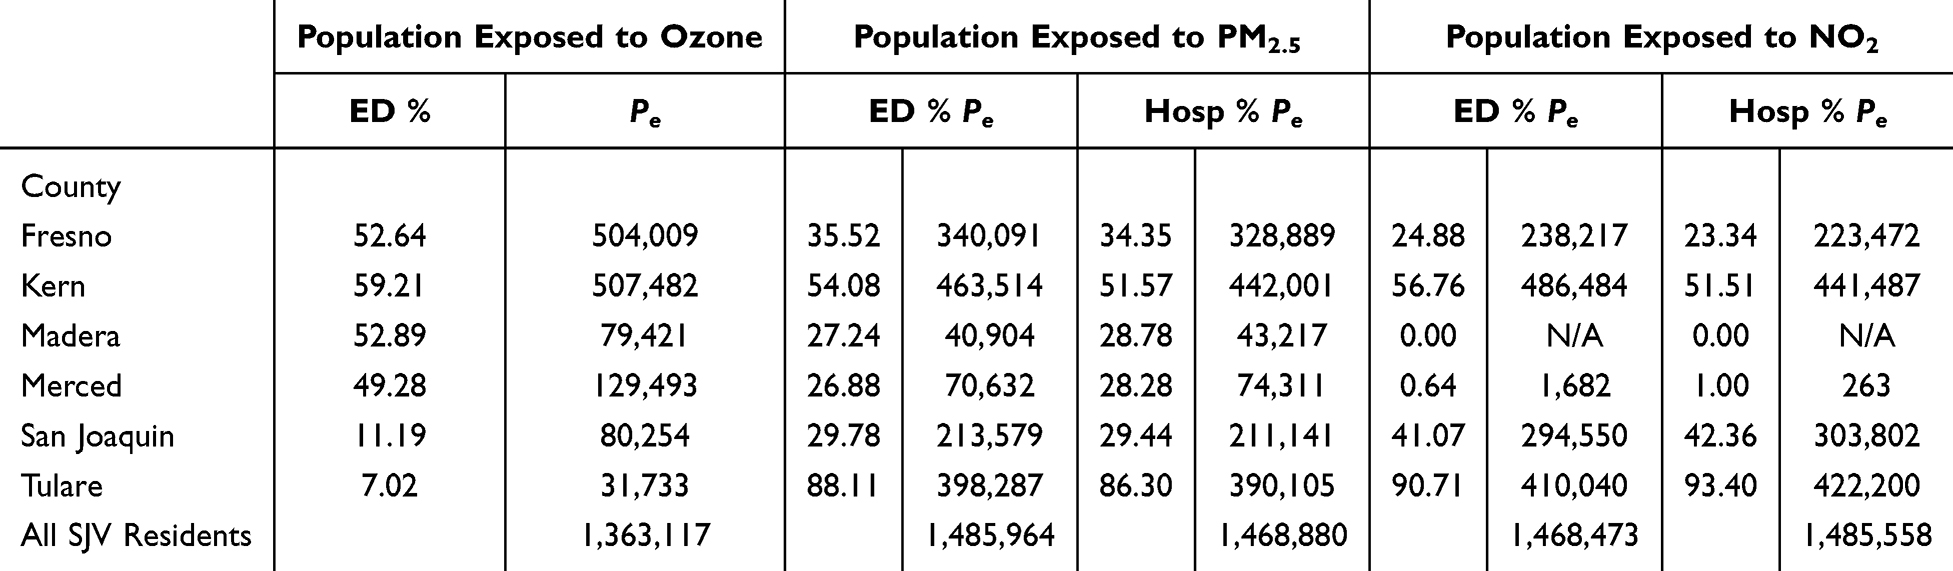 |
Table 5 SJV Population Exposed by County and Criteria Pollutant |
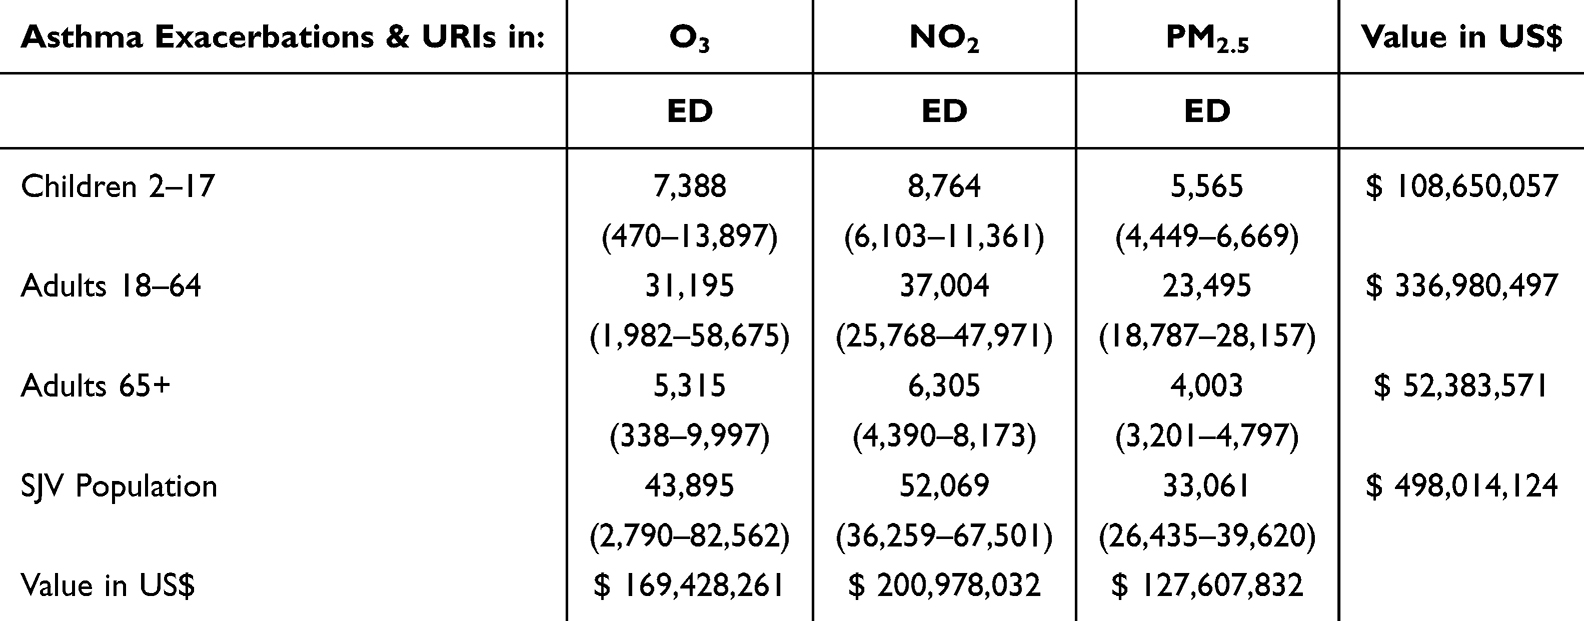 |
Table 6 Emergency Department Events Attributed to Pollutant Background Levels |
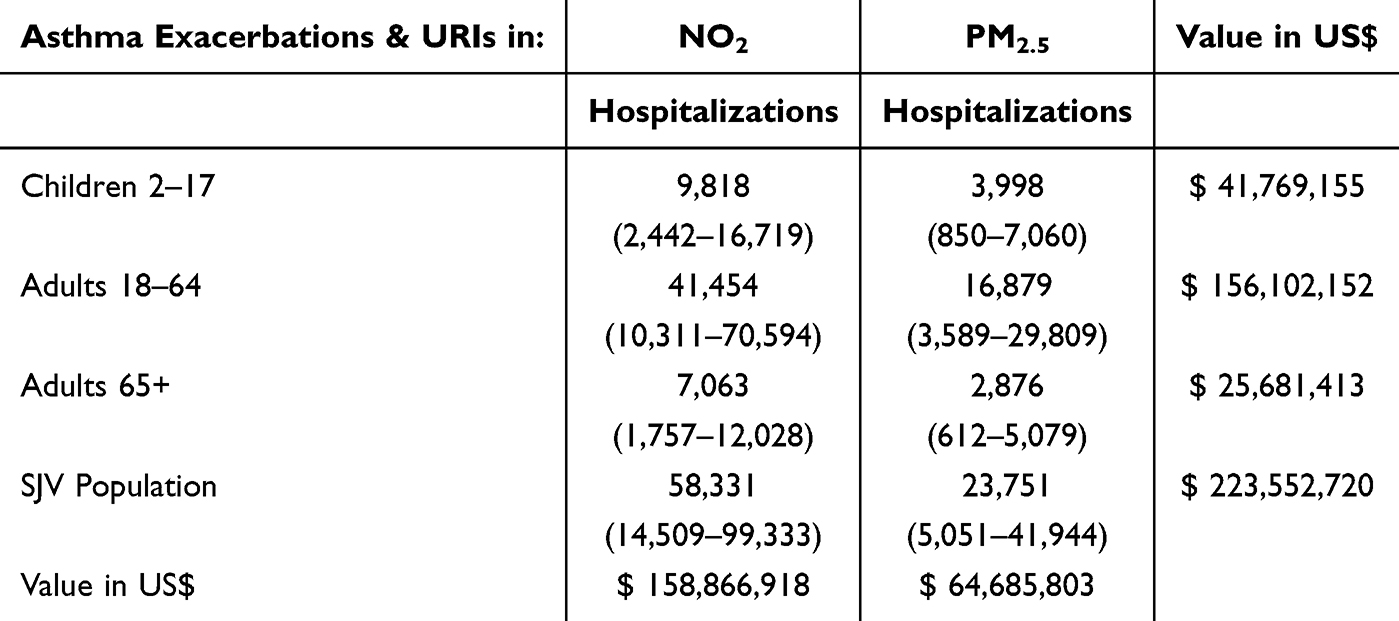 |
Table 7 Hospital Events Attributed to Pollutant Background Levels |
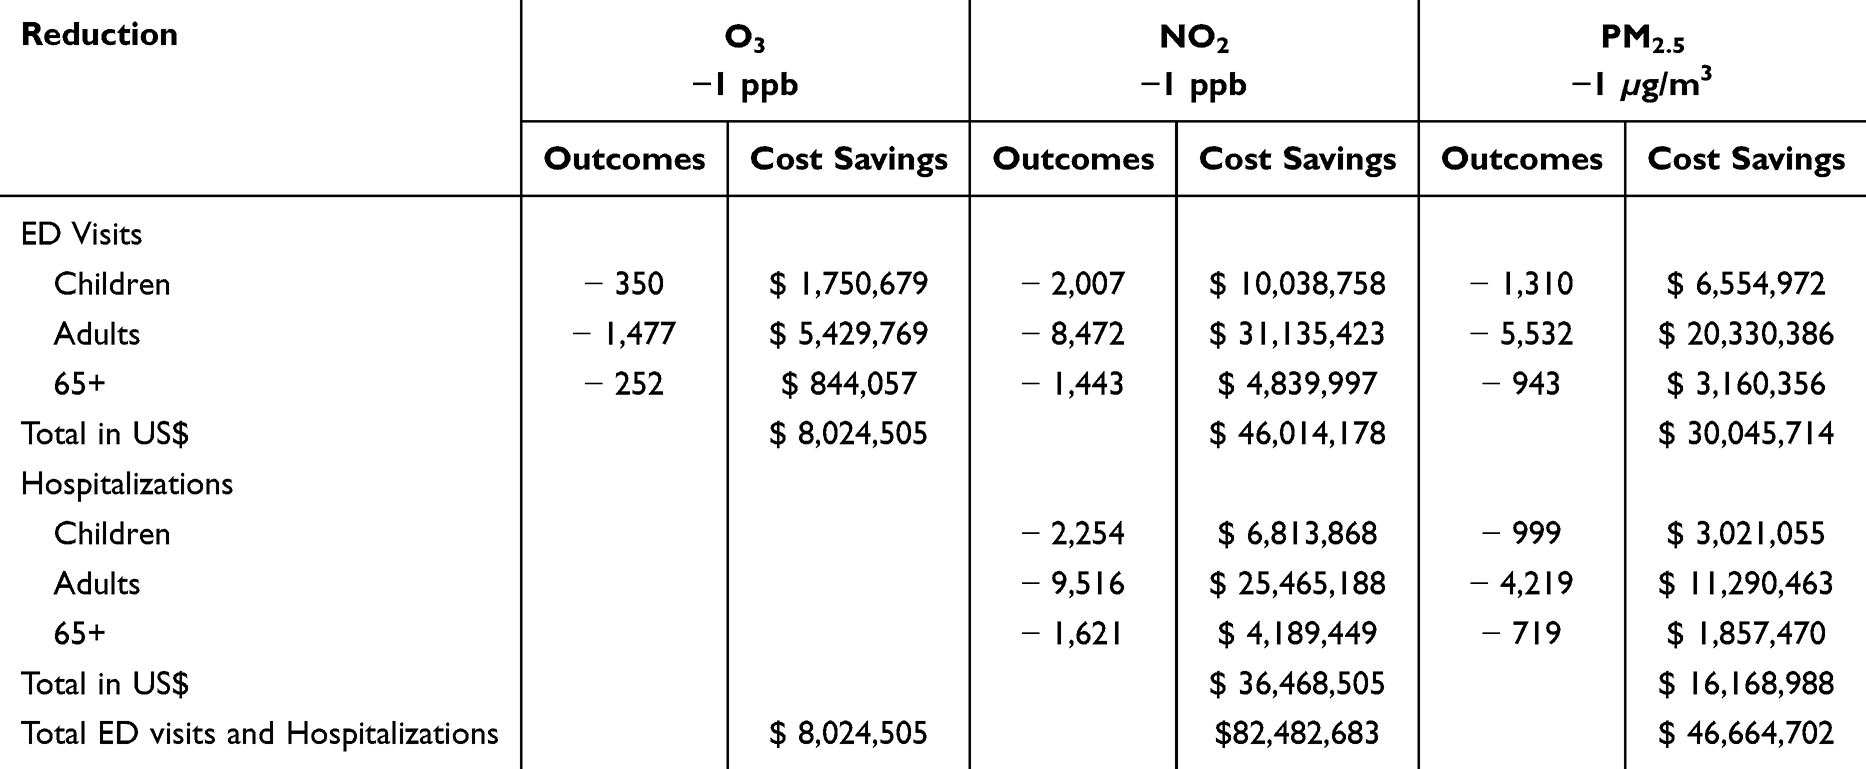 |
Table 8 Health Effects per Marginal Reductions of Pollution Concentration |
To evaluate the economic and public health impact of reducing the exposure to O3, NO2, and PM2.5 in asthma and URI-related ED visits and hospital admissions, first, the population-attributable fractions were estimated for each pollutant at the IQR levels in each season of 2016. The SJV population exposed proportion and the adjusted population attributable fraction (PAF) for each pollutant in the study are shown in Table 4.
To illustrate the SJV population residents that were exposed to each criteria pollutant included in the study, using the available results from an epidemiological study for the region’s population,28 the estimates are available in Table 5.
Health Outcome: Emergency Department Visits
The estimated number of ED visits attributable to exposure to background levels of O3, NO2, and PM2.5 concentrations is in Table 6. The cases are categorized by age for children (2–17 years of age), adults (18–64 years old), and older adults (65 years and older). The classification of results in these age categories demonstrates the difference in health care and societal costs associated with waiting, caring for, receiving treatment, productivity loss, missed school, and opportunity costs. Hence, the monetized costs range from US$ 3,353 for adults 65 years and older, US$ 3,675 for working-age adults, to US$ 5,003 for school-age children per ED visit, where children’s asthma and URI monetization has a higher value because of the amount of time and resources that a parent or caretaker must spend with that child during symptoms days and treatment.
In 2016, the value to society for the cases of asthma and URI due to ground-level ozone was US$ 169,428,261. Of the total population of the SJV, which was 4,067,792 in 2016, 1,064,355 were children 2–17 years old, and asthma and URI cases attributed to ground-level ozone were 7,388. Working-age adults of the SJV had the largest proportion of the population, 2,522,151, and the number of cases attributed was 31,195. Adults 65 years and older were 481,286 in 2016 and accounted for 5,315 estimated cases of emergency department visits for asthma and URI attributed to ground-level ozone exposure. Estimates of NO2 exposure effects on ED visit cases in children were 8,764 events, for working-age adults 37,004, and for older adults 6,305. The value of NO2 exposure-related ED events was US$ 200,978,032 for the SJV population. PM2.5 healthcare costs and economic losses represented US$ 127,607,832, with a burden of 5,565 visits to the ED for children, 23,495 for adults 18–64 years old, and 4,003 for the elderly.
Health Outcome: Hospital Admissions
The exposure assessment did not find the association between O3 exposure and hospitalization statistically significant; thus, it was not included in this study’s estimated population-attributable effects of outdoor pollutants. The estimated cases of NO2 and PM2.5, with lower and upper limits, attributed effects on hospital admissions are reported in Table 7.
Asthma exacerbations and URI hospital admissions estimate value range was US$ 2,584 per inpatient day for adults 65 years and older, US$ 2,676 for working-age adults, to US$ 3,023 per child. The mean length of service for 2016 hospital admissions was 6.3 days in the exposure assessment.
The estimated hospitalizations for children in the SJV attributable to NO2 were 9,818 and 3,998 for PM2.5 and a value of US$ 41,769,155. Working-age adults’ hospital admissions burden was 41,454 events for NO2 and 16,879 for PM2.5, and for the elderly NO2 and PM2.5 contributed to 7,063 and 2,876 cases respectively.
The estimated value to society for air pollution adverse health outcomes totaled US$ 498,014,124 in ED visits and US$ 223,552,720 in hospital admissions for the SJV population in 2016.
Modeling Exposure Reduction Effects on Health Outcomes
The population-attributable fraction (PAF) measures the proportion of cases in a population that can be attributed to an exposure and assists in evaluating the potential impact of reducing or eliminating the risk factor. The PAF was used to estimate the impact of marginal pollution concentration reduction of one unit measure in the cases of ED visits and hospitalizations for asthma exacerbations and URIs in the SJV population. Each outcome is valued in 2016 US$ and are presented in Table 8.
In the model for ground-level ozone, the decrease of 1 ppb in the background concentration of air quality would result in 2,079 fewer ED visits annually for children 2–17 years old, working-age adults, and adults 65 years and older. The total cost savings to society would be valued at US$ 8,024,505 in healthcare costs, productivity loss, school absences, and opportunity costs.
Reducing the concentrations of 1 ppb in the concentrations of NO2 from the air that SJV residents breathe would save US$ 82,482,683 annually in 4,261 fewer asthma ED visits and hospitalizations for children, 17,998 for working adults, and 3,064 fewer ED visits and hospitalizations for older adults.
The concentration reduction of 1 µg/m3 of PM2.5 would result in 7,785 ED visit cases averted for all ages and 5,937 hospital admissions for all SJV residents. The value of averting these adverse health outcomes was US$ 46,664,702.
Discussion
This is one of the first public health economics studies to estimate the healthcare and social costs of air pollution-associated asthma and upper respiratory infections (URIs). From the societal perspective and a prevalence approach, the estimated burden of exposures to O3, NO2, and PM2.5 background pollutant concentrations in asthma exacerbations and URI ED visits, and hospital admissions was valued at US$ 721,566,844 for the year 2016 in healthcare costs, missed school, productivity losses of parents, caretakers, and working-age adults, and the opportunity costs for older adults. The estimated burden of ED events attributed to the studied criteria pollutants for the whole SJV population was 129,025, and hospital admissions attributed were 82,082. Modeling marginal reductions in pollutant concentrations resulted in averting 21,786 ED adverse events and 19,328 hospitalizations for asthma and URIs. Averting these air pollution-related health outcomes would save an estimated US$ 137,171,890 in health care and social costs.
In a study conducted for the region from 2008,38 morbidity, in baseline years 2002–2004, was valued at US$ 32.64 million for ozone, and US$ 3.2 billion, in morbidity and mortality for PM2.5. The number of morbidity cases attributed to ground-level ozone and PM2.5 could have been underestimated due to the disease estimates extrapolated from non-SJV geographical areas and dissimilar periods. In addition, their study used the value of statistical life (VSL) to monetize premature mortality from exposure to PM2.5 which is a health endpoint that this study did not include. Also, the findings in this research differ from the US$ 193 million calculated for hospitalizations in selected California hospitals from 2005–2007.73 However, the methodology used in that study combined ED visits and hospitalizations into single events, despite the inclusion of additional health endpoints, and used linear proportional reductions to model the cost savings of hospitalizations when exposure to ground-level ozone and PM2.5 is decreased. In contrast, to calculate the cases attributed to pollution exposure, this study accounts for ED visits and hospitalizations separately to avoid duplication and used ß-value estimates from a regional epidemiological study which have been adjusted for meteorological factors, temporality, and seasonality to the nonlinearity of pollutant chemistry.28
The results of this study suggest the need for policies aimed at mitigating the harms of air pollution on the residents of the San Joaquin Valley, especially those with asthma. There are, in general, two approaches that can be adopted to mitigate the impacts of air pollution: masks and other types of air filtration systems that can remove the particles from the air, and societal-level policies that reduce the total amount of pollutants that get emitted.
The choice of policy measures must be evidence-based and cost-effective. Additionally, regulators, permitters, and public health agencies should comprehensively and continuously assess these public health strategies to ensure democratic, equitable, and systematic implementation in the SJV region, particularly for the most vulnerable and who are experiencing higher costs. This would also include evaluating the extent to which the public would be willing to pay for mitigation measures, whether they are formulated to prevent and control harm from air pollution or reduce the number of pollutants discharged into the air.
Future studies should use contingent valuation methods to explore the tradeoffs the public is willing to make and should include evaluating favorability for existing and potential air pollution control and mitigation strategies (ie, hybrid and electric vehicles concerns, information quality, directed costs, reduction of fireplaces, high-polluter regulation, zero-emissions zones, telecommuting, etc.) that have been implemented in the region and elsewhere to determine which ones are likely to be supported and result in behavior change.
One of the strengths of the study is the use of regional empirical health outcome data. Applying short-term concentration-response associations of an epidemiological study based on San Joaquin Valley (SJV) residents, the analysis modeled what the region may gain in averting adverse health outcomes and attendance to emergency departments (ED) and hospitalizations to receive treatment and care. Additionally, the use of CMS resource-based pricing utilizing DRGs reduces uncertainty compared to health economics studies that use provider charges or health insurance payments that do not reflect negotiated discounts by individual entities. Lastly, the stratification of age groups in the cost analysis is supported by evidence that children and the elderly are more susceptible to pollution exposure. Hence, children’s air pollution-related morbidity is not only costly in terms of health care but also resource-intense in social costs due to care, missed school, and productivity losses by parents and caretakers.
This study did not assess the quality and access to care for children, working adults, and the elderly in the SJV which could be of influence in the health endpoints included. It has been documented in the peer-reviewed literature that older adults are more likely to be underdiagnosed and undertreated during respiratory events, such as asthma.74–76 If this phenomenon affected the SJV, during the period of the study, then it could have resulted in an undercount of health outcomes for this age group.
Another strength of this study is the use of concentration-response functions per interquartile range measurements proceeding from the regulatory monitoring system in the region and of the same year as the health endpoints. This differs substantially from other studies that use mean concentrations which include the lower and highest levels, as well as health values decades older than the baseline years they measured.
Studies of cost estimation are helpful to assist decision-makers in formulating cost-effective policies to accelerate change in the region. In the present policy conditions, the SJV pollution attainment standards of 8-hour O3 and 24-hour PM2.5 are in extreme non-attainment and non-attainment respectively. As the exposure assessment study and the related value in economic costs in this analysis reflect, NO2 is associated with the highest healthcare and social costs despite being in criteria pollutant standard attainment status. Thus, this geographically remarkable air basin needs a swift and comprehensive public health approach to decarbonize its economy and mitigate the adverse health effects of anthropogenic air pollution.
Limitations
A limitation of this study is related to the lack of primary care data included in the exposure assessment which could have led to an underestimation of burden to the region’s residents and healthcare providers, and value estimates. Primary care data is difficult to access for research purposes and it could be a valuable effort to conduct a future exposure assessment study to study the association of major criteria pollutants conspicuous in the SJV and health outcomes.
Another limitation of the study is the restricted assessment of intangible costs for the elderly population similar to other studies in which days spent in the ED or hospitalized were valued as the opportunity costs of spending that time in other activities and attributed to the daily average social security retirement benefit. Monetizing the pain and suffering of people attending the ED or hospitalized for an asthma exacerbation is an underestimation of the costs of a social choice. Ostensibly, a best practice for health economists is to also evaluate the disutility of the health state changes to appropriately value pain and suffering attributed to the burden of toxic exposures or any illness.
Some economic studies have reflected on the appropriateness of using COI versus contingent valuation (CV) and willingness to pay or accept (WTP/WTA) methods to monetize the burden of diseases.38,77–81 However, the limitations on inclusiveness of existing CV and WTP studies available for this type of regional study applied to a region where there is a majority-minority racial/ethnic composition, would further add to the limitations of this study. Evidently, health economics has a lot more to do to include population-representative samples in instruments meant for resources and datasets in public health economic evaluations, which add to our recommendations for future research.
Conclusion
Air pollution is known as a negative externality of economic activity. This study estimated the monetized burden of three criteria pollutants O3, NO2, and PM2.5 in asthma exacerbations and upper respiratory infections emergency department visits, and hospitalizations for San Joaquin Valley (SJV) residents. This analysis is one of the first to utilize an association of exposure with a societal perspective and a prevalence approach to cost-of-illness studies to value the causal burden. What is notable is that the air pollution-related adverse health outcomes overburdening the SJV region, and its healthcare system, are broadly preventable.
Often recognized as one of the most polluted regions in the US, the SJV is at a juncture to protect public health by preventing adverse health outcomes associated with one of the main drivers of climate change, air pollution. From a health economics perspective, this study has furthered the evidence that air pollution is a negative externality that imposes substantial social, environmental, and healthcare costs on the region’s residents. This analysis also provides economic and health outcome evidence of the benefits of reducing air pollution in the geographically unique air basin of the SJV.
Since virtually every human activity produces air pollution, future research should focus on examining what air pollution control and mitigation measures would SJV residents support or oppose to inform public health agencies accountable for regulating air quality and encouraging behavior change to avoid ill health.
Data Sharing Statement
Data are available on request owing to privacy and ethical restrictions. The data presented in this study are available upon request from the corresponding authors. The data are not publicly available because of the confidentiality laws that protect patient-level data.
Ethics Approval
The study was conducted in accordance with the guidelines of the Declaration of Helsinki and approved by the Committee for the Protection of Human Subjects (CPHS) of the State of California Health and Human Services (CHHS) Agency protocol ID #2021-051 approved on 6/30/2021. Informed consent was waived by CPHS under common rule only and the study deemed minimal risk 45 CFR 46.116 (f), the approval was issued under CHHS Agency’s Federalwide Assurance #00000681. All methods were performed following the relevant guidelines and regulations.
Acknowledgments
We thank the California Department of Health Care Access and Information (HCAI), previously known as the OSHPD, for providing access to the datasets and assisting with the acquisition process.
Author Contributions
All authors made a significant contribution to the work reported, whether that is in the conception, study design, execution, acquisition of data, analysis and interpretation, or in all these areas; took part in drafting, revising or critically reviewing the article; gave final approval of the version to be published; have agreed on the journal to which the article has been submitted; and agree to be accountable for all aspects of the work.
Disclosure
The authors declare that they have no conflicts of interest in this work.
References
1. Kampa M, Castanas E. Human health effects of air pollution. Environ Pollut. 2008;151:362–367. doi:10.1016/j.envpol.2007.06.012
2. Kelly FJ, Fussell JC. Air pollution and public health: emerging hazards and improved understanding of risk. Environ Geochem Health. 2015;37(4):631–649. doi:10.1007/s10653-015-9720-1
3. Billionnet C, Sherrill D, Annesi-Maesano I. Estimating the health effects of exposure to multi-pollutant mixture. Ann Epidemiol. 2012;22(2):2. doi:10.1016/j.annepidem.2011.11.004
4. Landrigan PJ, Schechter CB, Lipton JM, Fahs MC, Schwartz J. Environmental pollutants and disease in American children: estimates of morbidity, mortality, and costs for lead poisoning, asthma, cancer, and developmental disabilities. Environ Health Perspect. 2002;110(7):721–728. doi:10.1289/ehp.02110721
5. American Lung Association. State of the Air 2019. Washington DC; 2019. Available form: www.stateoftheair.org.
6. Latza U, Gerdes S, Baur X. Effects of nitrogen dioxide on human health: systematic review of experimental and epidemiological studies conducted between 2002 and 2006. Int J Hyg Environ Health. 2009;212(3):271–287. doi:10.1016/j.ijheh.2008.06.003
7. EPA. Integrated Science Assessment for Particulate Matter, US EPA. Research Triangle Park, NC; 2019. Available form: https://www.epa.gov/isa/integrated-science-assessment-isa-particulate-matter.
8. Nurmagambetov T, Kuwahara R, Garbe P. The Economic Burden of Asthma in the United States, 2008-2013. Ann Am Thorac Soc. 2018;15(3):348–356. doi:10.1513/ANNALSATS.201703-259OC
9. World Health Organization. The Economic Burden of Lung Disease.; 2016.
10. Selin NE, Wu S, Nam KM, et al. Global health and economic impacts of future ozone pollution. Environ Res Lett. 2009;4(4):044014. doi:10.1088/1748-9326/4/4/044014
11. Etchie TO, Sivanesan S, Adewuyi GO, et al. The health burden and economic costs averted by ambient PM2.5 pollution reductions in Nagpur, India. Environ Int. 2017;102:145–156. doi:10.1016/j.envint.2017.02.010
12. UN. Five dangerous pollutants you are breathing in every day. United Nations Environ Program; 2021.
13. England PH Estimation of Costs to the NHS and Social Care Due to the Health Impacts of Air Pollution. London, UK; 2018. Available form: https://assets.publishing.service.gov.uk/government/uploads/system/uploads/attachment_data/file/708855/Estimation_of_costs_to_the_NHS_and_social_care_due_to_the_health_impacts_of_air_pollution_-_summary_report.pdf.
14. Zmirou ADFBCBJD D. Health Effects Costs of Particulate Air Pollution. J Occup. 1999;41(10):847–856.
15. El-Fadel M, Massoud M Particulate Matter in Urban Areas: health-Based Economic Assessment; 2000. Available form: https://ac.els-cdn.com/S0048969700005039/1-s2.0-S0048969700005039-main.pdf?_tid=b1242171-3ac3-4f8f-9710-b7df333966b0&acdnat=1541702241_ed1f30da42200e970e24d820fc47ac6b.
16. The World Bank. The Cost of Air Pollution Strengthening the Economic Case for Action. Washington, DC; 2016. Available form: http://documents.worldbank.org/curated/en/781521473177013155/pdf/108141-REVISED-Cost-of-PollutionWebCORRECTEDfile.pdf.
17. Patankar AM, Trivedi PL, Somaiya KJ. Monetary burden of health impacts of air pollution in Mumbai, India: implications for public health policy. Public Health. 2011;125:157–164. doi:10.1016/j.puhe.2010.11.009
18. Niu Y, Chen R, Kan H. Ambient Air Pollution and Health Impact in China. In: Advances in Experimental Medicine and Biology. Singapore: Springer Nature;2017:233–244. doi:10.1007/978-981-10-5657-4_10
19. Zhu B, Pang R, Chevallier J, Wei Y-M, Vo D-T. Including intangible costs into the cost-of-illness approach: a method refinement illustrated based on the PM2.5 economic burden in China. Eur J Heal Econ. 2018. doi:10.1007/s10198-018-1012-0
20. Yale School of Forestry & Environmental Studies. Transportation Replaces Power in U.S. as Top Source of CO2 Emissions - Yale E360. Yale Environment. Available form: https://e360.yale.edu/digest/transportation-replaces-power-in-u-s-as-top-source-of-co2-emissions.
21. Brandt S, Perez L, Künzli N, et al. Cost of near-roadway and regional air pollution-attributable childhood asthma in Los Angeles County. J Allergy Clin Immunol. 2014;134(5):1028–1035. doi:10.1016/j.jaci.2014.09.029
22. Brandt S, Dickinson B, Ghosh R, et al. Costs of coronary heart disease and mortality associated with near-roadway air pollution. Sci Total Environ. 2017;601-602:391–396. doi:10.1016/j.scitotenv.2017.05.073
23. Barboza T San Joaquin Valley officials fight with EPA over air quality - la times. Los Angeles Times. Available form: http://articles.latimes.com/2013/dec/22/local/la-me-valley-air-20131223.
24. Gharibi H, Entwistle MR, Ha S, et al. Ozone pollution and asthma emergency department visits in the Central Valley, California, USA, during June to September of 2015: a time-stratified case-crossover analysis. J Asthma. 2018:1–12. doi:10.1080/02770903.2018.1523930
25. Meng -Y-Y, Rull RP, Wilhelm M, Lombardi C, Balmes J, Ritz B. Outdoor air pollution and uncontrolled asthma in the San Joaquin Valley, California. J Epidemiol Community Heal. 2010;64(2):142–147. doi:10.1136/jech.2009.083576
26. Cisneros R, Gharibi H, Entwistle MR, Tavallali P, Singhal M, Schweizer D. Nitrogen dioxide and asthma emergency department visits in California, USA during cold season (November to February) of 2005 to 2015: a time-stratified case-crossover analysis. Sci Total Environ. 2021;754:142089. doi:10.1016/J.SCITOTENV.2020.142089
27. Tavallali P, Gharibi H, Singhal M, Schweizer D, Cisneros R. A multi-pollutant model: a method suitable for studying complex relationships in environmental epidemiology. Air Qual Atmos Heal. 2020;13(6):645–657. doi:10.1007/S11869-020-00829-3/FIGURES/6
28. Zarate-Gonzalez G, Cisneros R, Gharibi H, Brown P. Air pollution related adverse respiratory health outcomes in California’s San Joaquin Valley: evidence from 2016 linked emergency department and hospital records. Environ Res Heal. 2024;2(2):025003. doi:10.1088/2752-5309/ad268a
29. UCLA Center for Health Policy Research. AskCHIS. California Health Interview Survey. Available form: https://ask.chis.ucla.edu/AskCHIS/tools/_layouts/AskChisTool/home.aspx#/results.
30. American Lung Association. State of the Air 2023. Chicago, IL; 2023.
31. PPIC. 2020 Census: counting the San Joaquin Valley - Public Policy Institute of California. Public Policy Institute of California. Available form: https://www.ppic.org/blog/2020-census-counting-The-san-joaquin-valley/.
32. Jones B, Duncan K, Elkind EN, Hanson M The Economic Impacts of California Major Climate Programs on the San Joaquin Valley. Berkeley, CA; 2017. Available form: http://laborcenter.berkeley.edu/pdf/2017/economic-impacts-climate-programs-san-joaquin-valley.pdf.
33. Pat Brown Institute. The South San Joaquin Valley: the State of the Region. Los Angeles, CA; 2014. Available form: www.BeaconEcon.com.
34. Schoups G, Hopmans JW, Young CA, et al. Sustainability of irrigated agriculture in the San Joaquin Valley, California. Proc Natl Acad Sci U S A. 2005;102(43):15352–15356. doi:10.1073/pnas.0507723102
35. Cisneros R, Brown P, Cameron L, et al. Understanding Public Views about Air Quality and Air Pollution Sources in the San Joaquin Valley, California. J Environ Public Health. 2017;2017:1–7. doi:10.1155/2017/4535142
36. Sengupta S Wildfire Smoke Is Poisoning California’s Kids. Some Pay a Higher Price. The New York Times. Available form: https://www.nytimes.com/interactive/2020/11/26/climate/california-smoke-children-health.html.
37. Navarro KM, Cisneros R, O’Neill SM, Schweizer D, Larkin NK, Balmes JR. Air-Quality Impacts and Intake Fraction of PM 2.5 during the 2013 Rim Megafire. Environ Sci Technol. 2016;50(21):11965–11973. doi:10.1021/acs.est.6b02252
38. Hall JV, Brajer V, Lurmann FW. Measuring the gains from improved air quality in the San Joaquin Valley. J Environ Manage. 2008;88:1003–1015. doi:10.1016/j.jenvman.2007.05.002
39. CDC. Economic Impact Analysis, Cost of Illness.; 2017. Available form: https://www.cdc.gov/dhdsp/programs/spha/economic_evaluation/docs/podcast_ii.pdf.
40. Schultz TW. American Economic Association Investment in Human Capital. Am Econ Assoc. 1961;51(5):1035–1039.
41. Becker GS. Human Capital: A Theoretical and Empirical Analysis, with Special Reference to Education.
42. Jo C. Cost-of-illness studies: concepts, scopes, and methods. Clin Mol Hepatol. 2014;20(4):327–337. doi:10.3350/cmh.2014.20.4.327
43. Byford S, Torgerson DJ, Raftery J. Economic note: cost of illness studies. BMJ. 2000;320(7245):1335.
44. Ament A, Evers S. Cost of illness studies in health care: a comparison of two cases. Health Policy (New York). 1993;26(1):29–42. doi:10.1016/0168-8510(93)90076-2
45. National Centers for Environmental Information. Monthly Wildfires Report for Annual 2016. San Diego, CA; 2017. Available form: https://www.ncei.noaa.gov/access/monitoring/monthly-report/fire/201613.
46. Hirsch JA, Nicola G, McGinty G, et al. ICD-10: history and Context. AJNR Am J Neuroradiol. 2016;37(4):596. doi:10.3174/AJNR.A4696
47. Kattan M, Stearns SC, Crain EF, et al. Cost-effectiveness of a home-based environmental intervention for inner-city children with asthma. J Allergy Clin Immunol. 2005;116(5):1058–1063. doi:10.1016/J.JACI.2005.07.032
48. Moonie SA, Sterling DA, Figgs L, Castro M. Asthma status and severity affects missed school days. J Sch Health. 2006;76(1):18–24. doi:10.1111/J.1746-1561.2006.00062.X
49. UCLA. CHIS. UCLA Center for Health Policy Research. Available form: https://healthpolicy.ucla.edu/chis/about/Pages/about.aspx.
50. Van Der Zee SC, Hoek G, Boezen MH, Schouten JP, Van Wijnen JH, Brunekreef B. Acute effects of air pollution on respiratory health of 50-70 yr old adults. Eur Respir J. 2000;15(4):700–709. doi:10.1034/J.1399-3003.2000.15D13.X
51. Department of Finance. Population Estimates for Cities, Counties, and the State, 2011-2020 with 2010 Census Benchmark. Sacramento, CA, USA; 2021. Available form: https://dof.ca.gov/forecasting/demographics/estimates/e-4-population-estimates-for-cities-counties-and-The-state-2011-2020-with-2010-census-benchmark-new/.
52. Cole P, MacMahon B. Attributable risk percent in case-control studies. Br J Prev Soc Med. 1971;25(4):242–244. doi:10.1136/jech.25.4.242
53. Hoffman JIE. Odds Ratio, Relative Risk, Attributable Risk, and Number Needed to Treat. Basic Biostat Med Biomed Pract. 2019;295–310. doi:10.1016/B978-0-12-817084-7.00020-6
54. Zhang J, Yu KF. What’s the Relative Risk?: a Method of Correcting the Odds Ratio in Cohort Studies of Common Outcomes. JAMA. 1998;280(19):1690–1691. doi:10.1001/JAMA.280.19.1690
55. Shrier I, Steele R. Understanding the Relationship Between Risks and Odds Ratios. J Sport Med. 2006;16(2):107–110.
56. Newsom R. Stata module to compute population attributable fractions for case-control and survival studies. February. 2023.
57. Stata V17. Stata. April 2021. Available form: https://www.stata-press.com/data/r17/.
58. CMS. Inpatient Charge Data FY 2016. CMS.gov. Available form: https://www.cms.gov/Research-Statistics-Data-and-Systems/Statistics-Trends-and-Reports/Medicare-Provider-Charge-Data/Inpatient2016.
59. Mcneil BJ. Hospital Response to DRG-Based Prospective Payment. Med Decis Mak. 1985;5(1):15–21.
60. Harada N, Kominski G, Shoshanna S. Development of a Resource-Based Patient Classification Scheme for Rehabilitation. Inquiry. 1993;30(1):54–63.
61. Caputi MA, Heiss WA. The DRG Revolution. Health Soc Work. 1984;9(1):5–12. doi:10.1093/HSW/9.1.5
62. Zhang L, Sun L. Impacts of Diagnosis-Related Groups Payment on the Healthcare Providers’ Behavior in China: a Cross-Sectional Study Among Physicians. Risk Manag Healthc Policy. 2021;14:2263. doi:10.2147/RMHP.S308183
63. Zou K, Li HY, Zhou D, Liao ZJ. The effects of diagnosis-related groups payment on hospital healthcare in China: a systematic review. BMC Health Serv Res. 2020;20(1):1–11. doi:10.1186/S12913-020-4957-5/TABLES/3
64. Barouni M, Ahmadian L, Anari HS, Mohsenbeigi E. Challenges and Adverse Outcomes of Implementing Reimbursement Mechanisms Based on the Diagnosis-Related Group Classification System: a systematic review. Sultan Qaboos Univ Med J. 2020;20(3):e260. doi:10.18295/SQUMJ.2020.20.03.004
65. Mihailovic N, Kocic S, Jakovljevic M. Review of Diagnosis-Related Group-Based Financing of Hospital Care. Heal Serv Res Manag Epidemiol. 2016;3. doi:10.1177/2333392816647892
66. Juniper EF, Wisniewski ME, Cox FM, Emmett AH, Nielsen KE, O’Byrne PM. Relationship between quality of life and clinical status in asthma: a factor analysis. Eur Respir J. 2004;23(2):287–291. doi:10.1183/09031936.04.00064204
67. Cacace M, Schmid A. The role of diagnosis related groups (DRGs) in healthcare system convergence. BMC Health Serv Res. 2009;9(Suppl 1):A5. doi:10.1186/1472-6963-9-S1-A5
68. Epocrates. Drug Formulary Lookup. Clinical Information and Drug Formularies; 2002.
69. California EDD. Average Weekly Earnings, Annual Average. Wages by Occupation and Industry; 2016.
70. Ed-Data Education Data Partnership. General Fund Revenues: Financial Data. State Summary of California Public Schools; 2015.
71. U.S. Bureau of Labor Statistics. BLS Data Finder. 2016 Weekly and Hourly Earnings Data; 2016.
72. Social Security Administration. Fast Facts & Figures About Social Security. Benefit Payments as a Percentage of Gross Domestic Product, 2015–2016; 2015.
73. Romley JA, Hackbarth A, Goldman DP. The Impact of Air Quality on Hospital Spending. Rand Heal Q. 2012;2(3):6.
74. Yáñez A, Cho SH, Soriano JB, et al. Asthma in the elderly: what we know and what we have yet to know. World Allergy Organ J. 2014;7(1). doi:10.1186/1939-4551-7-8
75. Gillman A, Douglass JA. Asthma in the elderly. Asia Pac Allergy. 2012;2(2):101. doi:10.5415/APALLERGY.2012.2.2.101
76. Bauer BA, Reed CE, Yunginger JW, Wollan PC, Silverstein MD. Incidence and Outcomes of Asthma in the Elderly: a Population-Based Study in Rochester, Minnesota. Chest. 1997;111(2):303–310. doi:10.1378/CHEST.111.2.303
77. Brandt S, Vásquez Lavín F, Hanemann M. Contingent valuation scenarios for chronic illnesses: the case of childhood asthma. Value Health. 2012;15(8):1077–1083. doi:10.1016/J.JVAL.2012.07.006
78. Navrud S. Valuing health impacts from air pollution in Europe. Environ Resour Econ. 2001;20(4):305–329. doi:10.1023/A:1013099120078/METRICS
79. Larg A, Moss JR. Cost-of-illness studies: a guide to critical evaluation. Pharmacoeconomics. 2011;29(8):653–671. doi:10.2165/11588380-000000000-00000
80. Attari SZ, Schoen M, Davidson CI, et al. Preferences for change: do individuals prefer voluntary actions, soft regulations, or hard regulations to decrease fossil fuel consumption? Ecol Econ. 2009;68(6):1701–1710. doi:10.1016/J.ECOLECON.2008.10.007
81. Zhang M, Song Y, Cai X, Zhou J. Economic assessment of the health effects related to particulate matter pollution in 111 Chinese cities by using economic burden of disease analysis. J Environ Manage. 2008;88:947–954. doi:10.1016/j.jenvman.2007.04.019
 © 2024 The Author(s). This work is published and licensed by Dove Medical Press Limited. The
full terms of this license are available at https://www.dovepress.com/terms
and incorporate the Creative Commons Attribution
- Non Commercial (unported, 3.0) License.
By accessing the work you hereby accept the Terms. Non-commercial uses of the work are permitted
without any further permission from Dove Medical Press Limited, provided the work is properly
attributed. For permission for commercial use of this work, please see paragraphs 4.2 and 5 of our Terms.
© 2024 The Author(s). This work is published and licensed by Dove Medical Press Limited. The
full terms of this license are available at https://www.dovepress.com/terms
and incorporate the Creative Commons Attribution
- Non Commercial (unported, 3.0) License.
By accessing the work you hereby accept the Terms. Non-commercial uses of the work are permitted
without any further permission from Dove Medical Press Limited, provided the work is properly
attributed. For permission for commercial use of this work, please see paragraphs 4.2 and 5 of our Terms.
Recommended articles
Avoidance of Inhaled Pollutants and Irritants in Asthma from a Salutogenic Perspective
Lira GVDAG, Silva GAPD, Bezerra PGDM, Sarinho ESC
Journal of Asthma and Allergy 2024, 17:237-250
Published Date: 19 March 2024
Healthcare Resource Utilization Associated with Intermittent Oral Corticosteroid Prescribing Patterns in Asthma
Tran TN, Heatley H, Bourdin A, Menzies-Gow A, Jackson DJ, Maslova E, Chapaneri J, Henley W, Carter V, Chan JSK, Ariti C, Haughney J, Price D
Journal of Asthma and Allergy 2024, 17:573-587
Published Date: 21 June 2024
Economic Evaluation of Mepolizumab as Add-on Therapy to Standard Care in Severe Eosinophilic Asthma: A Cost-Effectiveness Analysis in Colombia
Buendia JA, Acuna-Cordero R, Rodriguez-Martinez CE
Journal of Asthma and Allergy 2025, 18:211-218
Published Date: 17 February 2025
Impact of Asthma Severity and Exacerbation Frequency on Burden of Disease Related Costs in Finland
Lassenius MI, Aakko J, Hallberg S, Dillon M, Nieminen K, Kankaanranta H, Viinanen A, Kauppi P, Lehtimäki L
Journal of Asthma and Allergy 2025, 18:1425-1437
Published Date: 23 October 2025