Back to Journals » ClinicoEconomics and Outcomes Research » Volume 11
Cost-effectiveness model for a hypothetical monotherapy vs standard of care in adult patients with treatment-resistant depression
Authors Wang ST ![]() , Anderson IM
, Anderson IM ![]() , Mitchell D
, Mitchell D ![]() , Johnson SJ, Shiozawa A
, Johnson SJ, Shiozawa A ![]()
Received 28 July 2018
Accepted for publication 3 January 2019
Published 14 March 2019 Volume 2019:11 Pages 257—270
DOI https://doi.org/10.2147/CEOR.S181718
Checked for plagiarism Yes
Review by Single anonymous peer review
Peer reviewer comments 2
Editor who approved publication: Prof. Dr. Dean Smith
Si-Tien Wang,1 Ian M Anderson,2 Dominic Mitchell,3 Scott J Johnson,1 Aki Shiozawa4,5
1Medicus Economics, LLC, Boston, MA, USA; 2Neuroscience and Psychiatry Unit, University of Manchester and Manchester Academic Health Science Centre, Manchester, UK; 3Medicus Economics, LLC, Repentigny, QC, Canada; 4Department of Health Policy and Management, Johns Hopkins Bloomberg School of Public Health, Baltimore, MD, USA; 5Global Outcome Research, Takeda Pharmaceuticals International, Inc., Deerfield, IL, USA
Background: Patients with treatment-resistant major depressive disorder (TRD) have limited treatment options. We developed an early stage cost-effectiveness model of TRD to explore the potential value of a hypothetical monotherapy relative to the standard of care (SOC). The relative impacts of the monotherapy’s three differentiating features over SOC are explored: efficacy advantage, tolerability advantage, and price premium.
Methods: We adapted an existing economic model of TRD to evaluate the cost-effectiveness of a hypothetical monotherapy for TRD with a 25% efficacy advantage, a 10% tolerability advantage, and a 50% price premium over SOC (selective serotonin reuptake inhibitor plus atypical antipsychotics [SSRI + AAP]). The model is a hybrid of a decision tree that captures patients’ outcomes after an 8-week acute treatment phase and a Markov model that simulates patients’ depression course through a 10-month maintenance phase. Sensitivity (deterministic and probabilistic) and scenario analyses were conducted to characterize the relative impacts of the monotherapy’s three differentiating features over SOC.
Results: Over the 12-month time horizon, the hypothetical monotherapy is shown to dominate SOC; it generates lower costs and higher quality-adjusted life years in comparison to SSRI + AAP. Sensitivity and scenario analyses showed that this dominance depends largely on the monotherapy’s efficacy and tolerability advantages over SOC. Specifically, a monotherapy with ≥ 12% efficacy or ≥70% tolerability advantage (and a 50% price premium) will always be superior to SSRI + AAP. Between these two extremes, most profiles, nonetheless, generate incremental cost-utility ratios for the monotherapy, which fall below common payer willingness-to-pay thresholds.
Conclusion: Our adaptation of an existing economic model of TRD provides a flexible platform for researchers to evaluate the efficacy/tolerability improvements required for a successful new TRD product and for decision-makers to assess the cost-effectiveness impact of uncertainties inherent in early stage product development in TRD.
Keywords: treatment-resistant depression, cost-effectiveness, pharmacotherapy
Introduction
Depression is ranked among the top five contributors to the global burden of disease and, by 2030, is predicted to be the leading cause of disability in high-income countries.1 Antidepressants are often the first-line treatment for depression, and the number of antidepressant agents prescribed and dispensed in England has more than doubled in the last decade.2 In 2015, there were 61 million antidepressant agents prescribed, costing the National Health Service (NHS) an estimated £780,000 per day.2
Despite their widespread use, there is evidence that antidepressants are not effective for many patients with depression, leading to low rates of response and high frequencies of relapse. Among patients who do not respond, those who have received an adequate dose and duration of treatment can be considered to have treatment-resistant depression (TRD), although definitions vary as to the number of failed treatments required.3 The STAR*D (Sequenced Treatment Alternatives to Relieve Depression) study from the United States found that 36.8% of patients with nonpsychotic major depressive disorder (MDD) responded fully to initial antidepressant therapy, and 48.6% experienced 50% or more reduction in depressive symptoms, with respective values of 30.6% and 28.5% after a second antidepressant.4,5 In patients on antidepressants in primary care in the United Kingdom, the prevalence of TRD, defined as those who scored ≥14 on the Beck Depression Inventory and had taken antidepressants for at least 6 weeks at an adequate dose, was found to be 55% (95% CI =53%–58%).6
TRD is associated with considerable patient and economic burden.7,8 In the United Kingdom, in 2009/2010, 12% of all depressed patients were considered to have TRD, presenting an annual total cost of £3.9 billion; 54% of the total cost was accounted for by lost employment and informal care costs, and 26% of the total cost was accounted for by formal service and treatment costs.9
Recently, several potential therapies for TRD have emerged, starting with the discovery of the antidepressant effects of ketamine, and followed by a renewed interest in antidepressant drugs with novel mechanisms of action (eg, esketamine, rapastinel, ALKS-5461 [combination of buprenorphine and samidorphan], and scopolamine).10,11 However, the long-term benefits and costs of these drugs are unknown, and there remains an unmet need for effective new therapies for patients with TRD.
Increasingly, prioritization of research on treatment interventions is being addressed with value-of-information (VOI) analysis to inform clinical or public health decision-making by assessing whether a new technology should be approved based on existing evidence or whether additional research should be conducted to reduce uncertainty. The VOI approach incorporates an economic model that is used to evaluate the relative value for money of developing an early stage product according to its expected clinical benefits.12 The output of the economic model is used to inform research recommendations. A VOI analysis framework has been used in the United Kingdom by the National Institute for Health and Care Excellence for prioritization of research on screening and treatment interventions.13
The aim of the present study was to develop an early stage cost-effectiveness model that can be used to assess the value of investing resources in the provision of new therapies in TRD. The objective was to estimate the cost-effectiveness of a hypothetical TRD monotherapy (defined as any therapy being developed for TRD) relative to standard of care (SOC) (selective serotonin reuptake inhibitors [SSRIs] with atypical antipsychotic [AAP] drugs [SSRI + AAP]) in the management of patients with TRD.14,15 The outcome will be an economic model that can be incorporated into a VOI framework to inform research recommendations in TRD.
Materials and methods
The model
The present model was adapted from a model developed by Edwards et al.16 Briefly, the economic model in this study is a hybrid of two distinct components: a decision tree that simulates the outcomes of an 8-week acute treatment phase and a Markov model that captures the experience of patients (ie, treatment discontinuation, relapse, and full and partial remission) through a maintenance phase over the remainder of a 1-year total time horizon. Due to lack of long-term comparative clinical data, transitions between health states within the Markov component of the model are assumed to be independent of treatment.16
Patients with TRD enter the decision tree component of the model upon initiation of acute treatment. After 4 weeks, patients are exposed to risk of treatment discontinuation. For simplicity, reasons for discontinuation are not distinguished in the model. After another 4 weeks of acute treatment, patients, stratified by whether treatment was discontinued, enter one of the following health states: full remission, partial remission, or in episode. These health states are defined by patients’ total Montgomery-Åsberg Depression Rating Scale (MADRS) score at the end of the acute treatment phase.17 For the base case, “full remission” is defined as a total MADRS score of ≤10, “partial remission” is defined as a total MADRS score of >10 and ≤16, and “in episode” is defined as a total MADRS score of >16. A schematic of the decision tree component of the model is presented in Figure 1.
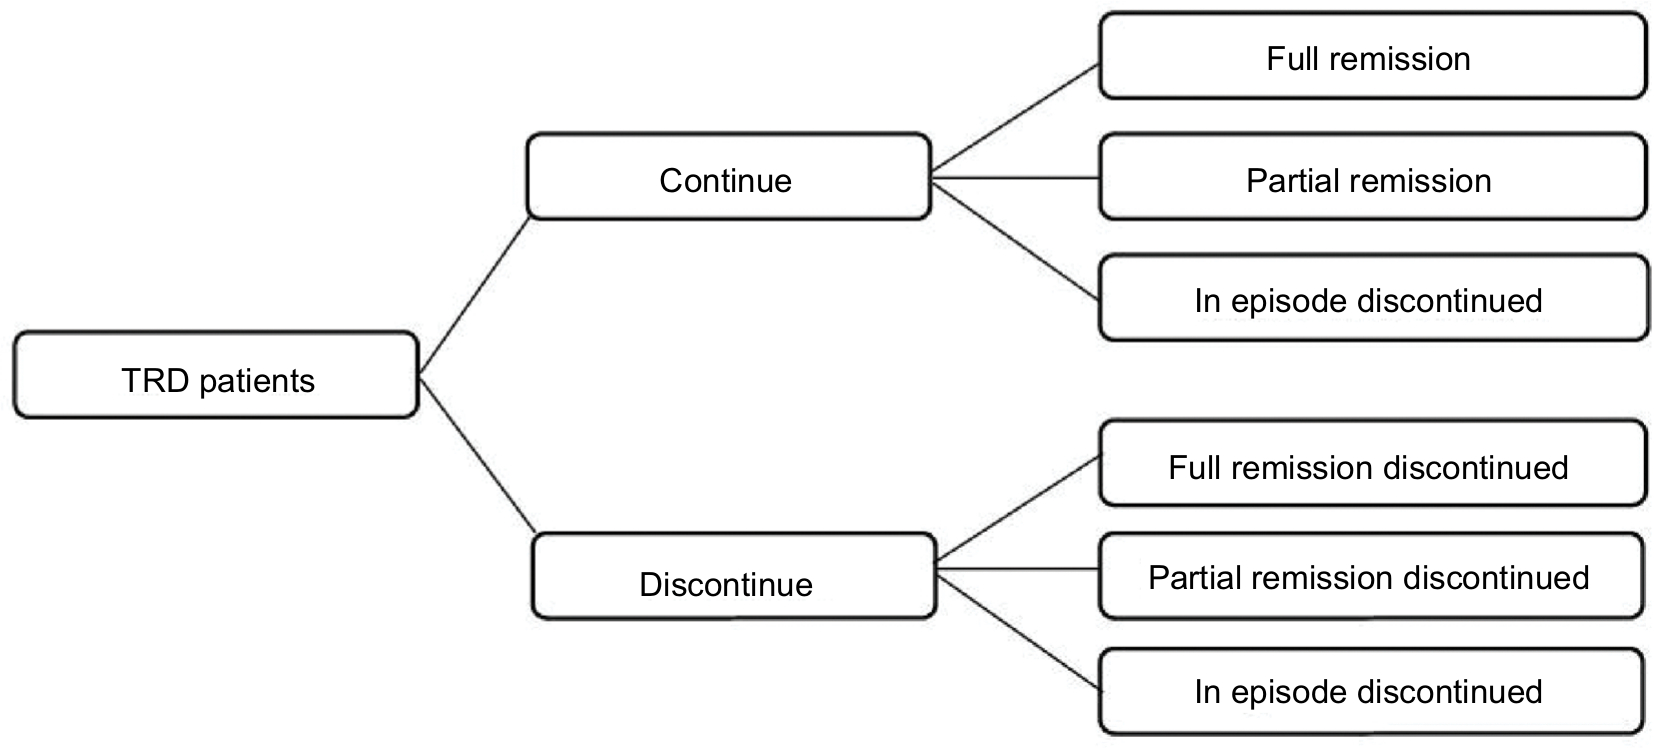 | Figure 1 Decision tree component of the model. Abbreviation: TRD, treatment-resistant depression. |
Continuing from the acute treatment phase, patients transition into the Markov component of the model which captures a maintenance phase made up of 10 months of maintenance treatment.16 Depending on their health state at the end of the acute treatment phase, patients enter the Markov model in one of five health states: “full remission” (with and without discontinuation), “partial remission” (with and without discontinuation), and “in episode discontinued” (all patients remaining in episode are assumed to discontinue treatment). In addition, the Markov model includes a “relapse” health state that captures patients whose total MADRS score increased to a fully symptomatic level (>16) after having achieved a lower score. A schematic of the Markov component of the model is presented in Figure 2.
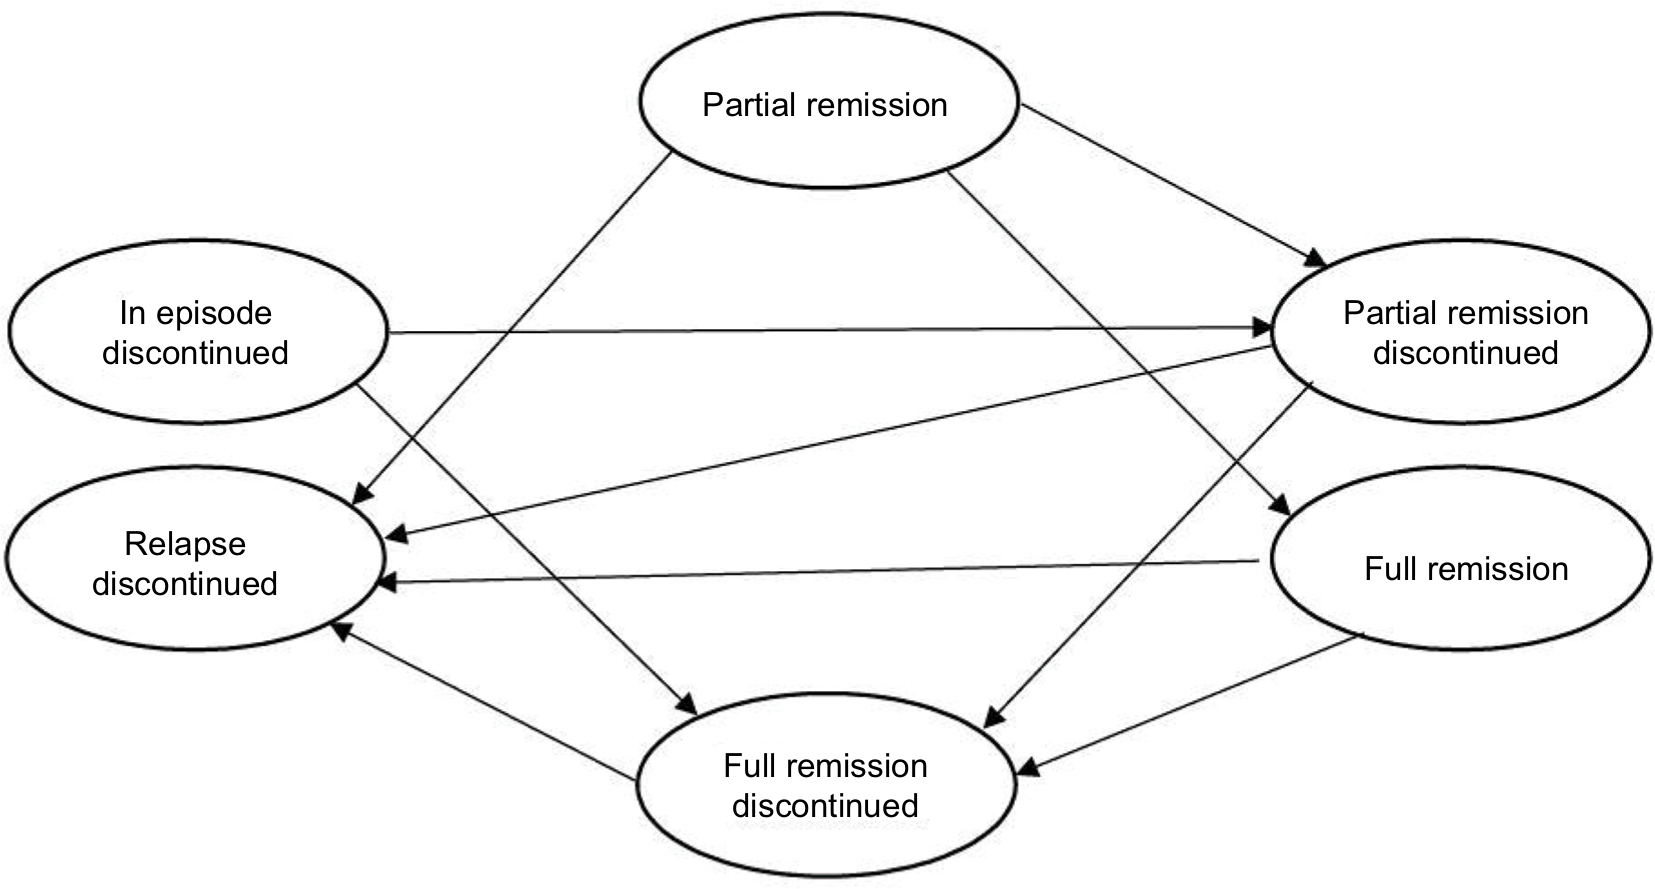 | Figure 2 Markov component of the model. Note: For all health states, patients can also remain in their current health state (circular arrows for remaining in state are not illustrated). |
Within the Markov model, patients may remain “in state” or move to other health states for 10 months, in cycles of 2 months, chosen to represent the usual length of a treatment course.16 The possible transitions between health states are illustrated by the arrows in Figure 2. Patients who achieve full remission face the risk of relapse (and transition to “relapse”) or, if they have not done so already, transition to maintenance treatment discontinuation (and transition to “full remission discontinued”). Patients who achieve partial remission may go on to achieve full remission (and transition to “full remission” or “full remission discontinued”, depending on their treatment status) or face the risk of relapse (and transition to “relapse”) or, if they have not done so already, maintenance treatment discontinuation (and transition to “partial remission discontinued”). Patients who remain in their MDD episode, irrespective of whether they completed a full 8-week course of acute treatment, are assumed to discontinue their initial treatment due to lack of efficacy, and instead receive a standard package of care. Despite being off their initial treatment, a proportion of these patients are assumed to improve clinically and transition to “partial remission discontinued” or “full remission discontinued”.16
Patients who experience MDD relapse, like patients who remain in their MDD episode, are assumed to discontinue their initial treatment due to lack of efficacy, and instead receive a standard package of care. Unlike “in episode discontinued”, however, “relapse discontinued” is assumed to be an absorbing state, such that patients entering this state do not experience any further transitions and remain “in state” for the duration of the model.16
The model was constructed in Microsoft Excel (Microsoft Corporation, Redmond, WA, USA).
Patient population
The patient population consists of adults with TRD, defined as nonresponse to two or more adequate courses of consecutive antidepressant treatment in a single MDD episode.
Intervention and comparator
The model comparator is SSRI + AAP, the strategy with best evidence for efficacy in TRD.14,15 Inputs specific to this comparator are obtained from Edwards et al,16 which compared SSRI + AAP vs SSRI + lithium, and updated as applicable (eg, drug doses, shares, and prices). For the intervention, the model assumes a hypothetical monotherapy with 25% (varied 0%–50%) efficacy advantage, 10% (varied 0%–20%) tolerability advantage, and 50% (varied 0%–100%) price premium over the comparator SSRI + AAP.
Model inputs
Treatment-specific and treatment-unspecific inputs in the model are summarized in Tables 1 and 2, respectively, along with details of their variation in deterministic sensitivity analysis (DSA) and probabilistic sensitivity analysis (PSA) and sources.
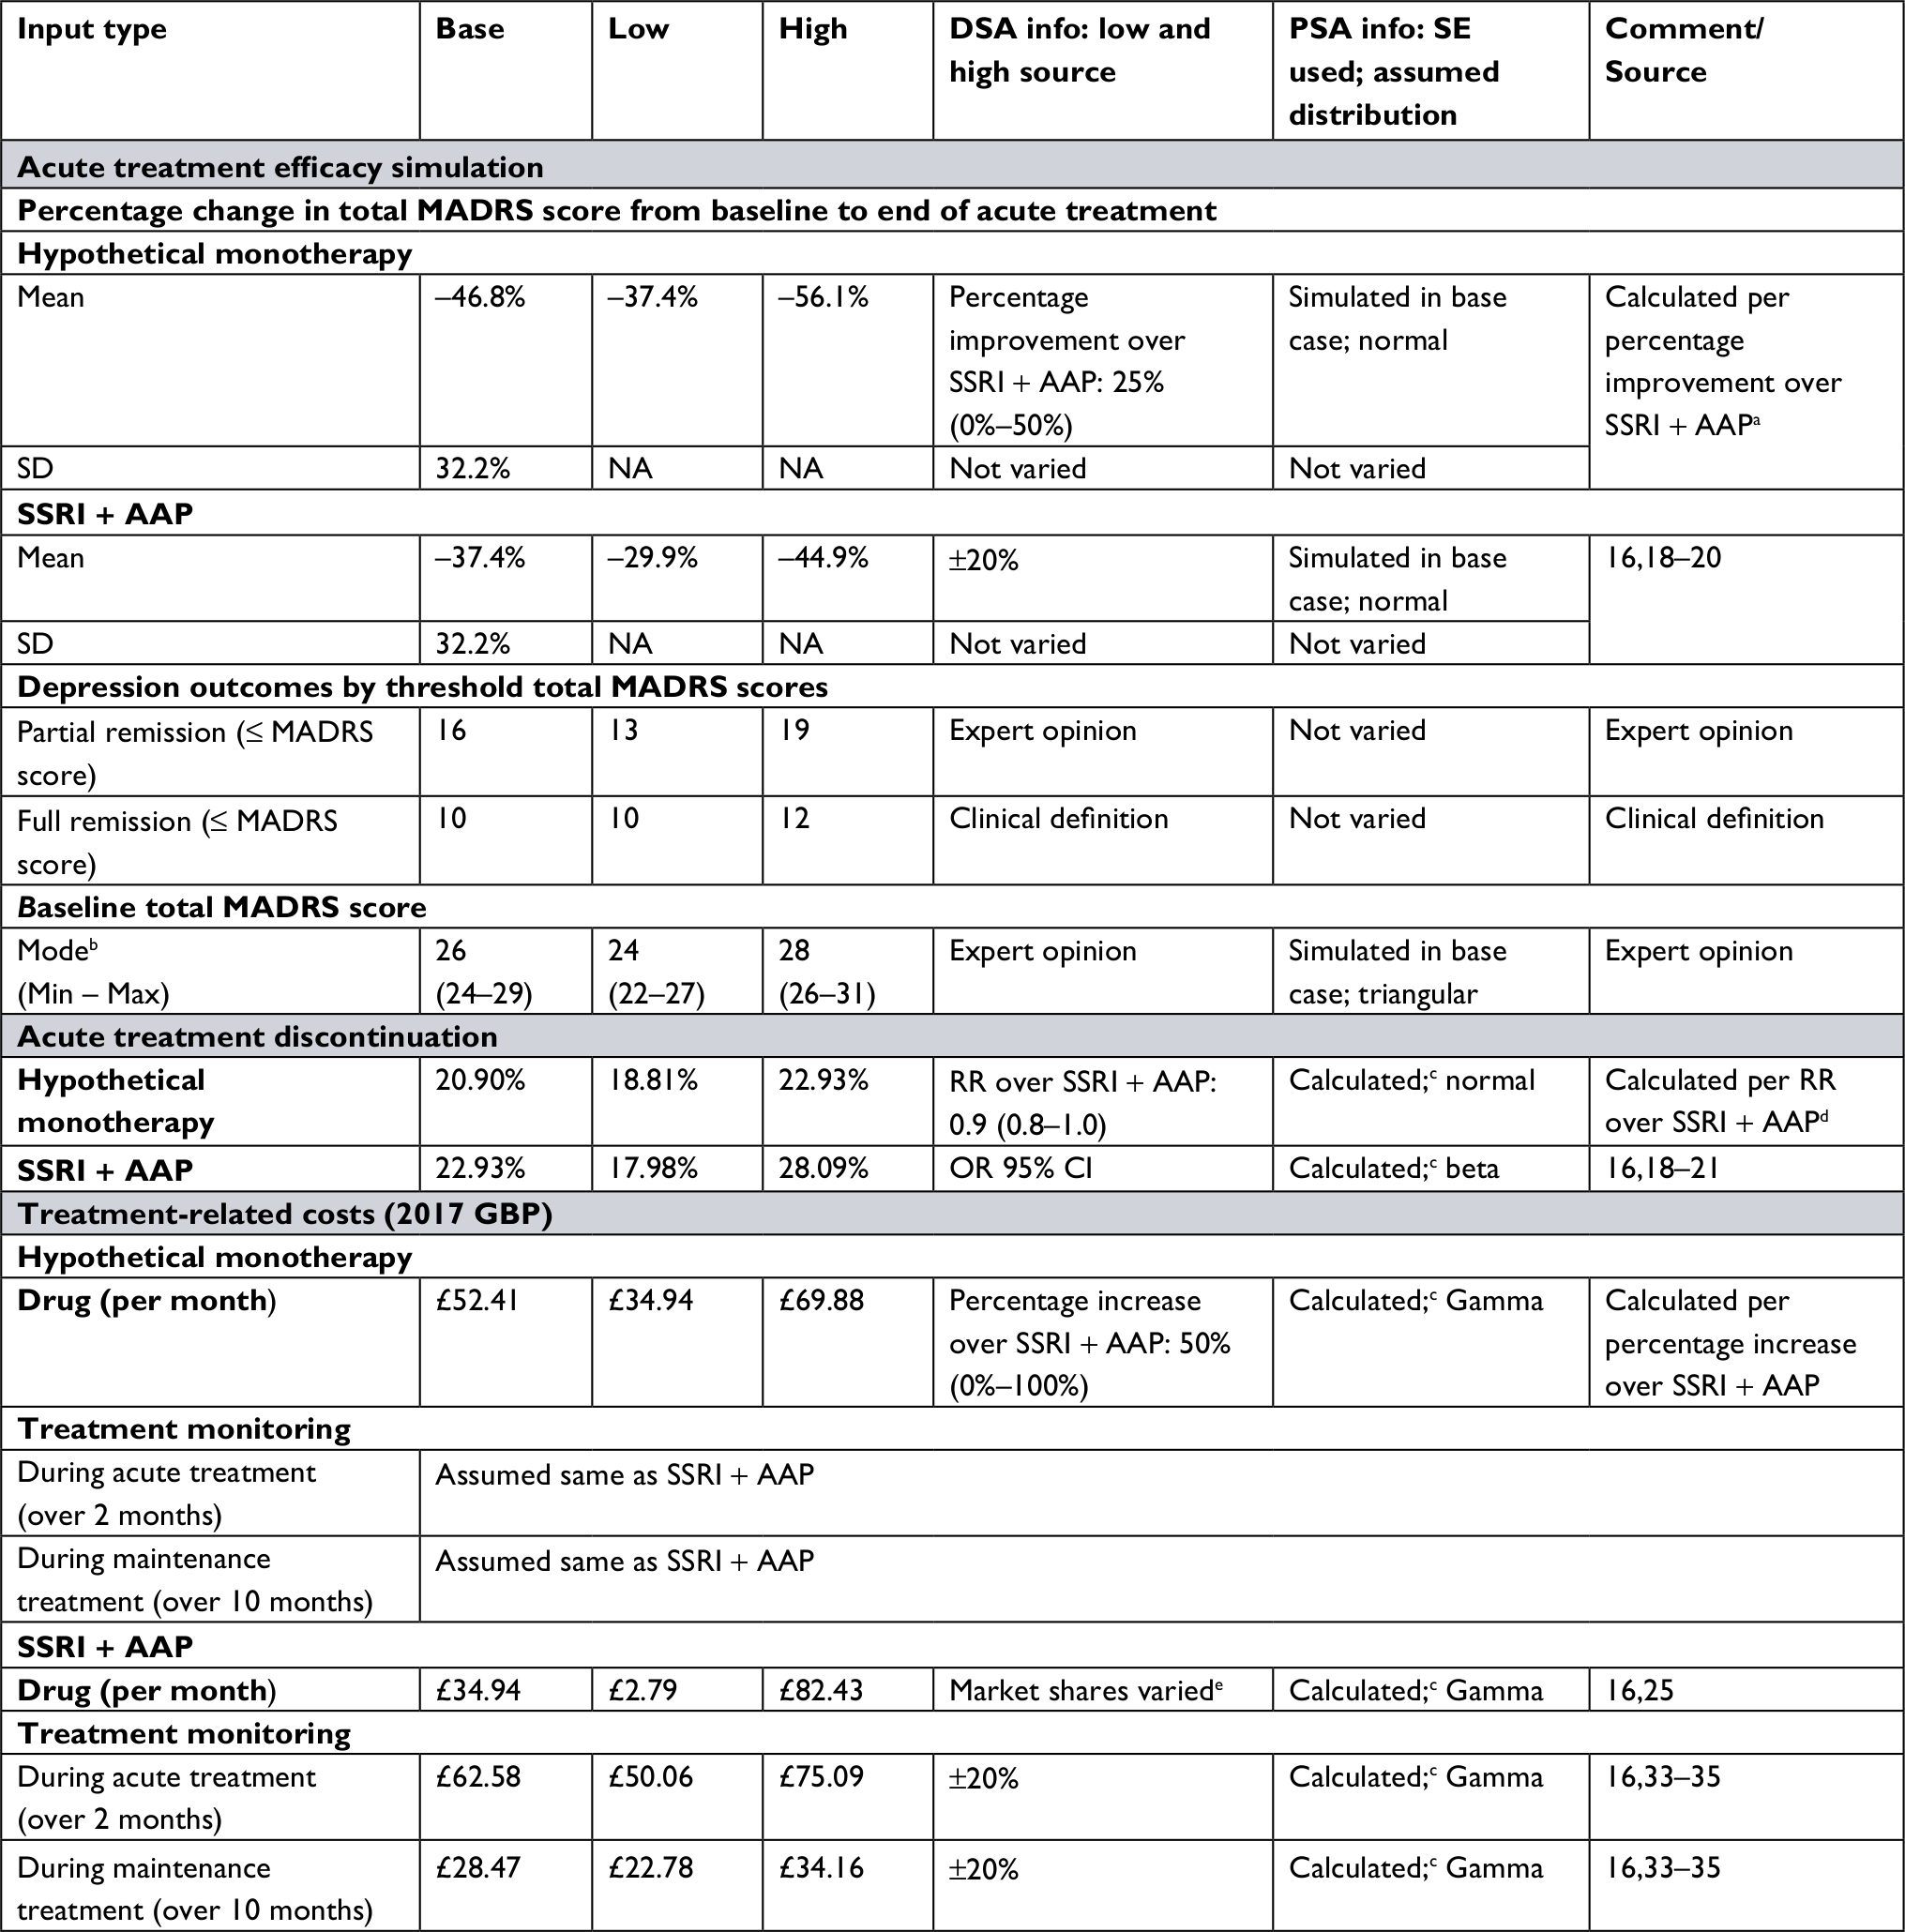 | Table 1 Summary of treatment-specific model inputs Notes: aFor the hypothetical monotherapy with efficacy advantage, the percentage change in total MADRS score from baseline to end of acute treatment was calculated per acute treatment efficacy percentage improvement over SSRI + AAP, which was set to 25% in the base case and varied 0% to 50% in DSA. For the hypothetical monotherapy without efficacy advantage, the percentage change in total MADRS score from baseline to end of acute treatment was assumed to be same as SSRI + AAP. The SD of the resulting percentage change in total MADRS score was assumed to be the same as SSRI + AAP. bBaseline MADRS scores were simulated using a triangular distribution with the given mode, lower limit (min), and upper limit (max). cSE calculated as ((base – low)+(high – base))/(2*1.96). dFor the hypothetical monotherapy with tolerability advantage, the acute treatment discontinuation rate was calculated per RR of discontinuation over SSRI + AAP, which was set to 0.9 in the base case and varied 0.8–1.0 in DSA. For the hypothetical monotherapy without tolerability advantage, the RR of discontinuation was assumed to be 1.0 (same rate of discontinuation as SSRI + AAP). eThe prices of individual SSRIs and AAPs were assumed fixed, while their assumed market shares were varied from higher to lower shares for cheaper (vs more expensive) drugs. Abbreviations: AAP, atypical antipsychotics; DSA, deterministic sensitivity analysis; GBP, British pound; MADRS, Montgomery-Åsberg Depression Rating Scale; NA, not applicable; PSA, probabilistic sensitivity analysis; SE, standard error; SSRI, selective serotonin reuptake inhibitors. |
Acute treatment efficacy
Probabilities of full and partial remission associated with acute treatment are required to inform the decision tree component of the model, representing the acute treatment phase. These treatment-specific probabilities are generated in the model using a simulation approach: 1) a hypothetical cohort of 1,000 patients is created, and each is assigned a baseline MADRS score that is sampled from a triangular distribution of possible MADRS scores with lower limit 24, upper limit 29, and mode 26 based on expert opinion (co-author IMA); 2) each patient is further assigned a percentage change in MADRS score from baseline to end of acute treatment that is sampled from a normal distribution with treatment-specific mean and SD; and 3) each patient’s MADRS score following acute treatment is calculated (sampled baseline MADRS score * [1+ sampled percentage change in MADRS score from baseline]) and assessed against prespecified MADRS thresholds to determine the proportions achieving “full remission” (≤10), “partial remission” (>10 and ≤16), and “in episode” (>16). Steps (1) to (3) are repeated 2,000 times, and the average of the resulting proportions is used to inform the probabilities of entering “full remission”, “partial remission”, and “in episode discontinued” in the decision tree component of the model after 8 weeks of acute treatment.
For SSRI + AAP, the mean (SD) percentage change in MADRS score from baseline to end of acute treatment was approximated from Edwards et al16 to be 37.4% (32.2%), the absolute change (SD) in MADRS score of –11.22 (9.65) for SSRI + AAP divided by a baseline MADRS score of 30. For the hypothetical monotherapy, the mean percentage change in MADRS score was determined based on a percentage advantage over SSRI + AAP, which is 25% (reduces MADRS score by 25% more than SSRI + AAP) in the base case and varied from 0% to 50% in DSA. The SD of the percentage change in MADRS score is assumed to equal that of SSRI + AAP (32.2%). The acute treatment efficacy was simulated for SSRI + AAP and base case hypothetical monotherapy.
Acute treatment tolerability
Probability of discontinuation (for any reason) at week 4 of acute SSRI + AAP treatment was obtained from the mixed-treatment comparison conducted by Edwards et al,16 which found SSRI + AAP to be associated with a higher rate of discontinuation than SSRI alone (OR =1.27; 95% CI =0.90–1.75) based on data from five SSRI + AAP trials.16,18–21 Edwards et al converted this OR into an RR of 1.21 (95% CI =0.92–1.53), and used it to adjust the rate of discontinuation (19.4%) associated with SSRI alone reported in Thase et al18 into a rate of 26.1% (95% CI =19.8% to 33%) for SSRI + AAP. We assumed that the hypothetical monotherapy would provide a tolerability advantage compared with SSRI + AAP, which would reduce treatment discontinuation by 10% (ie, RR of 0.9) for the base case and varied from 0% to 20% (ie, RR =0.8 and RR =1.0) in DSA. Rates of discontinuation are converted into probabilities of 22.93% (95% CI =17.98% to 28.09%) and 20.90% (varied 18.81% to 22.93%) for SSRI + AAP and the hypothetical monotherapy, respectively.
Clinical improvement following discontinuation from acute treatment
Experts consulted by Edwards et al16 agreed that, overall, ~5% and ~15% of noncompleters would remit and respond, respectively. These estimates, assumed to be annual probabilities, were converted into 2-month probabilities (0.85% for full remission and 2.67% for partial remission).
Partial remission to full remission
In the Markov model representing the maintenance phase, the 2-month probability of transitioning from partial to full remission was derived from a longitudinal study conducted in the United Kingdom by Fekadu et al,22 who followed 118 patients with TRD upon discharge from specialist inpatient care for a median duration of 3 years. Among patients who were discharged in partial remission, 50% achieved [full] remission over the follow-up period.22 This probability was converted into 2-month probability (3.80%) using standard formula, and was used to represent the probability of transitioning from “partial remission” to “full remission” and from “partial remission discontinued” to “full remission discontinued”.
Partial or full remission to relapse
Relapse rates were obtained from the 1-year follow-up results reported for level 3 patients (n=390) in the STAR*D trial.4 Patients in level 3 had failed to benefit from at least two antidepressant exposures. Relapse rates in this follow-up study were reported by remission status; fewer patients who were in remission at the beginning of follow-up relapsed than those who were not in remission (42.9% vs 76%). These annual probabilities were converted into 2-month probabilities, regardless of treatment status.
In episode to partial or full remission (discontinued)
The 2-month probabilities of clinical improvement following discontinuation from acute treatment based on expert opinion – 0.85% for full remission and 2.67% for partial remission – are assumed to be applicable here, based on the assumption that noncompleters generally discontinue their treatment due to lack of efficacy, and presumably are still in episode when being assessed for clinical improvement.
Maintenance treatment discontinuation
Due to lack of data, the average probability of acute treatment discontinuation across the intervention and comparator (22.93% [95% CI =17.98% to 28.09%] for SSRI + AAP and 20.90% [varied 18.81%–22.93%] for hypothetical monotherapy) is assumed in the maintenance phase.
Costs
Constructed from the perspective of a public payer in the United Kingdom (eg, NHS), the model considers only direct costs of drug treatments, treatment-related monitoring (eg, laboratory tests), and patient care (eg, outpatient usual care, intensive home-based support, and hospitalization). Cost accounting methods and unit costs, unless otherwise stated in Tables 1 and 2, were obtained from the Edwards et al model16 and inflated from 2011 to 2017 British pounds (£) using the UK Consumer Price Index for health.23
Assuming a class effect for SSRIs and AAPs, the cost of SSRI + AAP was calculated as the sum of weighted average costs of commonly prescribed SSRIs and AAPs at clinically relevant total daily doses (see Table S1). Individual drug weights were updated from Edwards et al16 per clinical opinion and published literature,24 and their nonproprietary unit costs were obtained from the British National Formulary in March 2017.25 The hypothetical monotherapy is assumed to be 50% (varied 0%–100%) more expensive than SSRI + AAP (£34.94).
The frequency and cost of laboratory tests (eg, body mass index assessment, electrocardiography, full blood count, estimated glomerular filtration rate creatinine, creatinine to monitor renal function, glucose test, and lipid profile test) to monitor patients during their 2-month acute and 10-month maintenance treatments with SSRI + AAP, £62.58 and £28.47, respectively, in 2017 British pounds, were obtained from Edwards et al.16 These monitoring costs are assumed to be the same for the hypothetical therapy.
The model assumes that there are three settings to patient care: 1) outpatient usual care (from general practitioners and community mental health teams); 2) intensive home-based support (from crisis resolution and home treatment teams); and 3) hospitalization for acute depression. The frequency and cost of patient care in each setting during 2-month acute and 10-month maintenance treatments were obtained from Edwards et al16 and inflated to 2017 British pounds (November 2017: 1 pound sterling =1.32 US dollars). These costs are assumed to be independent of treatment and differ only by health state during maintenance treatment.
Health utilities
Model health utilities were obtained from Sapin et al,26 who estimated the health-related quality of life of MDD patients in French primary care using the European Quality of Life 5 Dimension Questionnaire (EQ-5D). Specifically, utilities for full remission, partial remission, and in episode/relapse were assumed to be the reported 8-week mean EQ-5D utilities for Clinical Global Impression of Severity27 categorizations of “First signs”, “Slightly/Moderately ill”, and “Markedly ill”, respectively (see Table 2).
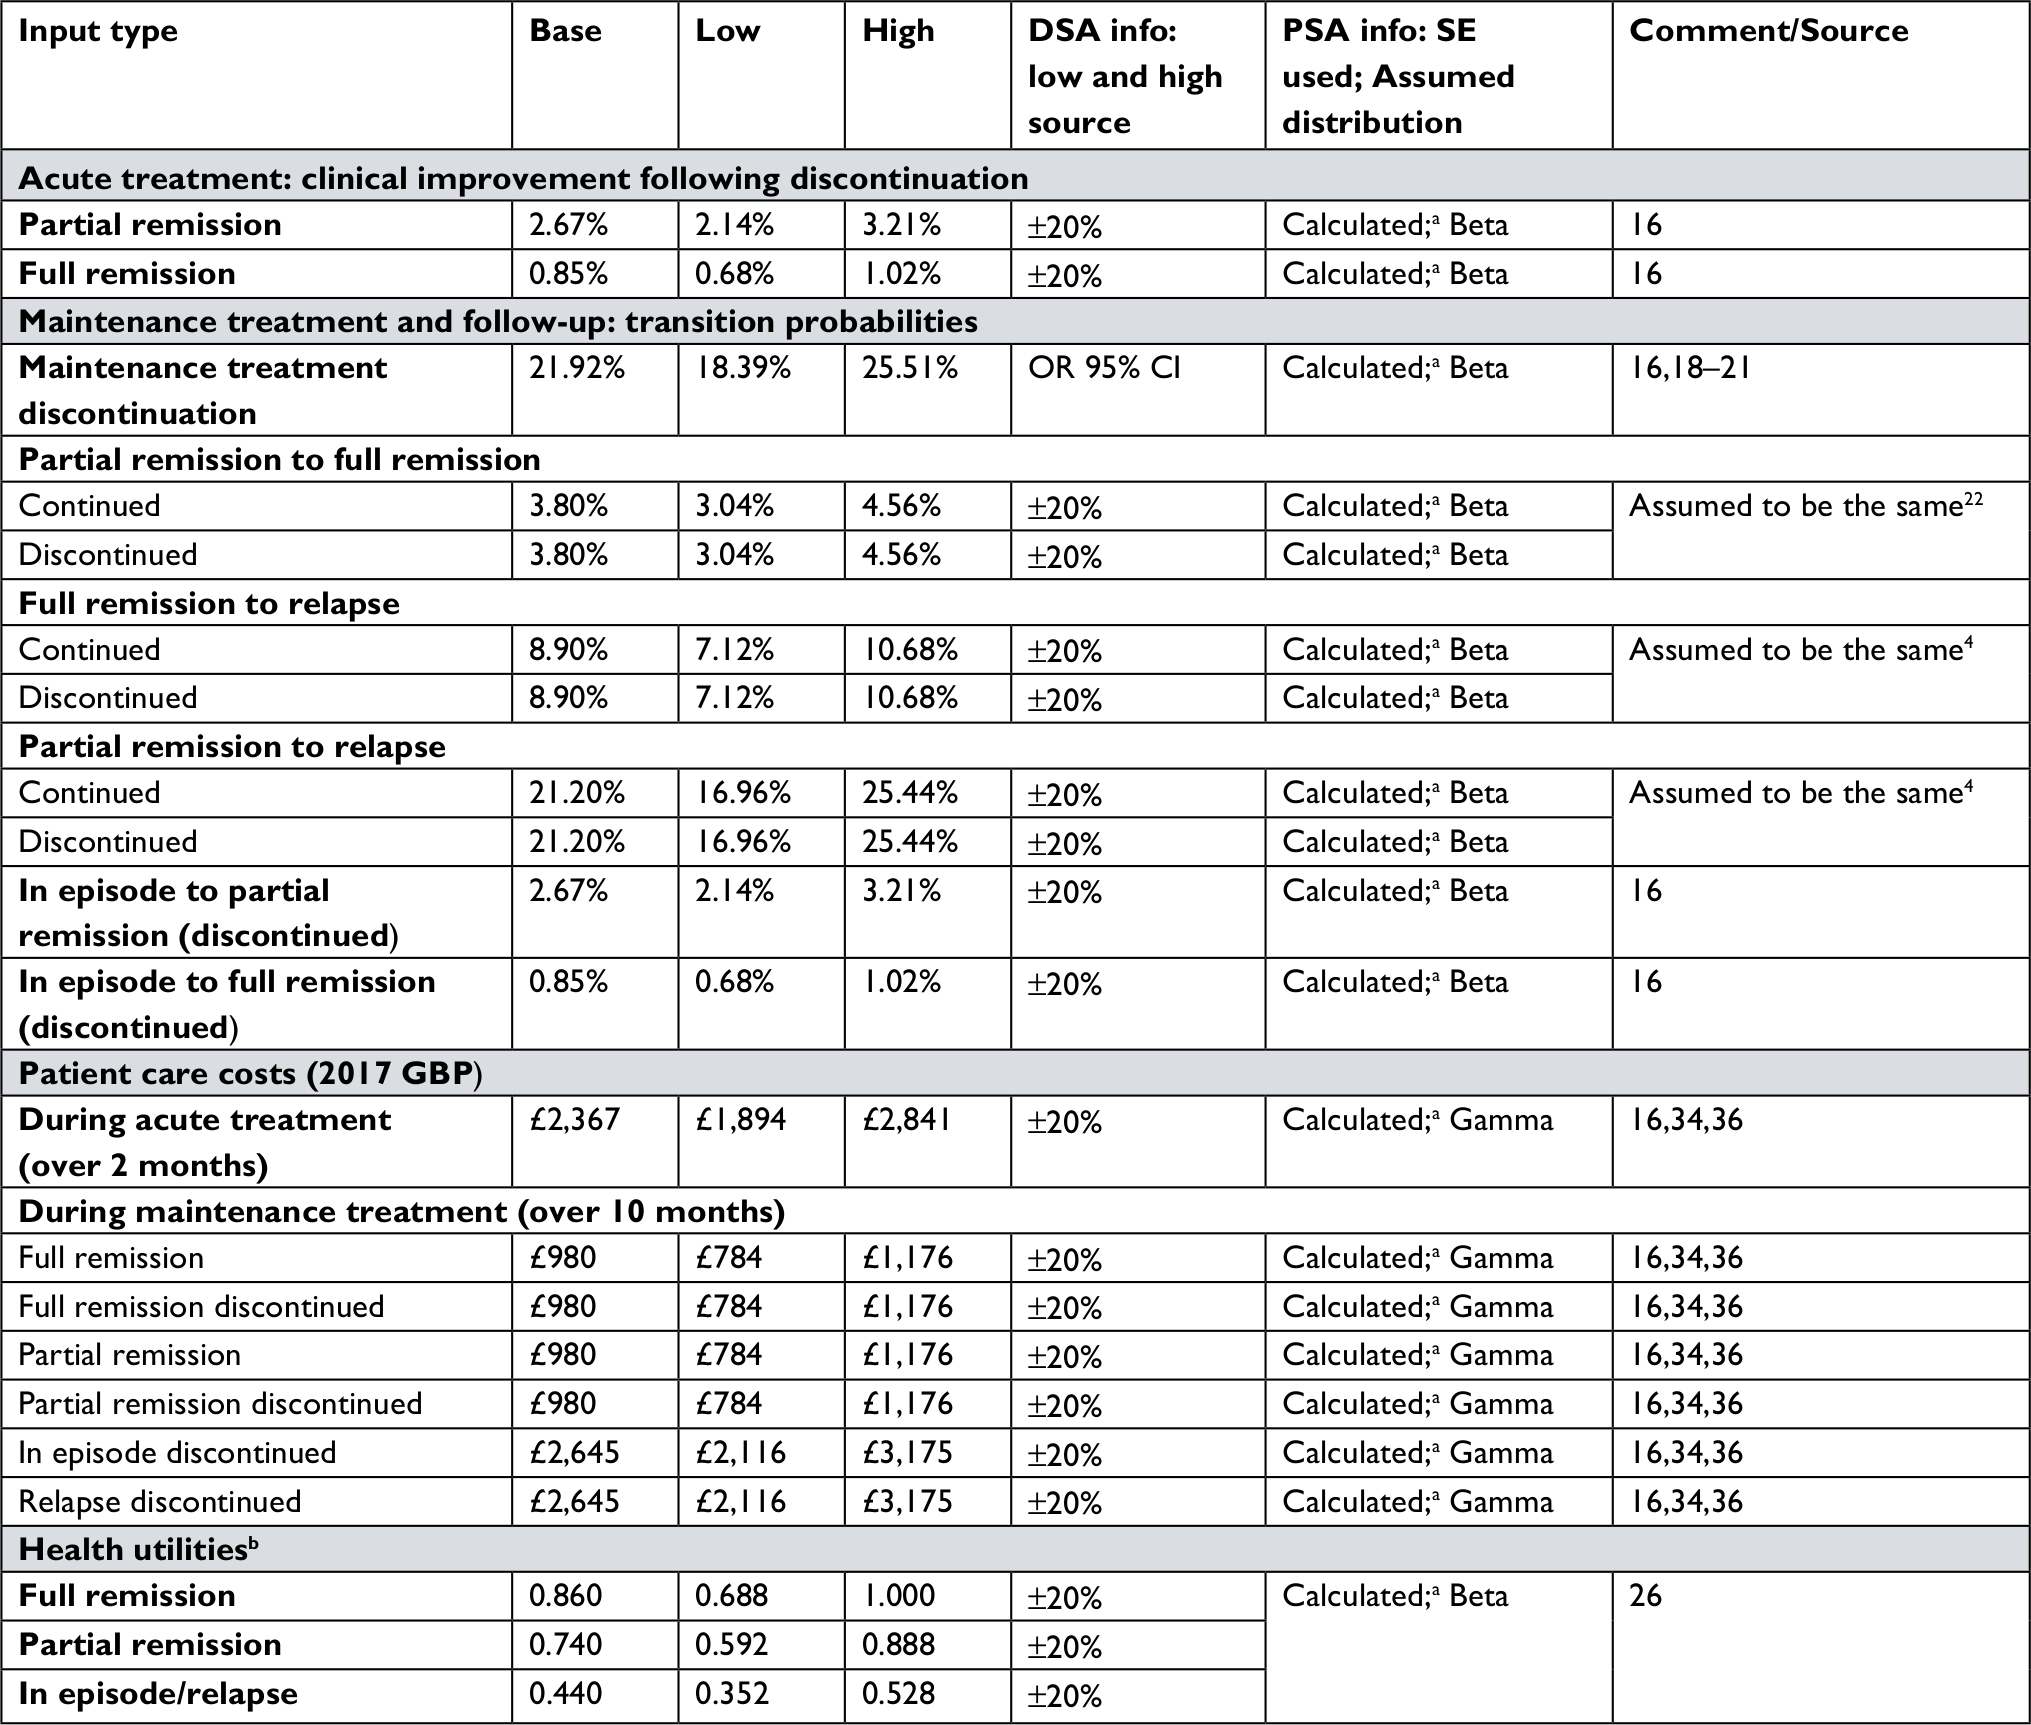 | Table 2 Summary of treatment-unspecific model inputs Notes: aSE calculated as ((base – low)+(high – base))/(2*1.96). bHealth utilities high values are bounded in the [0,1] interval using the minimum function in Excel. Abbreviations: DSA, deterministic sensitivity analysis; GBP, British pound; PSA, probabilistic sensitivity analysis; SE, standard error. |
Results
Base case analysis
Patients enter the model in an episode of TRD with a mean MADRS score of 26 (range: 24–29). SOC treatment (SSRI + AAP) lowers the MADRS scores by a mean of 37.4% (SD: 32.2%), resulting in a simulated proportion of 47.8% achieving partial or full remission (MADRS score ≤16). The hypothetical monotherapy, with its 25% efficacy advantage over SOC, lowers the MADRS scores by a mean of 46.8% (SD: 32.2%), resulting in a simulated proportion of 59.3% achieving partial or full remission. As shown in Table 3, the difference in the simulated proportion achieving partial or full remission between the hypothetical monotherapy and SOC is 11.5%.
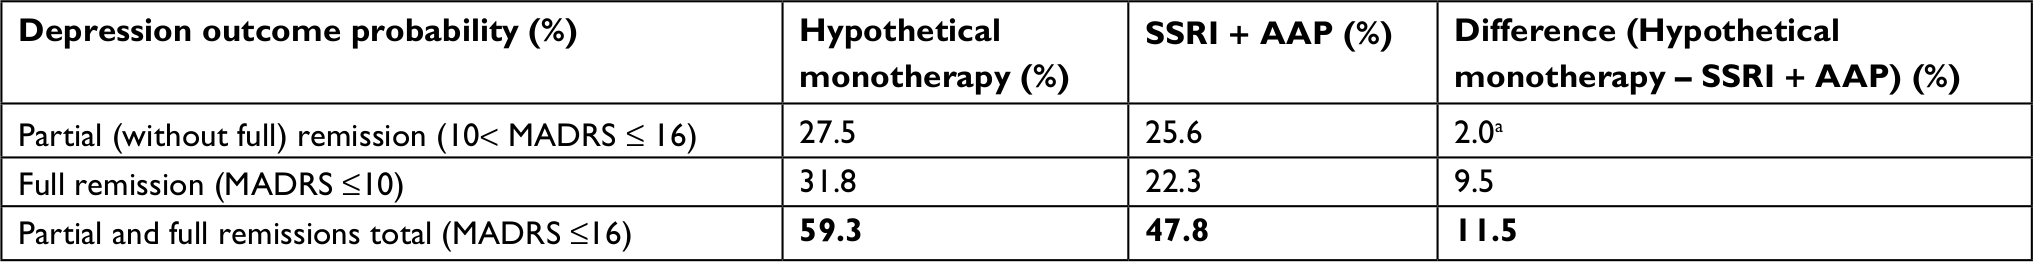 | Table 3 Simulated acute treatment efficacy Note: aThe difference is not 1.9% because of rounding issue. Abbreviations: AAP, atypical antipsychotics; MADRS, Montgomery-Åsberg Depression Rating Scale; SSRI, selective serotonin reuptake inhibitors. |
Over the 12-month time horizon, the model estimates a total cost of £4,963 for a patient on the hypothetical monotherapy vs £5,027 for the same patient on SSRI + AAP, for an incremental cost associated with the hypothetical monotherapy of £63 (Table 4). For effectiveness, the model estimates a total of 0.580 quality-adjusted life years (QALYs) for a patient on the hypothetical monotherapy vs 0.552 QALYs for the same patient on SSRI + AAP, for an incremental effectiveness associated with the hypothetical monotherapy of 0.028 QALY. Additionally, at a payer maximum willingness-to-pay (WTP) of £30,000 per QALY, the hypothetical monotherapy is associated with an incremental net monetary benefit (INMB) of £914 (= [∆ QALY * WTP] – [∆ Cost]) and an optimal monthly price of £359, an ~929% premium over SSRI + AAP’s monthly price of £35.
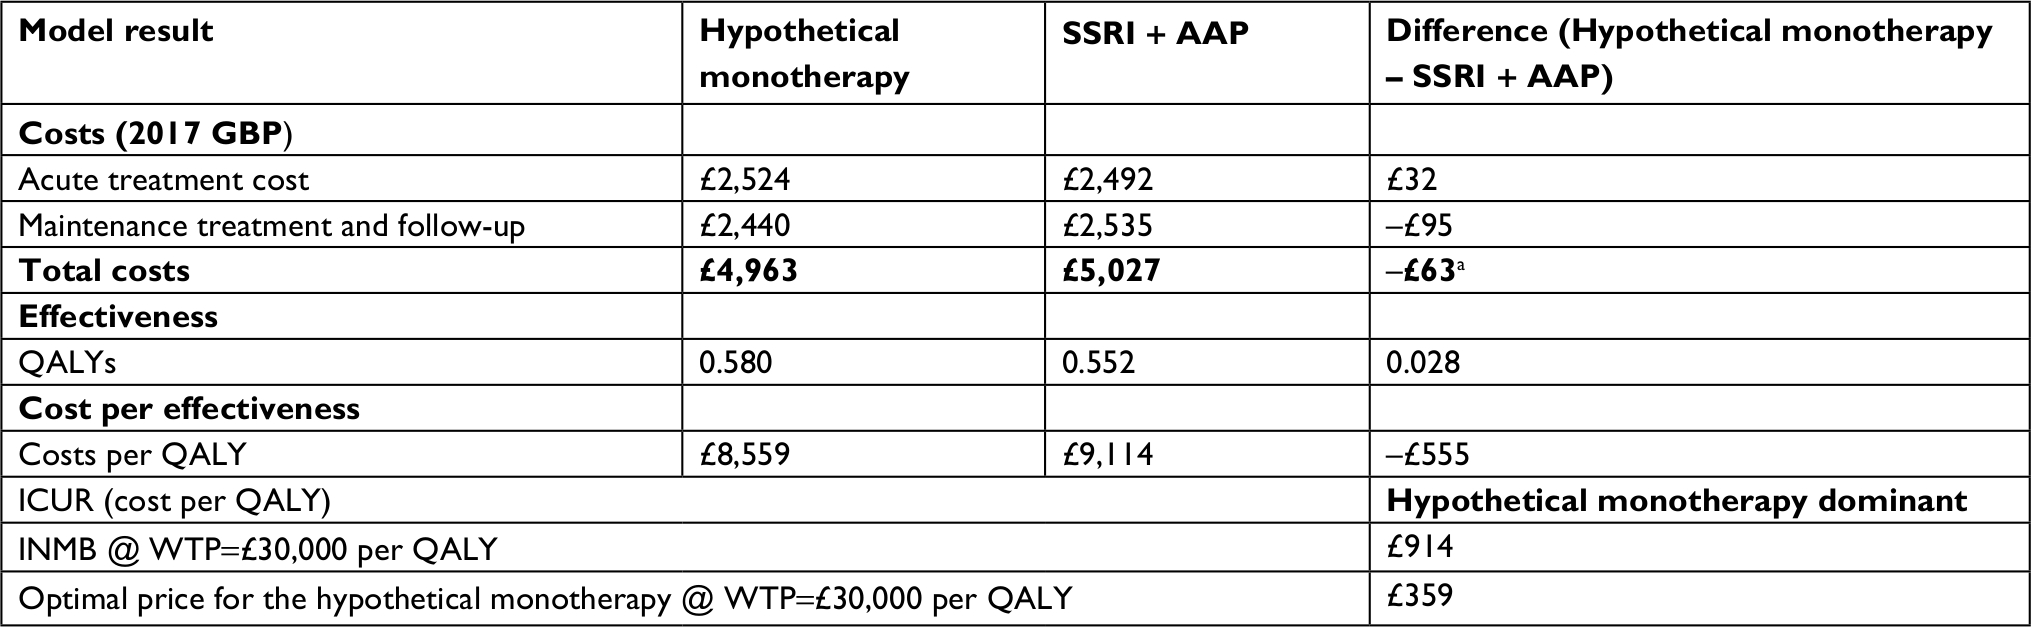 | Table 4 Base case model results Note: aThe difference is not –£64 because of rounding issue. Abbreviations: AAP, atypical antipsychotics; GBP, British pound; ICUR, incremental cost-utility ratio; INMB, incremental net monetary benefit; QALY, quality-adjusted life year; SSRI, selective serotonin reuptake inhibitors; WTP, willingness-to-pay. |
Sensitivity analyses
The DSA is conducted by varying model parameters individually or in combinations to assess their influence on the hypothetical monotherapy’s base case of INMB at WTP of £30,000/QALY. The resulting tornado diagram (Figure 3) depicts the 20 most influential model parameters on the INMB, the top two of which are both efficacy related: 1) the hypothetical monotherapy’s efficacy advantage over SSRI + AAP and 2) the mean percentage change in MADRS score from baseline to end of acute treatment for SSRI + AAP.
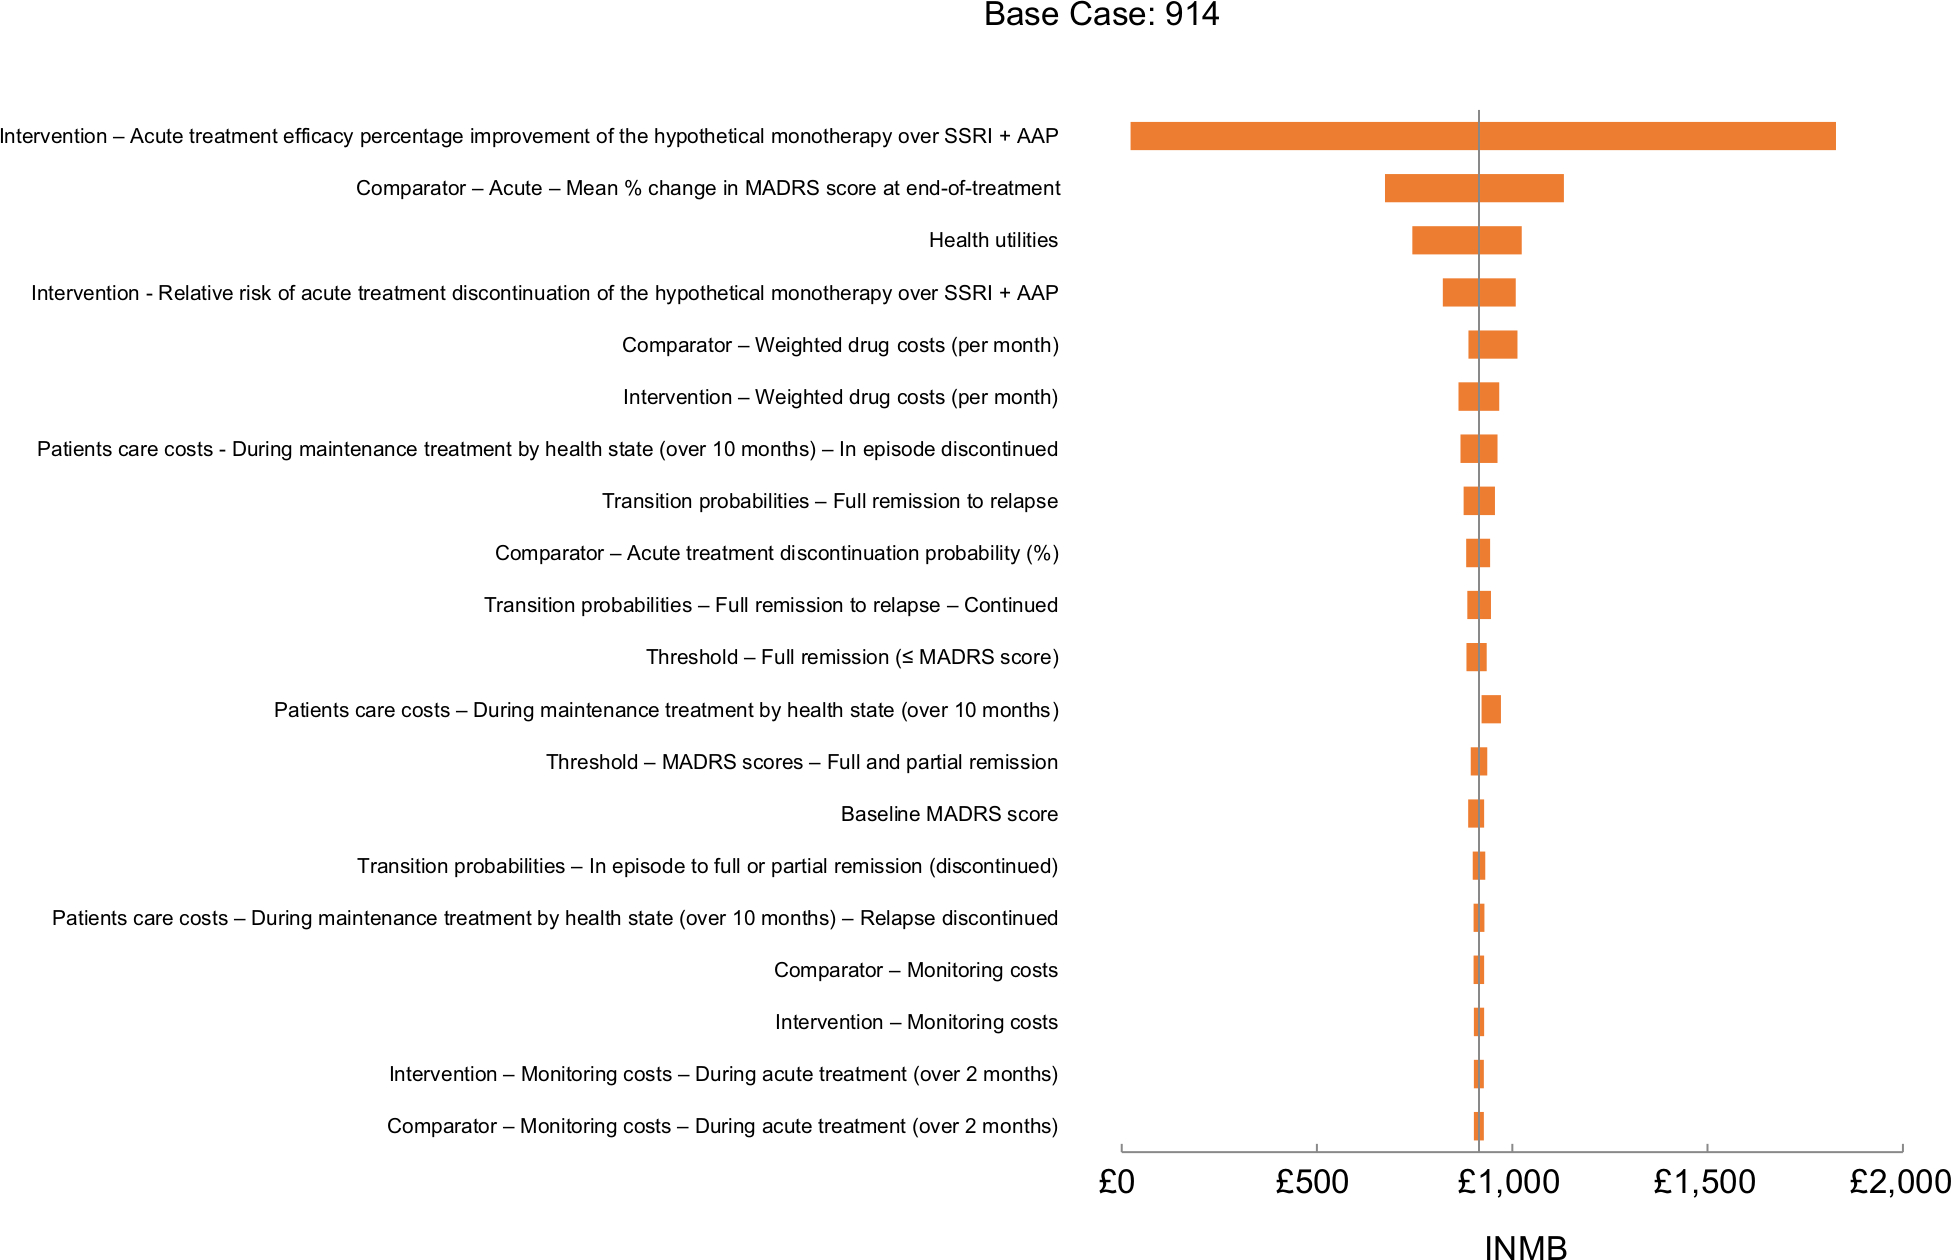 | Figure 3 Deterministic sensitivity analysis on INMB at WTP of £30,000 per QALY for the hypothetical monotherapy with both efficacy and tolerability advantages. Abbreviations: AAP, atypical antipsychotics; INMB, incremental net monetary benefit; MADRS, Montgomery-Åsberg Depression Rating Scale; QALY, quality-adjusted life year; SSRI, selective serotonin reuptake inhibitors; WTP, willingness-to-pay. |
The PSA is conducted by considering the uncertainty in all model parameters simultaneously over 500 iterations. The resulting cloud of incremental costs and incremental QALYs for the hypothetical monotherapy vs SSRI + AAP is presented in Figure 4. The cost-effectiveness acceptability curves showing the probability of each treatment option being cost-effective for a given WTP are presented in Figure 5. The curves reveal the robustness of base case model results: at WTPs >£10,000/QALY, the hypothetical monotherapy is cost-effective vs SSRI + AAP in 100% of the iterations.
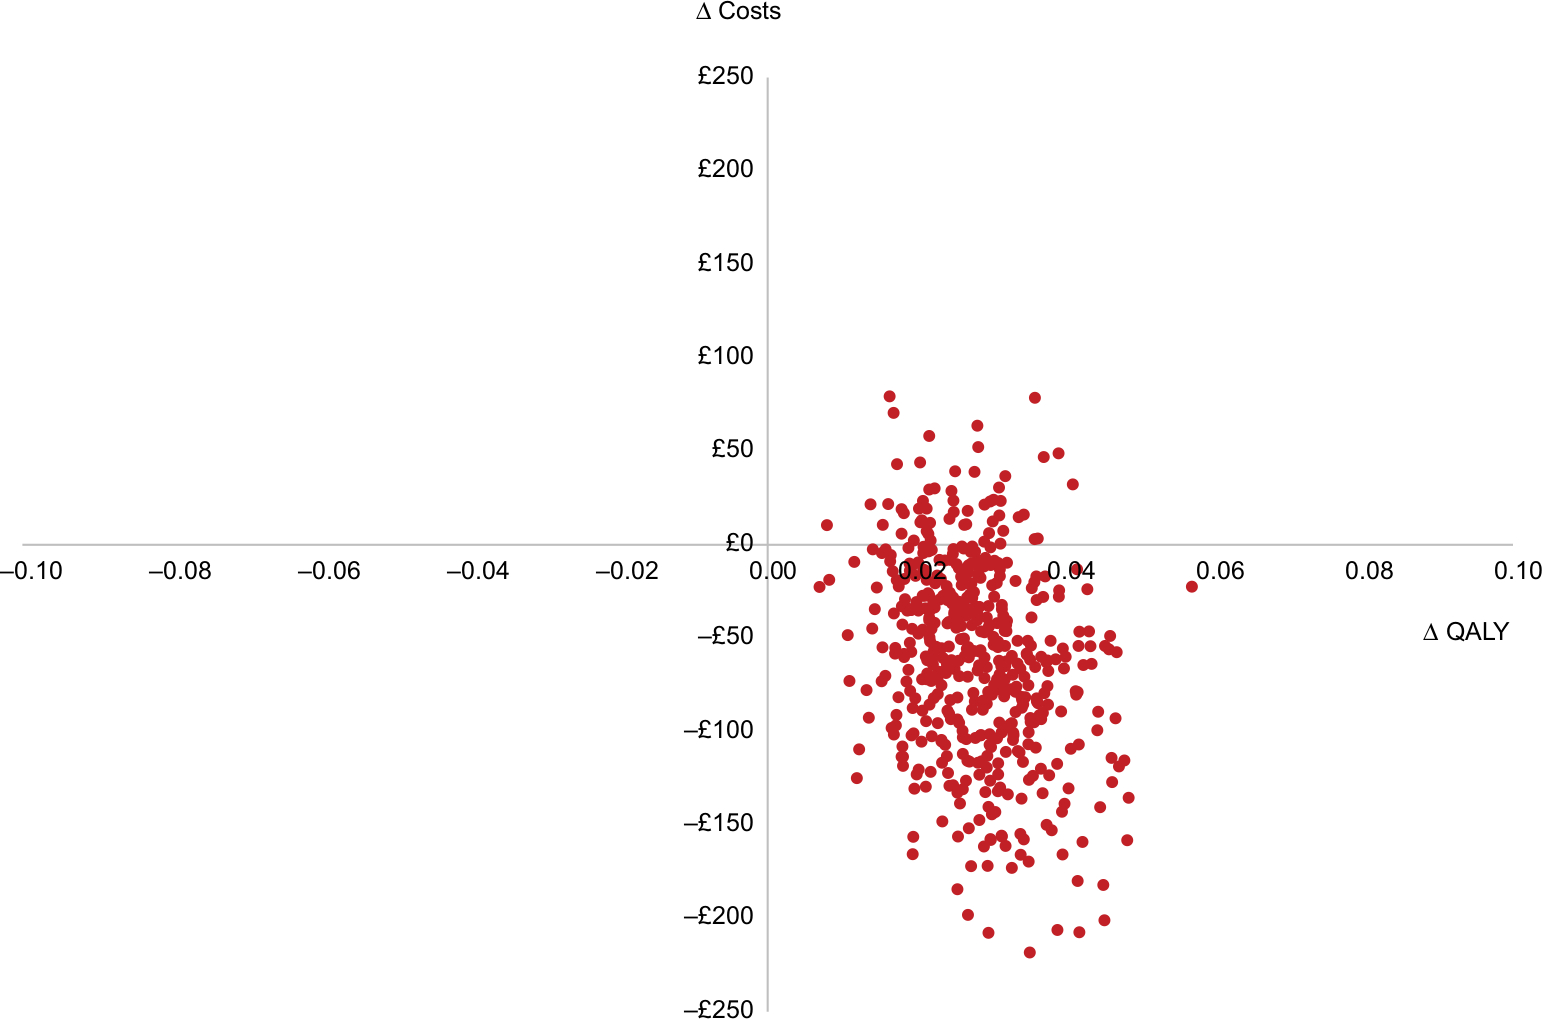 | Figure 4 Cost-effectiveness plane for the hypothetical monotherapy with both efficacy and tolerability advantages. Abbreviation: QALY, quality-adjusted life year. |
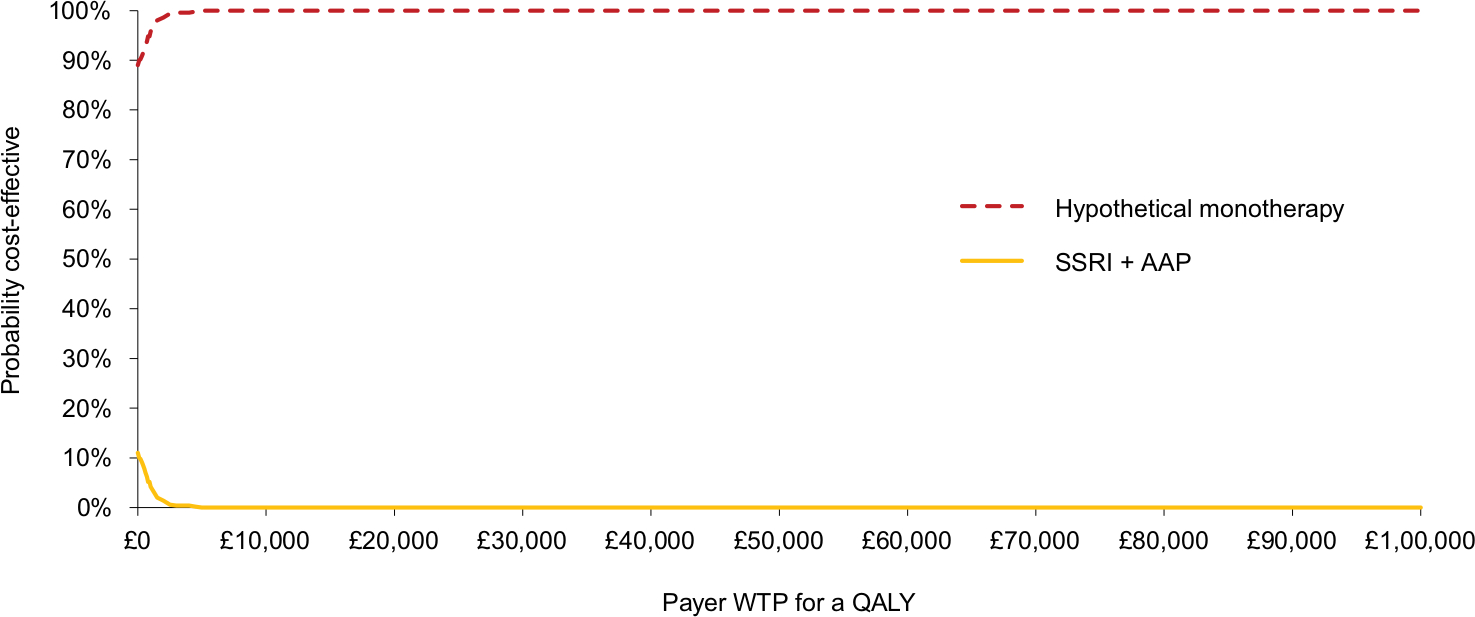 | Figure 5 Cost-effectiveness acceptability curves for the hypothetical monotherapy with both efficacy and tolerability advantages. Abbreviations: AAP, atypical antipsychotics; QALY, quality-adjusted life year; SSRI, selective serotonin reuptake inhibitors; WTP, willingness-to-pay. |
Scenario analyses
Although characterized under the guidance of a clinical expert (co-author IMA), the intervention is nonetheless a hypothetical monotherapy that could take on different profiles in the real world. Model results for hypothetical monotherapies with different combinations of efficacy and tolerability advantages over SSRI + AAP are therefore assessed. As shown in Figure 6, there exists a relatively linear negative relationship between the hypothetical monotherapy’s efficacy and tolerability advantages over SSRI + AAP that result in its dominance (ie, lower costs and higher QALYs). For example, a hypothetical monotherapy with 50% price premium and 0% efficacy advantage would need at least ~70% tolerability advantage over SSRI + AAP to dominate it. As the efficacy advantage of the hypothetical monotherapy increases, the minimum tolerability advantage needed for its dominance over SSRI + AAP decreases. At ~12% or higher efficacy advantage, the hypothetical monotherapy would dominate SSRI + AAP, regardless of its tolerability advantage (see also Table S2).
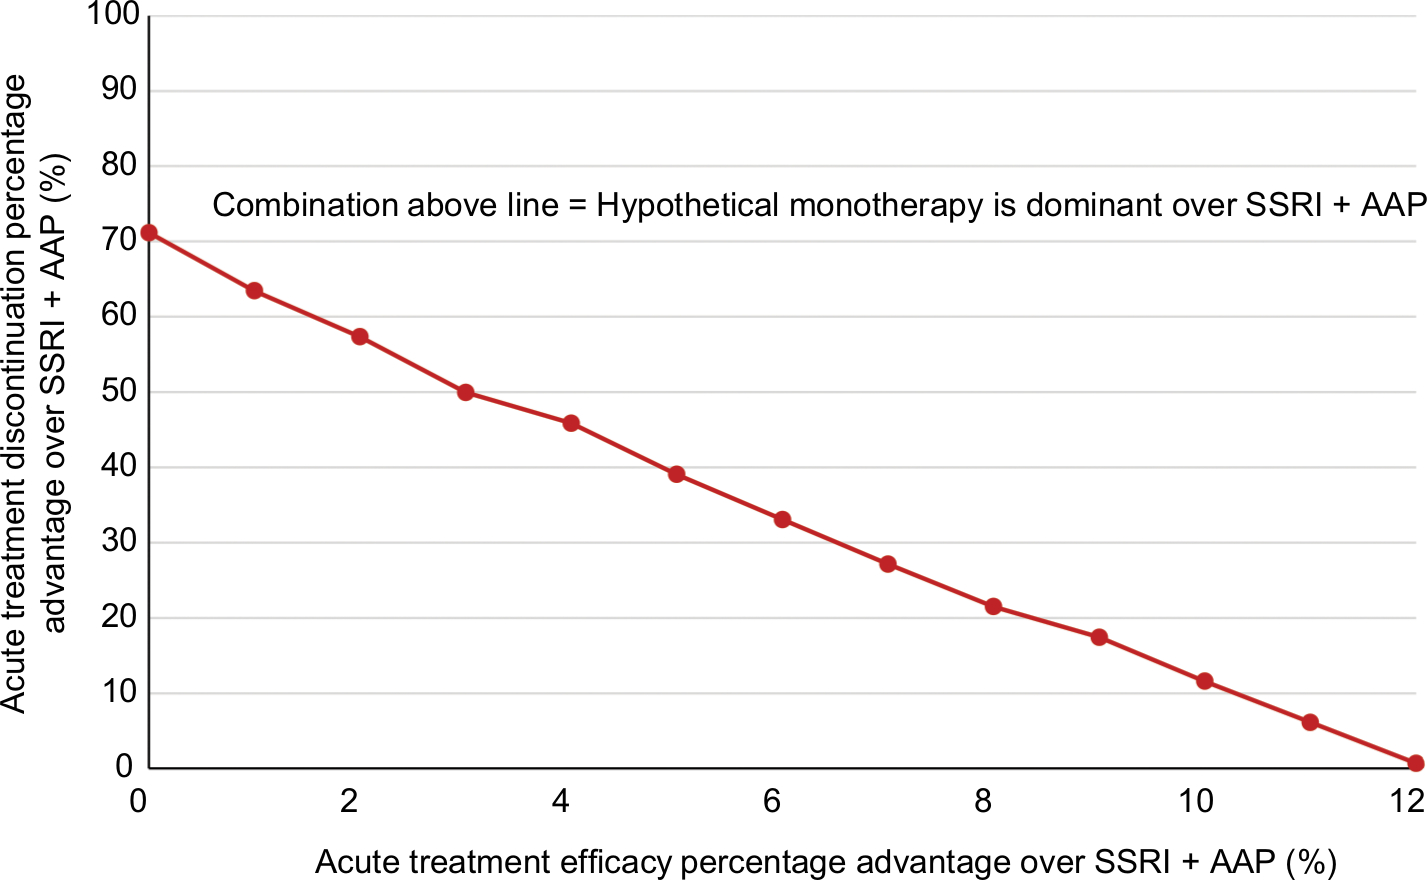 | Figure 6 Combinations of acute treatment discontinuation and efficacy percentage advantages over SSRI + AAP that result in dominance of the hypothetical monotherapy (lower costs and higher QALYs). Note: Results were based on a 50% price premium of the hypothetical monotherapy over SSRI + AAP. Abbreviations: AAP, atypical antipsychotics; QALYs, quality-adjusted life years; SSRI, selective serotonin reuptake inhibitors. |
Even when the hypothetical monotherapy is not the dominant treatment strategy, it will still be a cost-effective strategy if the incremental cost-utility ratio (ICUR) falls below payers’ maximal WTP. The ICUR for different combinations of efficacy and tolerability advantages over SSRI + AAP falling below the “line” for hypothetical monotherapy dominance (Figure 6) is presented in Table S2. Assuming a payer WTP of £30,000/QALY, the hypothetical monotherapy would be cost-effective over SSRI + AAP in all instances except when it has no efficacy advantage and very minimal tolerability advantage (≤5%) over SSRI + AAP.
If a therapy is more cost-effective, more money can be charged for it while it remains “good value” to a payer who uses cost-effectiveness analysis for market access decision-making. Indeed, for the base case hypothetical monotherapy with 25% efficacy and 10% tolerability advantage over SSRI + AAP, assuming a payer WTP of £30,000/QALY, significantly more can be charged for it per month than the base case 50% price premium over SSRI + AAP (£359 vs £52). This is the case for all hypothetical monotherapies with combinations of efficacy and tolerability advantages over SSRI + AAP that result in their being the cost-effective, if not dominant, treatment strategy (Table S3).
Discussion
The present model provides a framework to assess the characteristics, in terms of efficacy and/or tolerability, required for a new monotherapy for TRD to compare favorably to SSRI + AAP from the perspective of a UK health care payer. As shown by the model base case, the characteristics for the new monotherapy need not be particularly competitive to compare favorably to SSRI + AAP, due to the considerable burden of TRD, as well as the weak profile of SSRI + AAP. Indeed, patients enter the model highly burdened with depressive symptoms (MADRS scores with mean 26), and yet SSRI + AAP only lowers the MADRS scores enough (by 32.2% to a mean MADRS score of ~16) to barely achieve partial remission (MADRS score ≤16). Thus, under the current SOC for TRD, the model estimates that more than half of patients remain in episode despite treatment. Furthermore, SSRI + AAP is associated with low tolerability, which is captured in the model by a high probability (22.93%) of acute treatment discontinuation.
Given the low efficacy and tolerability of the SOC available for TRD, the bar was set relatively low for a hypothetical therapy to be cost-effective. Over the 12-month model time horizon, the hypothetical monotherapy is shown to dominate SOC, generating lower costs and higher QALYs in comparison to SSRI + AAP. Indeed, a hypothetical monotherapy with 25% efficacy advantage, 10% tolerability advantage, and 50% price premium relative to SSRI + AAP is shown to be a superior treatment strategy, and to remain a superior therapy even when its hypothetical advantages are reduced, such as no tolerability advantage and reduced efficacy advantage (12%).
Assuming the hypothetical monotherapy has robust efficacy and tolerability data, findings from the present study indicate that the hypothetical monotherapy could be adopted by a health care system for the management of patients with TRD. However, investing resources in additional research may be warranted, as the evidence for some key model inputs is uncertain. First, there is a lack of clinical consensus regarding an accepted definition for TRD, including the outcomes used to assess treatment response, the definition of treatment response, and the definition of a failed course of therapy.3,27–29 For the purposes of the present study, the most common definition of TRD was used, which is nonresponse to two or more adequate courses of consecutive antidepressant treatments in a single MDD episode.3,30 The lack of a standard definition of TRD makes attempts to find consistent data on the prevalence and disease burden of TRD, or to perform comparative studies, challenging.31,32 Second, the model assumes treatment equivalence in the Markov model component due to lack of long-term comparative clinical data, as well as dependence on the MADRS score to assess MDD and treatment efficacy. Indeed, the model’s dependence on the MADRS score limits the applicability of its results to a clinical setting, where a multifaceted look at treatment efficacy is generally expected. Third, treatment-specific probabilities were generated using a simulation approach, and data describing the average probability of maintenance treatment discontinuation are suboptimal. Prioritizing these areas of research would provide alternative representations of the effectiveness of the hypothetical monotherapy and further inform decision-making concerning its appropriate use. Finally, while the use of SSRI + AAP as the SOC for TRD in the present model is supported by the current weight of evidence,14,15 there remains a lack of a genuine SOC for TRD.14,15 Even the specifics of the SSRI + AAP comparator are subject to interpretation, including choices of which SSRIs and AAPs to include and their respective doses and shares. These choices impact the cost of the SOC and, therefore, the model results. Future users of the present model will need to confirm that the specified SOC is still appropriate given any new data availability.
In addition to the data limitations, there are several modeling limitations. First, the model is a simplification of a complex clinical disease into transitions of patients among discrete health states for full remission, partial remission, and in episode. As such, it is designed to capture the experience of the average TRD patient, and not a reflection of all the possible clinical pathways of TRD. Second, the model was constructed from the perspective of a public payer and as such, does not consider indirect costs, such as costs of productivity losses (absenteeism and presenteeism) in a depressed, working-age population.37 In addition, the model does not include the impact of depression on role performance like marital and parental functioning or its impact on financial success.37
The present model has potential for use in a VOI framework as part of a systematic approach to measure decision uncertainty and assess whether there is sufficient evidence to support new interventions in TRD. The model was adapted from an existing model developed by Edwards et al,16 and made more robust in several ways. First, rather than assuming a fixed value, the baseline MADRS scores of patients entering the model are sampled from a triangular distribution of possible MADRS scores. This allows for variability in baseline MADRS scores, which is more reflective of real-world TRD populations. Second, treatment efficacy is modeled in terms of percentage rather than absolute reductions in baseline MADRS scores. This minimizes the dependency of model results on baseline MADRS scores. Future iterations of the model should incorporate measures of quality of life, functioning, and/or treatment satisfaction to fully capture the many facets of treatment efficacy for TRD.
Conclusion
The adaptation of an existing health state transition model of TRD in this study provided a flexible platform to assess and address uncertainties related to the cost-effectiveness of an early stage TRD product under development relative to the SOC (SSRI + AAP). The relative impacts of a hypothetical monotherapy and the SOC are demonstrated regarding efficacy advantages, tolerability advantages, and price premium. The present model could be useful as new TRD therapies become available, helping researchers to evaluate the efficacy/tolerability improvements required for a successful new TRD product and decision-makers in a marketplace in which payers use cost-effectiveness analysis as a market access criterion.
Acknowledgments
The authors wish to acknowledge editorial support by Jane Kondejewski, PhD, of SNELL Medical Communication, Inc. Financial support for this study was provided entirely by a contract with Takeda Pharmaceuticals International, Inc. The funding agreement ensured the authors’ independence in designing the study, interpreting the data, writing and publishing the report.
Author contributions
All authors contributed equally to the development of the study design, data analysis, and manuscript. All authors contributed toward data analysis, drafting and critically revising the paper, gave final approval of the version to be published, and agreed to be accountable for all aspects of the work.
Disclosure
STW, DM, and SJJ are employees of Medicus Economics, LLC, which received funding from Takeda Pharmaceuticals International, Inc. to conduct this study. AS was an employee of Takeda Pharmaceuticals International, Inc. during study development and completion. STW reports consulting fees from Takeda Pharmaceuticals International, Inc. IMA reports personal fees from Takeda Pharmaceuticals International, Inc. during the conduct of the study, and from Janssen-Cilag, Takeda Pharmaceuticals International, Inc., Otsuka, and Lundbeck, outside the submitted work. DM reports consultant fees from Medicus Economics LLC. SJJ reports personal fees from Takeda Pharmaceuticals International, Inc. The authors report no other conflicts of interest in this work.
References
Mathers CD, Loncar D. Projections of global mortality and burden of disease from 2002 to 2030. PLoS Med. 2006;3(11):e442. | ||
Health & Social Care Information Centre [webpage on the Internet]. Antidepressants show greatest increase in number of prescription items dispensed. NHS Digital; 2016 [cited June 20, 2018]. Available from: http://content.digital.nhs.uk/article/7159/Antidepressants-show-greatest-increase-in-number-of-prescription-items-dispensed. Accessed May 2, 2018. | ||
Berlim MT, Turecki G. Definition, assessment, and staging of treatment-resistant refractory major depression: a review of current concepts and methods. Can J Psychiatry. 2007;52(1):46–54. | ||
Rush AJ, Trivedi MH, Wisniewski SR, et al. Acute and longer-term outcomes in depressed outpatients requiring one or several treatment steps: a STAR*D report. Am J Psychiatry. 2006;163(11):1905–1917. | ||
Trivedi MH, Rush AJ, Wisniewski SR, et al. Evaluation of outcomes with citalopram for depression using measurement-based care in STAR*D: implications for clinical practice. Am J Psychiatry. 2006;163(1):28–40. | ||
Thomas L, Kessler D, Campbell J, et al. Prevalence of treatment-resistant depression in primary care: cross-sectional data. Br J Gen Pract. 2013;63(617):e852–e858. | ||
Mauskopf JA, Simon GE, Kalsekar A, Nimsch C, Dunayevich E, Cameron A. Nonresponse, partial response, and failure to achieve remission: humanistic and cost burden in major depressive disorder. Depress Anxiety. 2009;26(1):83–97. | ||
Mrazek DA, Hornberger JC, Altar CA, Degtiar I. A review of the clinical, economic, and societal burden of treatment-resistant depression: 1996-2013. Psychiatr Serv. 2014;65(8):977–987. | ||
Mccrone P, Killaspy H, Bebbington P, et al. The REACT study: cost-effectiveness analysis of assertive community treatment in North London. Psychiatr Serv. 2009;60(7):908–913. | ||
Thase ME. New medications for treatment-resistant depression: a brief review of recent developments. CNS Spectr. 2017;22(S1):39–48. | ||
Ionescu DF, Rosenbaum JF, Alpert JE. Pharmacological approaches to the challenge of treatment-resistant depression. Dialogues Clin Neurosci. 2015;17(2):111–126. | ||
Minelli C, Baio G. Value of information: a tool to improve research prioritization and reduce waste. PLoS Med. 2015;12(9):e1001882. | ||
Claxton K, Eggington S, Ginnelly L, et al. A pilot study of value of information analysis to support research recommendations for the National Institute for Health and Clinical Excellence. CHE Research Paper 4. London: Centre for Health Economics, University of York; 2005. | ||
Cowen PJ, Anderson IM. New approaches to treating resistant depression. BJPsych Adv. 2015;21(5):315–323. | ||
Cowen PJ. Backing into the future: pharmacological approaches to the management of resistant depression. Psychol Med. 2017;47(15):2569–2577. | ||
Edwards SJ, Hamilton V, Nherera L, Trevor N. Lithium or an atypical antipsychotic drug in the management of treatment-resistant depression: a systematic review and economic evaluation. Health Technol Assess. 2013;17(54):1–190. | ||
Montgomery SA, Asberg M. A new depression scale designed to be sensitive to change. Br J Psychiatry. 1979;134(4):382–389. | ||
Thase ME, Corya SA, Osuntokun O, et al. A randomized, double-blind comparison of olanzapine/fluoxetine combination, olanzapine, and fluoxetine in treatment-resistant major depressive disorder. J Clin Psychiatry. 2007;68(2):224–236. | ||
Corya SA, Williamson D, Sanger TM, Briggs SD, Case M, Tollefson G. A randomized, double-blind comparison of olanzapine/fluoxetine combination, olanzapine, fluoxetine, and venlafaxine in treatment-resistant depression. Depress Anxiety. 2006;23(6):364–372. | ||
Shelton RC, Williamson DJ, Corya SA, et al. Olanzapine/fluoxetine combination for treatment-resistant depression: a controlled study of SSRI and nortriptyline resistance. J Clin Psychiatry. 2005;66(10):1289–1297. | ||
Shelton RC, Tollefson GD, Tohen M, et al. A novel augmentation strategy for treating resistant major depression. Am J Psychiatry. 2001;158(1):131–134. | ||
Fekadu A, Wooderson SC, Rane LJ, Markopoulou K, Poon L, Cleare AJ. Long-term impact of residual symptoms in treatment-resistant depression. Can J Psychiatry. 2011;56(9):549–557. | ||
Office for National Statistics [webpage on the Internet]. Consumer price inflation time series dataset. 2017 [cited June 20, 2018]. Available from: https://www.ons.gov.uk/economy/inflationandpriceindices/datasets/consumerpriceindices. Accessed March 1, 2017. | ||
McCrea RL, Sammon CJ, Nazareth I, Petersen I. Initiation and duration of selective serotonin reuptake inhibitor prescribing over time: UK cohort study. Br J Psychiatry. 2016;209(5):421–426. | ||
Joint Formulary Committee [homepage on the Internet]. British National formulary (online); 2017. Available from: http://www.medicinescomplete.com. Accessed March 24, 2017. | ||
Sapin C, Fantino B, Nowicki ML, Kind P. Usefulness of EQ-5D in assessing health status in primary care patients with major depressive disorder. Health Qual Life Outcomes. 2004;2(1):20. | ||
Malhi GS, Byrow Y. Is treatment-resistant depression a useful concept? Evid Based Mental Health. 2016;19(1):1–3. | ||
Greden JF. The burden of disease for treatment-resistant depression. J Clin Psychiatry. 2001;62(Suppl 16):26–31. | ||
Nemeroff CB. Prevalence and management of treatment-resistant depression. J Clin Psychiatry. 2007;68(Suppl 8):17–25. | ||
Mcintyre RS, Filteau MJ, Martin L, et al. Treatment-resistant depression: definitions, review of the evidence, and algorithmic approach. J Affect Disord. 2014;156:1–7. | ||
Conway CR, George MS, Sackeim HA. Toward an evidence-based, operational definition of treatment-resistant depression: when enough is enough. JAMA Psychiatry. 2017;74(1):9–10. | ||
Kubitz N, Vossen C, Papadimitropoulou K, Karabis A. The prevalence and disease burden of treatment-resistant depression – a systematic review of the literature. Value Health. 2014;17(7):A455–A456. | ||
Meads CA, Cnossen JS, Meher S, et al. Methods of prediction and prevention of pre-eclampsia: systematic reviews of accuracy and effectiveness literature with economic modelling. Health Technol Assess. 2008;12(6):iii-iv,1–270. | ||
Department of Health and Social Care [webpage on the Internet]. Reference costs 2010-2011. 2011 Nov [cited June 20, 2018]. Available from: https://www.gov.uk/government/publications/2010-11-reference-costs-publication. Accessed March 27, 2017. | ||
National Collaborating Centre for Mental Health (UK). National Institute for Health and Clinical Excellence: Guidance. Bipolar Disorder: The Management of Bipolar Disorder in Adults, Children and Adolescents, in Primary and Secondary Care. Leicester, UK: The British Psychological Society & The Royal College of Psychiatrists; 2006. | ||
Curtis L. Unit Costs of Health & Social Care 2011. Canterbury: Personal Social Services Research Unit; 2011. | ||
Kessler RC. The costs of depression. Psychiatr Clin North Am. 2012;35(1):1–14. |
Supplementary materials
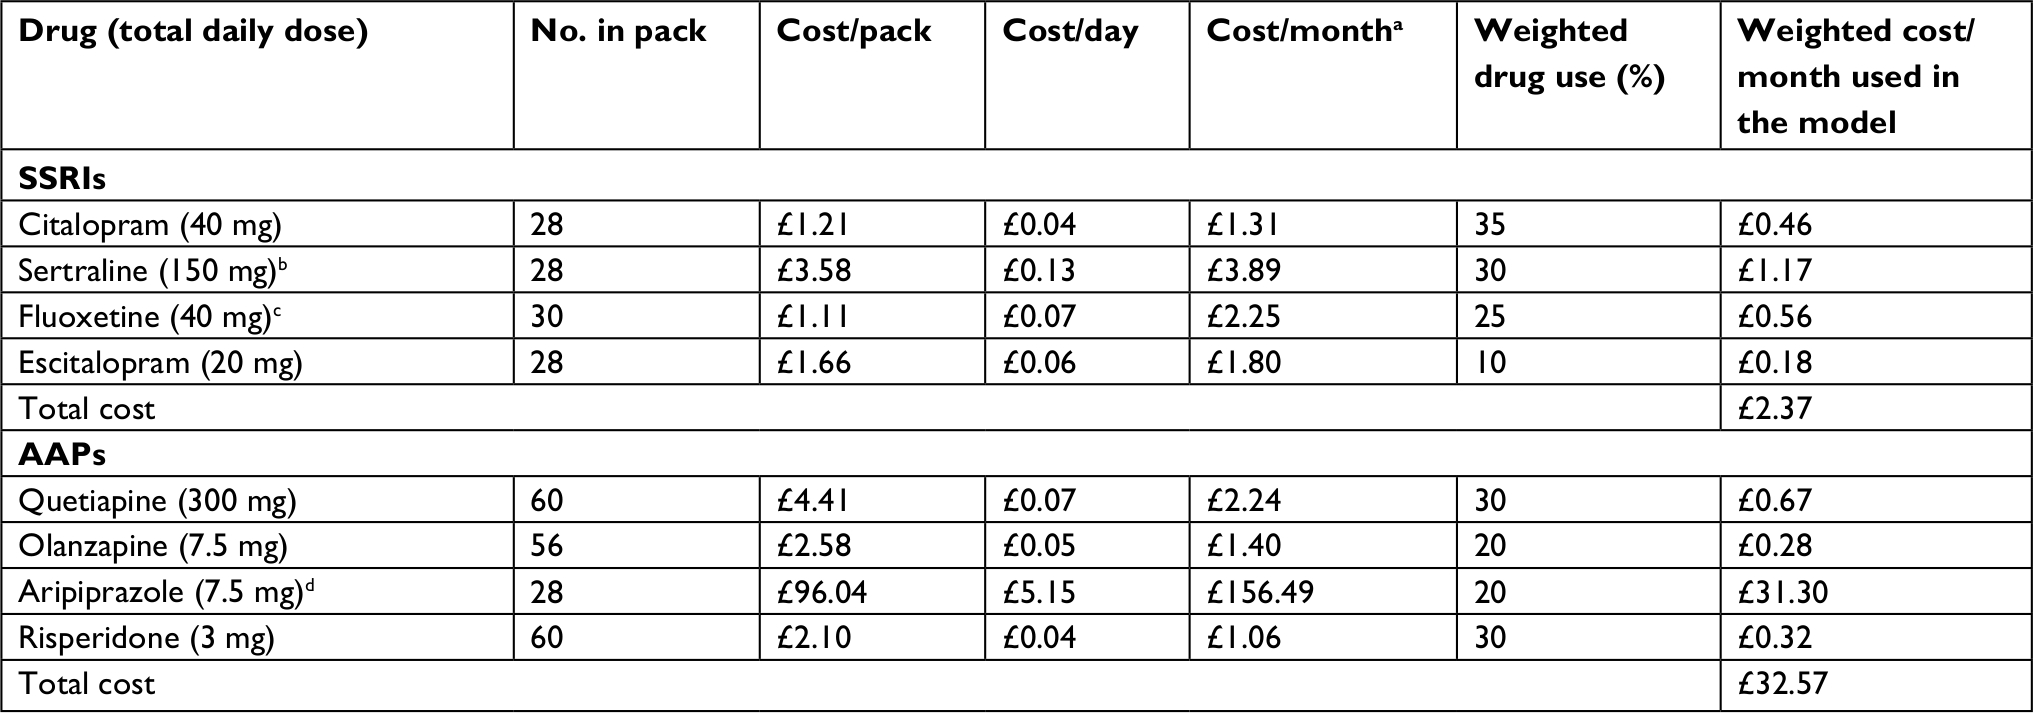 | Table S1 Commonly prescribed drugs and the weighted monthly costs used in the model Notes: Price per month of SSRI + AAP in the model: £2.37+£32.57=£34.94. aCalculations based on 1 month =365/12 =30.417 days. bAssume taken as one 100 mg and one 50 mg tablet per day, costing £1.75 and £1.83 per 28-tab pack, respectively. cAssume taken as two 20 mg capsules per day. dAssume taken as one and a half 5 mg tablets per day. Abbreviations: AAP, atypical antipsychotics; SSRI, selective serotonin reuptake inhibitors. |
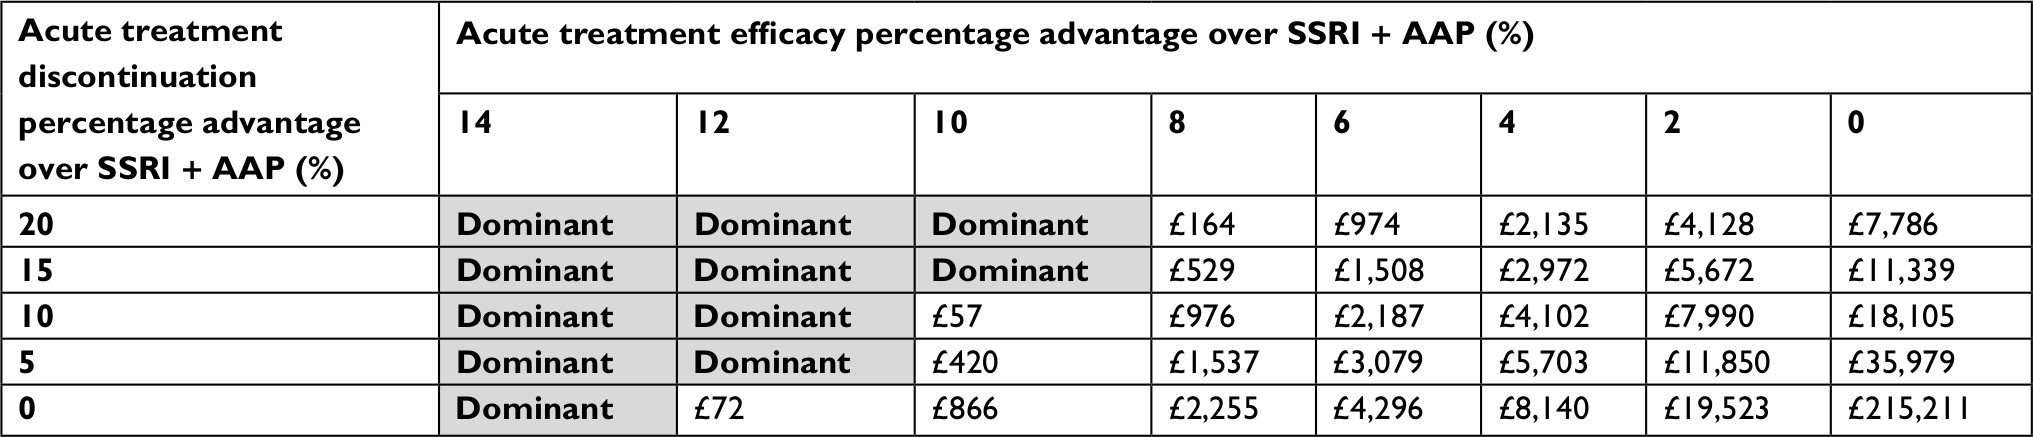 | Table S2 ICUR of the hypothetical monotherapy for different combinations of acute treatment discontinuation and efficacy percentage advantages over SSRI + AAP Note: Results were based on a 50% price premium of the hypothetical monotherapy over SSRI + AAP. Abbreviations: AAP, atypical antipsychotics; ICUR, incremental cost-utility ratio; SSRI, selective serotonin reuptake inhibitors. |
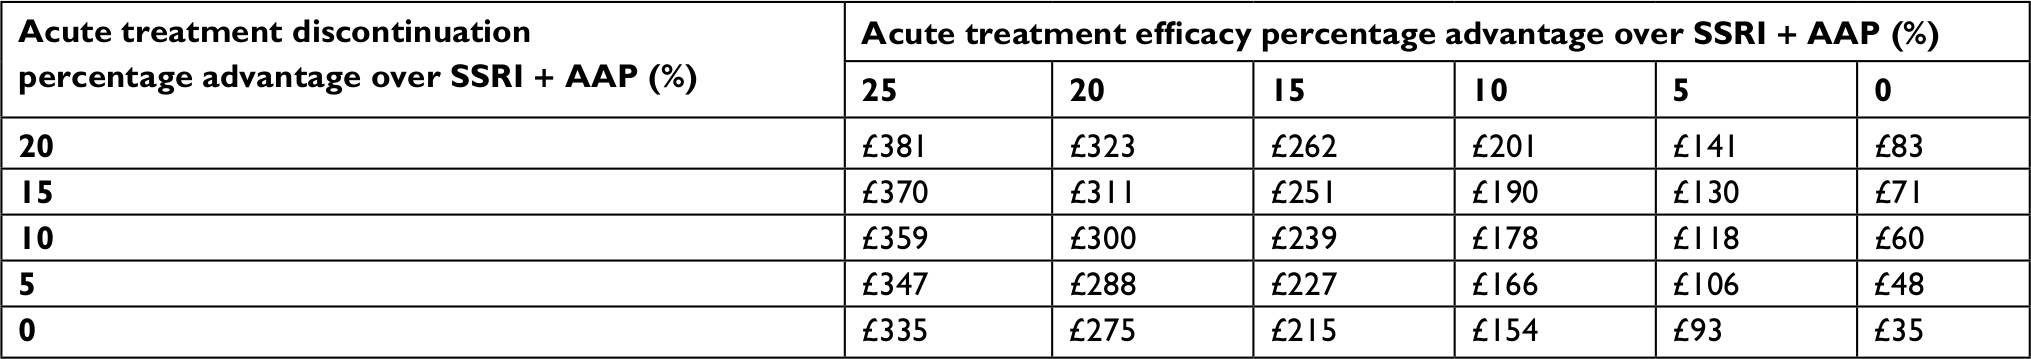 | Table S3 Optimal monthly prices of the hypothetical monotherapy for different combinations of acute treatment discontinuation and efficacy percentage advantages over SSRI + AAP at WTP per QALY of £30,000 Abbreviations: AAP, atypical antipsychotics; QALY, quality-adjusted life years; SSRI, selective serotonin reuptake inhibitors; WTP, willingness-to-pay. |
 © 2019 The Author(s). This work is published and licensed by Dove Medical Press Limited. The
full terms of this license are available at https://www.dovepress.com/terms
and incorporate the Creative Commons Attribution
- Non Commercial (unported, 3.0) License.
By accessing the work you hereby accept the Terms. Non-commercial uses of the work are permitted
without any further permission from Dove Medical Press Limited, provided the work is properly
attributed. For permission for commercial use of this work, please see paragraphs 4.2 and 5 of our Terms.
© 2019 The Author(s). This work is published and licensed by Dove Medical Press Limited. The
full terms of this license are available at https://www.dovepress.com/terms
and incorporate the Creative Commons Attribution
- Non Commercial (unported, 3.0) License.
By accessing the work you hereby accept the Terms. Non-commercial uses of the work are permitted
without any further permission from Dove Medical Press Limited, provided the work is properly
attributed. For permission for commercial use of this work, please see paragraphs 4.2 and 5 of our Terms.