Back to Journals » ClinicoEconomics and Outcomes Research » Volume 10
Cost-consequence model comparing eltrombopag versus romiplostim for adult patients with chronic immune thrombocytopenia
Authors Tremblay G, Dolph M, Bhor M ![]() , Said Q, Elliott B
, Said Q, Elliott B ![]() , Briggs A
, Briggs A ![]()
Received 15 June 2018
Accepted for publication 15 August 2018
Published 1 November 2018 Volume 2018:10 Pages 705—713
DOI https://doi.org/10.2147/CEOR.S177324
Checked for plagiarism Yes
Review by Single anonymous peer review
Peer reviewer comments 2
Editor who approved publication: Prof. Dr. Dean Smith
Gabriel Tremblay,1 Mike Dolph,1 Menaka Bhor,2 Qayyim Said,2 Brian Elliott,2 Andrew Briggs3
1Department of Health Economics, Purple Squirrel Economics, New York, NY, USA; 2Department of Health Economics and Outcomes Research, Novartis Pharmaceuticals, East Hanover, NJ, USA; 3William R. Lindsay Chair of Health Economics, University of Glasgow, Glasgow, Scotland, UK
Background: Thrombopoietin-receptor agonists eltrombopag (EPAG) and romiplostim (ROMI) are treatment options for adults with chronic immune thrombocytopenia (cITP) who have had an insufficient response to corticosteroids or immunoglobulins.
Methods: A cost-consequence model was developed to evaluate the costs relative to treatment success of EPAG, ROMI, and watch and rescue (W&R) in previously treated patients. The primary endpoint assessed was severe bleeding, derived from all identified phase III registered clinical trials. Health outcomes were compared via indirect treatment comparison. Costs incorporated in the model included drug and administration, routine care, rescue medications, bleeding-related adverse events, other adverse events, and mortality costs. A trial (26-week) time horizon was used, as certain endpoints used in the model were bound to within-trial results.
Results: In the intent-to-treat (ITT) population, the overall estimated cost per patient for EPAG was US$66,560 compared to US$91,039 for ROMI and US$30,099 for W&R. Compared to the ITT population, the difference in cost between EPAG and ROMI was slightly greater in splenectomized patients (US$65,998 for EPAG compared to US$91,485 for ROMI) and slightly less in non-splenectomized patients (US$67,151 for EPAG compared to US$91,455 for ROMI), though the overall trend remained the same. When assessing cost per severe bleeding event avoided in the ITT population, EPAG dominated (less expensive, more effective) ROMI. Sensitivity analyses confirmed these results.
Conclusion: EPAG was preferred over ROMI in the treatment of cITP, largely driven by the reduction in severe bleeding events associated with its use.
Keywords: chronic immune thrombocytopenia, eltrombopag, romiplostim, cost consequence, cost analysis, USA
Introduction
Immune thrombocytopenia (ITP) is an autoimmune disorder characterized by low platelet counts and an increased risk of bleeding. Based on best estimates, the age-adjusted prevalence of ITP in the US is estimated at about 9.5/100,000 persons,1 with an annual incidence of 3.3 per 100,000 adults,2 or ~3,900–9,500 new cases diagnosed in the US each year.3 A recent study based on US administrative claims data found a median age at diagnosis of 53 years.3
Individuals with chronic immune thrombocytopenia (cITP) can have an increased risk of bleeding due to reduced platelet counts. This typically manifests as minor bleeding (eg, petechiae or bruising of skin, bleeding from nose or gums,), although major bleeding can occur.4 To prevent such bleeding episodes, most therapies aim to increase platelet counts. Thrombopoietic-receptor agonists (TPO-RAs), such as eltrombopag (EPAG) and romiplostim (ROMI), accomplish this by stimulating platelet production.5 In the US, both are indicated for the treatment of cITP in adults who have had inadequate response to other therapies, including corticosteroids, immunoglobulins, and splenectomy.6
Several studies have assessed the cost per responder of ROMI,7–10 although they did not compare these costs to EPAG and were not in a US setting. To date, there have been no head-to-head clinical trials comparing EPAG and ROMI, and few indirect treatment comparisons (ITCs) have been developed to assess the efficacy and safety of these therapies (eg, Allen et al11).
It is important to understand the cost consequences of utilizing different second-line options for the treatment of cITP. One study12 has described a cost per response analysis comparing EPAG to ROMI and “watch and rescue” (W&R) and found TPO-RAs to be efficient in achieving treatment success with lower costs per treatment success.
However, additional studies are required to better understand current utilization, effectiveness of treatment modalities, and the impact of clinical outcomes on cITP. Here, we present the results of a cost-consequence model that compared EPAG to ROMI and W&R among previously treated adult patients in the US.
Materials and methods
Model perspective, patient populations, and horizon/discounting
A general US payer’s perspective and a time horizon of 26 weeks were used. The population consisted of adult patients with cITP who had an insufficient response to corticosteroids, immunoglobulins, or splenectomy. As splenectomy status is a key prognostic factor in ITP,13,14 cost-consequence results for splenectomized and non-splenectomized patients were also reported separately. The trial data cutoff (26 weeks) was used for the time horizon, as certain endpoints used in the model are bound to within-trial results. This also allows the use of direct evidence from the published literature without relying on extrapolation techniques that require additional assumptions. Discounting was not applied, as the model horizon was <1 year. An overview is presented in Figure 1.
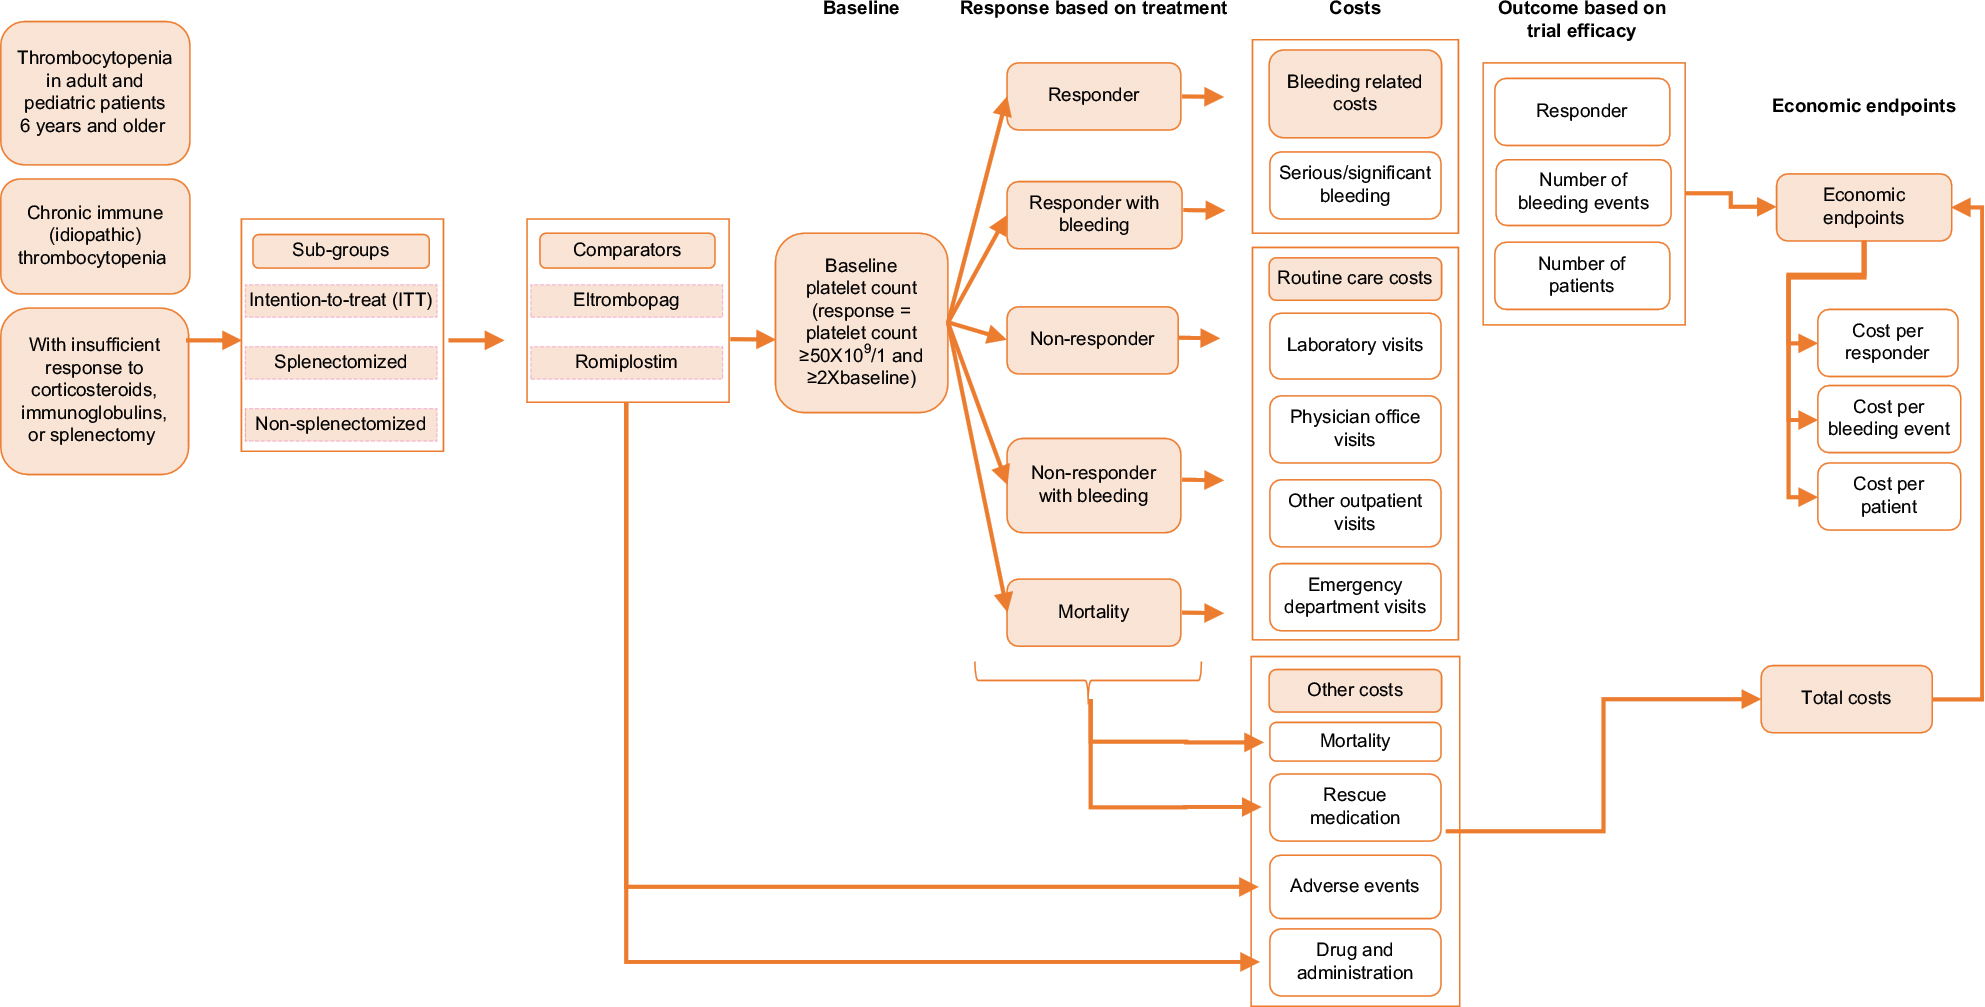 | Figure 1 Model overview. |
Comparators
After performing a targeted literature review, EPAG and ROMI, along with W&R (placebo), were determined to be included as comparators. The respective trials’ placebo groups constituted W&R, as these patients only received rescue therapy as needed. Rituximab and splenectomy, while common treatment options for ITP, were not included as comparators due to significant noncomparability between the trial populations.
Efficacy and dosing data were derived from one clinical trial for EPAG (Cheng et al5) and one trial for ROMI (Kuter et al18).
We performed an ITC that assessed severe bleeding events as the primary endpoint. Severe bleeding (WHO grade 3–5) was chosen as the primary endpoint for three main reasons: 1) complete data on severe bleeding were reported for both clinical trials; 2) bleeding, unlike endpoints such as platelet response, has direct, tangible, clinical, and economic consequences; and 3) severe bleeding is associated with the most serious clinical ramifications in cITP.
ITC
An ITC was performed between EPAG and ROMI, using placebo as the treatment anchor. By design, the two included studies (Cheng et al5 for EPAG and Kuter et al19 for ROMI) had similar baseline characteristics. The most notable differences at baseline were in the proportion of splenectomized patients (36% in the EPAG trial vs 50% in the ROMI trial), the proportion of patients who had received three or more prior ITP medications (54% in the EPAG trial vs 63% in the ROMI trial), and the proportion of patients receiving concomitant medications (48% in the EPAG trial vs 31% in the ROMI trial).
The designs of the two trials were deemed acceptably comparable, but several differences were noted: the EPAG trial did not allow tapering of concomitant ITP medication during the first 6 weeks of treatment, while the ROMI trial allowed dose reduction or discontinuation of ITP medications during the first 12 weeks of treatment, which may have impacted platelet response. The definitions of platelet response differed slightly between the two studies: in Cheng et al,5 platelet counts >400,000/µL were not considered a response, while they were in Kuter et al.19
Rescue treatment duration assumptions varied between the two studies, as Cheng et al5 assumed that rescue treatment continued until platelet counts returned to normal levels and Kuter et al19 assumed that rescued treatment continued for a fixed period of 8 weeks. Overall, the two trials were considered comparable enough to satisfy the transitivity assumption.
Using ITC, ROMI efficacy data were adjusted to match the EPAG trial. Therefore, EPAG and W&R (no drug treatment) efficacy data were taken directly from the trial,20 while the ROMI data (from Kuter et al19) were adjusted. Frequentist ITC was used, and 95% confidence intervals were calculated. ROMI results were pooled using random-effects models (Mantel–Haenszel method), which generated ORs for ROMI vs placebo. Classical frequentist ITC was implemented using the Bucher (1997) method and 95% CIs.21
Patient flow
Patient flow in the model was based on epidemiology estimates for the US population, presented in Table 1. Annual population growth rate for patient flow was assumed to be 0.79%.22
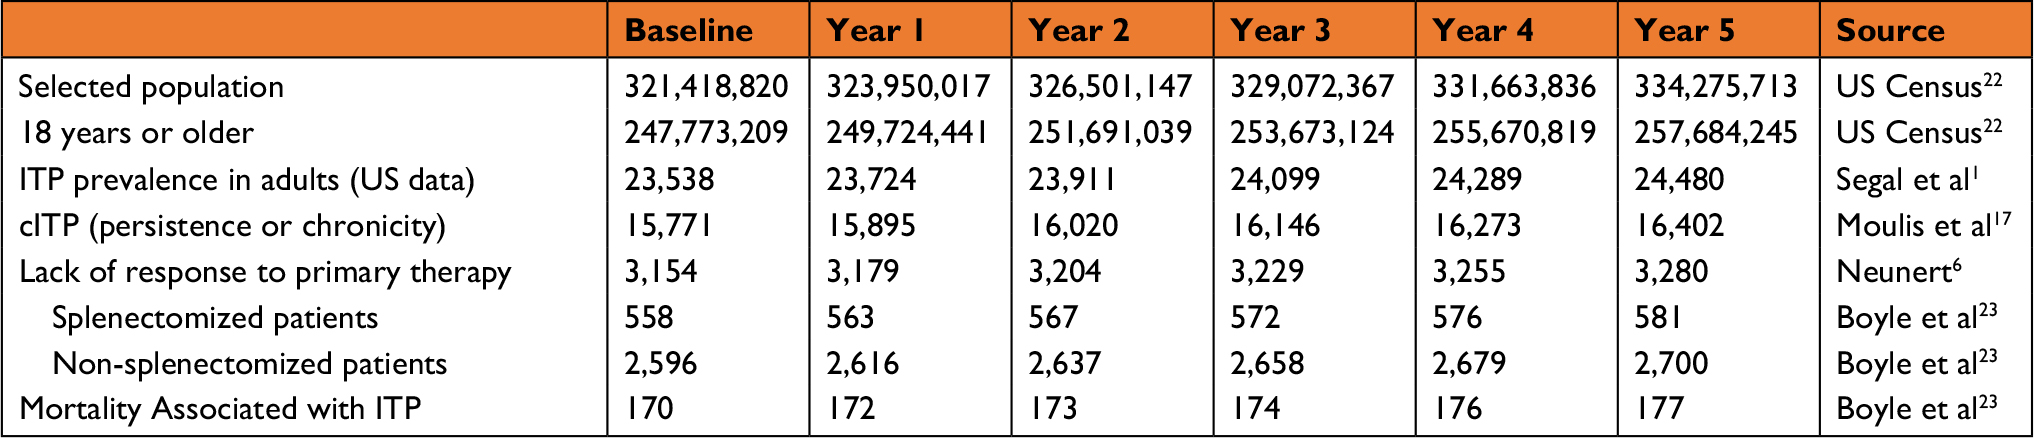 | Table 1 Patient flow Abbreviations: ITP, immune thrombocytopenia; cITP, chronic immune thrombocytopenia. |
Efficacy measures
A summary of the efficacy values and the resulting odds ratios for treatment vs EPAG in all patients, as well as spenectomized and non-splenectomized patient groups, from the respective clinical trials, is presented in Table S1. As was mentioned, these raw values were not used in the model and were instead matched through ITC by adjusting the ROMI efficacy data to match the placebo (W&R) group in the EPAG trial. Therefore, W&R results and EPAG results used in the model are identical to those of the EPAG trial, while the efficacy results for ROMI are adjusted.
The primary efficacy measure was severe bleeding (WHO grades 3–5). The WHO bleeding scale used in the trials (ranging from 1 to 5) is the most commonly applied criteria in thrombocytopenia and was considered as a valid measure.24
While platelet response is a commonly used primary endpoint in ITP, it was not assessed in this analysis. It should be noted that the correlation between platelet response and bleeding events has not been well characterized and may not be a perfect association.15 While platelet count defines the diagnosis and is used to evaluate response to therapy in ITP, management decisions are driven by the prevention or treatment of bleeding. Therefore, bleeding is ultimately the most important endpoint to both patients and decision makers15 and was therefore considered to be the most important endpoint in our analysis.
Severe bleeding was explored further by calculating the cost-effectiveness per severe bleeding event avoided (presented in the “Results” section).
Costs
Total costs associated with each treatment were based on the sum of drug costs, bleeding-related costs, routine care, drug administration, rescue medications, adverse events (all grades presenting in >20% of patients in at least one of the included trials), and mortality costs. The proportion of patients requiring these resources in each treatment arm was derived from the respective clinical trials,18,25 if available, or from other published literature (Table 2). In addition to the ITT population, splenectomized and non-splenectomized subgroups were assessed.
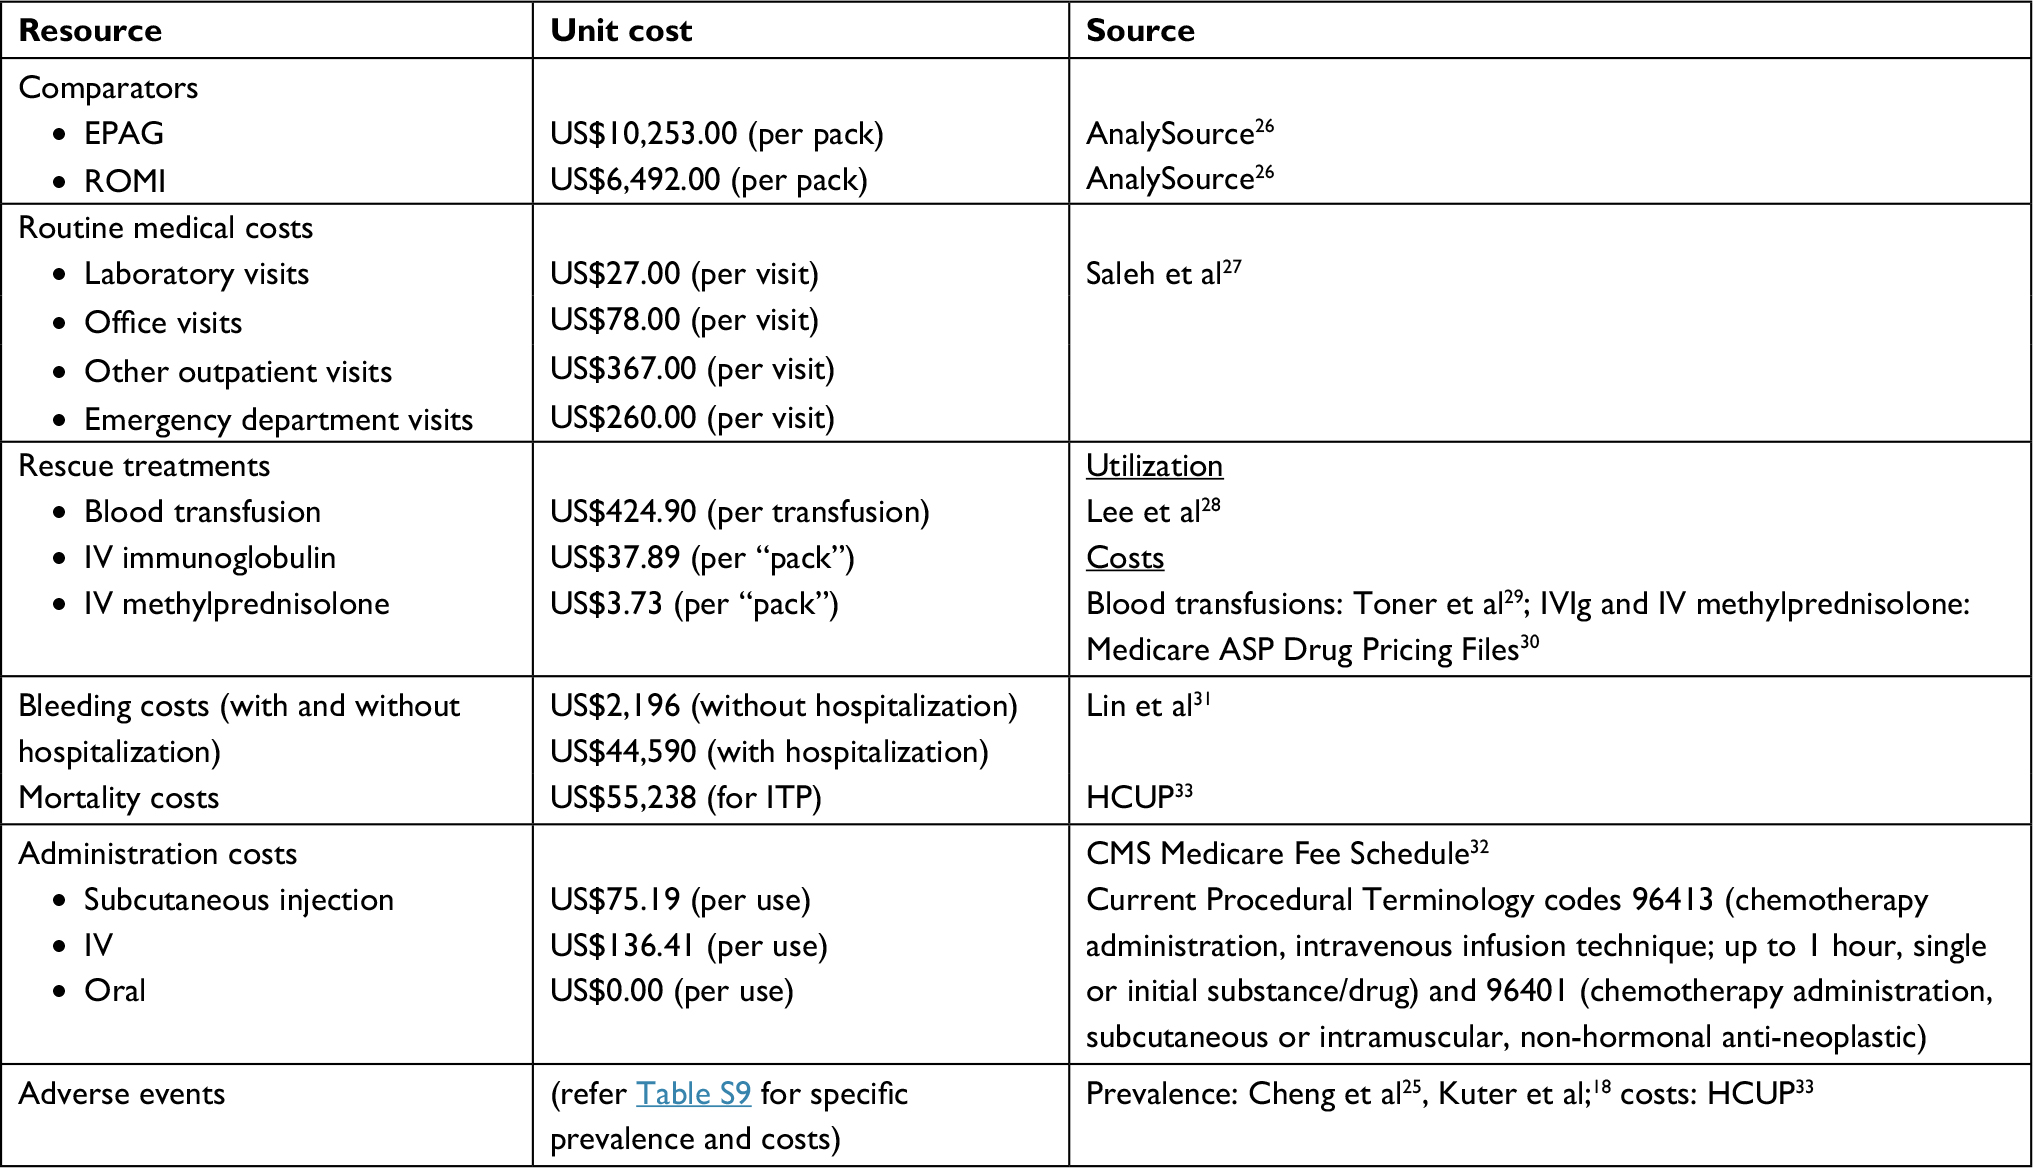 | Table 2 Resource use sources Notes: All costs are reported in USD. No currency conversion was required, as all cost data were derived from US-based sources. US inflation (3.6%) was applied when no current (2016) cost data were available.35 Abbreviations: ASP, average selling price; EPAG, eltrombopag; ROMI, romiplostim; IV, Intravenous; IVIg, intravenous immunoglobulin; ITP, immune thrombocytopenia; HCUP, Healthcare Cost and Utilization Project. |
To account for the fact that the available pack sizes of drugs may not allow for the exact dose of drug required, wastage was applied for dose calculations based on the received doses (ie, doses were rounded up to the nearest pack/vial size when necessary). Wastage and dose reductions were only included for the primary therapies (EPAG and ROMI). A breakdown of the cost calculations are presented in Tables S2–S4.
Included costs were summed to obtain the total cost associated with each primary therapy. Resources used in the analysis and their sources are summarized in Table 2.
Probabilistic sensitivity analyses (PSAs)
Uncertainty in the results was assessed with PSAs, where probabilistic distributions were directly applied to the base case model for the ITT, splenectomized, and non-splenectomized populations. All efficacy and cost parameters were explored in the PSA and are presented in the “Results” section.
Results
The summed overall costs and efficacy results for each primary therapy are shown in Table 3. Specific costs and the raw efficacy data from the clinical trials are presented in Tables S3–S10. As was mentioned, efficacy data from the ITC were used in the model, where the ROMI efficacy data was adjusted to match the placebo (W&R) group to the EPAG trial. Therefore, W&R results and EPAG results used in the model are identical to those of the EPAG trial, while the efficacy results for ROMI are adjusted (as described earlier). After ITC, severe bleeding rates in ROMI-treated patients decreased to 3.7% from the 7.1% reported in the trial, as the placebo group in the Kuter et al19 study experienced a higher severe bleeding rate than that in the EPAG trial.5
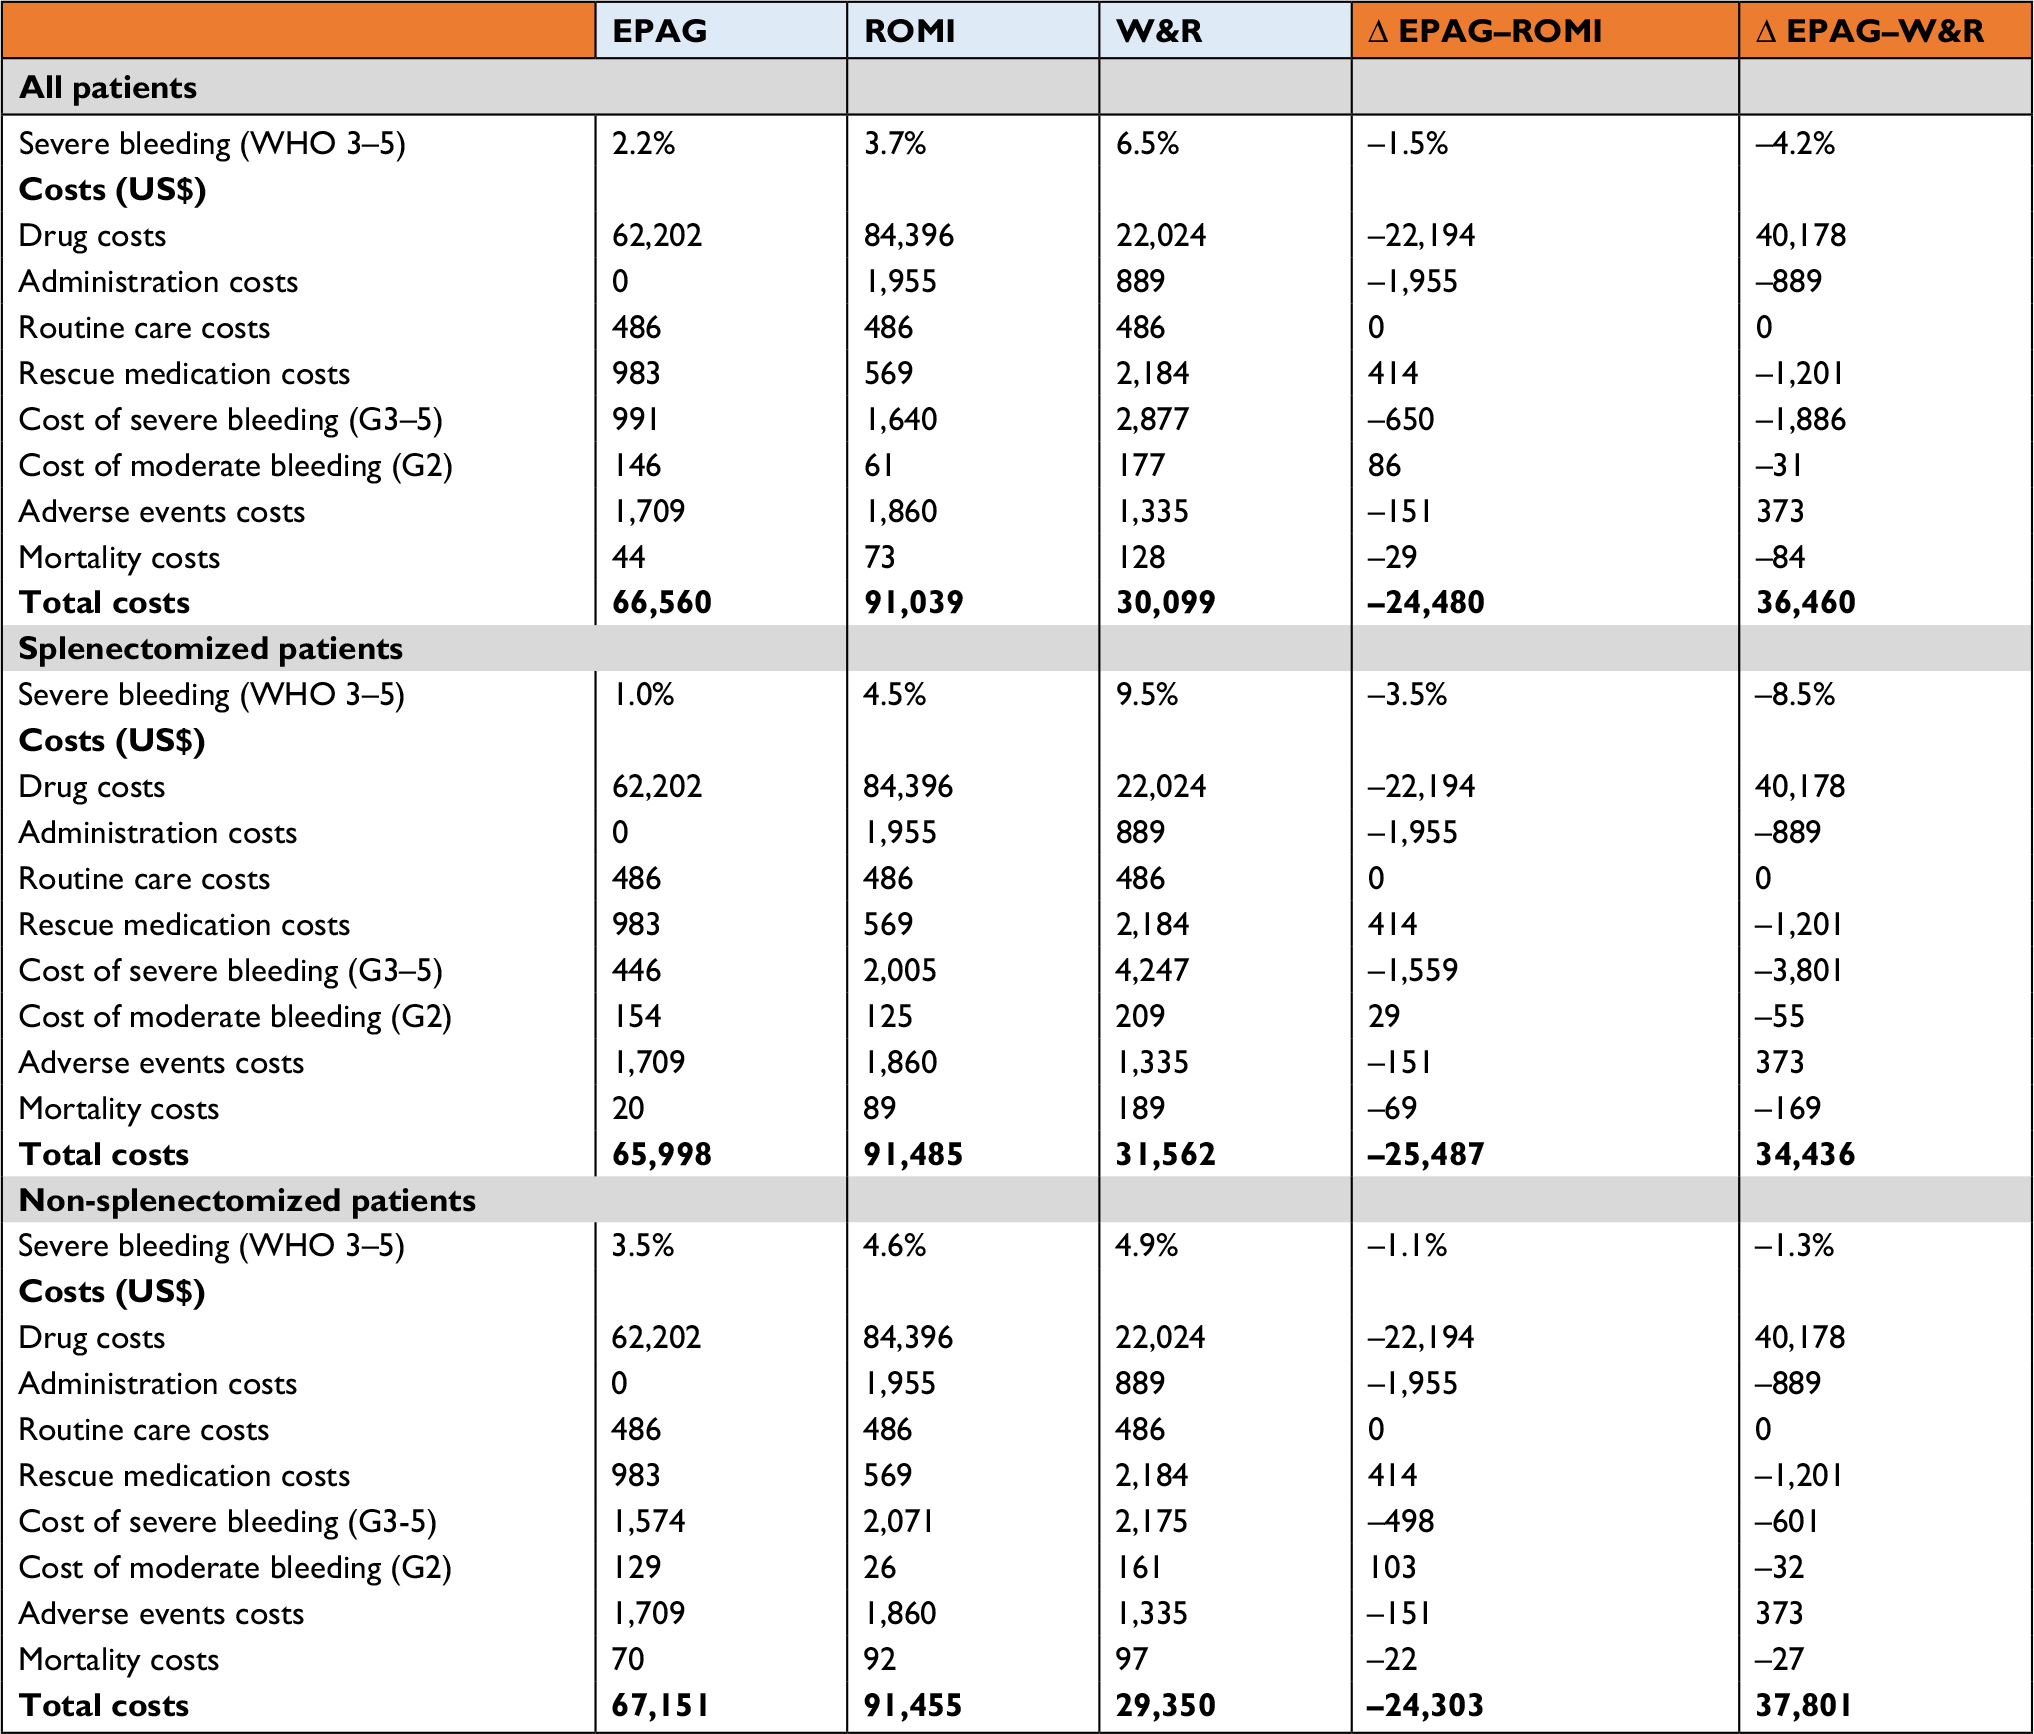 | Table 3 Efficacy and costs Note: All costs are reported in USD. Abbreviations: EPAG, eltrombopag; ROMI, romiplostim; W&R, watch and rescue. |
In the ITT populations, EPAG, ROMI, and W&R had total estimated costs of US$66,560, US$91,039, and US$30,099, respectively. In this population, EPAG was estimated to cost US$24,480 (26.9%) less than ROMI. Compared with W&R, EPAG costs US$36,460 (121.1%) more, while ROMI costs US$60,940 (202.5%) more.
In the splenectomized population, EPAG was estimated to cost US$25,487 (27.9%) less than ROMI. Compared with W&R, EPAG cost US$34,436 (109.1%) more, while ROMI cost US$59,923 (189.9%) more. When assessing non-splenectomized patients, the cost difference between EPAG and ROMI was reduced, with EPAG estimated to cost US$24,303 (26.6%) less than ROMI. Compared with W&R, EPAG cost US$37,801 (128.8%) more, while ROMI cost US$62,104 (211.6%) more.
Drug costs comprised the vast majority of the price for all comparators.
In the analysis of severe bleeding, EPAG showed a 1.5% incremental benefit (1.66-fold improvement) over ROMI and a 4.2% benefit (2.90-fold improvement) over W&R in the ITT population, while ROMI showed an incremental benefit of 2.8% (1.75-fold improvement) over W&R. In splenectomized patients, these differences were exaggerated, with EPAG showing a 3.5% incremental benefit (4.50-fold improvement) over ROMI and an 8.5% benefit (9.52-fold improvement) over W&R and ROMI showing an incremental benefit of 5.0% (2.12-fold improvement) over W&R. In non-splenectomized patients, the differences were tempered, as EPAG showed a 1.1% incremental benefit (1.32-fold improvement) over ROMI and a 1.3% benefit (1.38-fold improvement) over W&R. ROMI showed an incremental benefit of 0.2% (1.05-fold improvement) over W&R when assessing severe bleeding in non-splenectomized patients.
Incremental cost-effectiveness ratios (ICERs; Table 4) were derived to further explore cost per severe bleeding event. When assessing cost per severe bleeding avoided in the ITT population, EPAG dominated ROMI and had an ICER of US$862,071 when compared to W&R, while ROMI had an ICER of US$2,197,935 compared to W&R. In splenectomized patients, EPAG again dominated ROMI and had a reduced ICER of US$403,994 when compared with W&R, while ROMI had a reduced ICER of US$1,192,142 compared with W&R. With regard to non-splenectomized patients, EPAG again dominated ROMI, with an increased ICER of US$2,802,913 when compared with W&R, while ROMI had a more greatly increased ICER of US$26,696,956 compared with W&R.
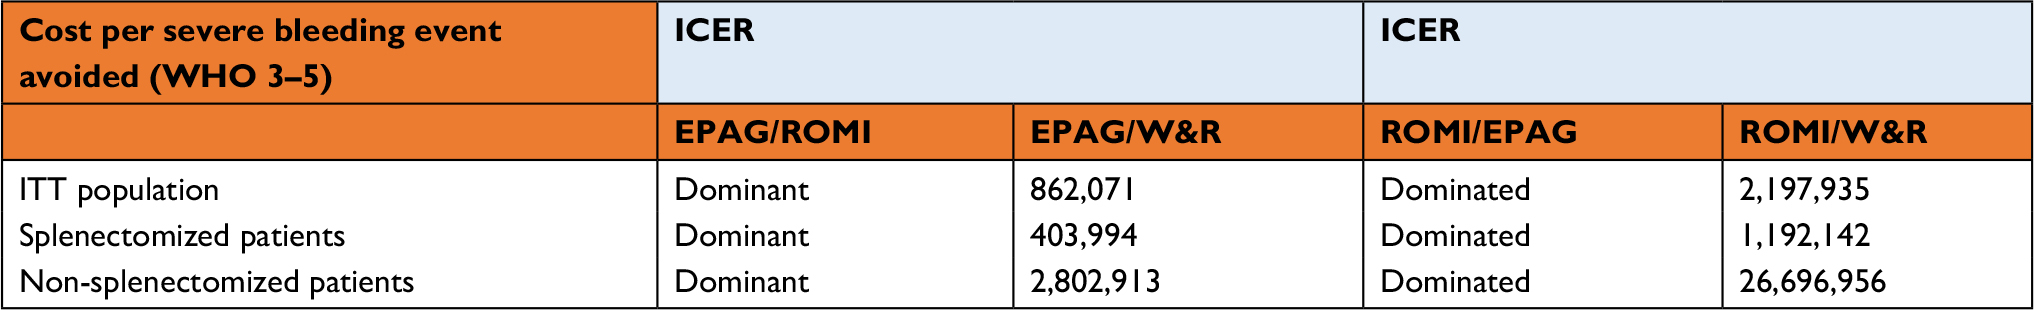 | Table 4 ICERs for severe bleeding events avoided Abbreviations: ICER, incremental cost-effectiveness ratio; EPAG, eltrombopag; ROMI, romiplostim; W&R, watch and rescue; ITT, intent to treat. |
Sensitivity analyses
Uncertainty in the cost-effectiveness results for severe bleeding events avoided was assessed with PSAs. Deterministic sensitivity analyses were also intended to assess incremental cost-effectiveness for severe bleeding. However, these analyses were not feasible because EPAG was dominant over ROM I for severe bleeding and therefore the relevant base case ICER was unavailable.
For the PSA, probabilistic distributions were directly applied to the base case model for the ITT population. The parameters explored in the PSA are presented in Table 5. Point estimates and standard errors (SEs) were from the respective clinical trials.
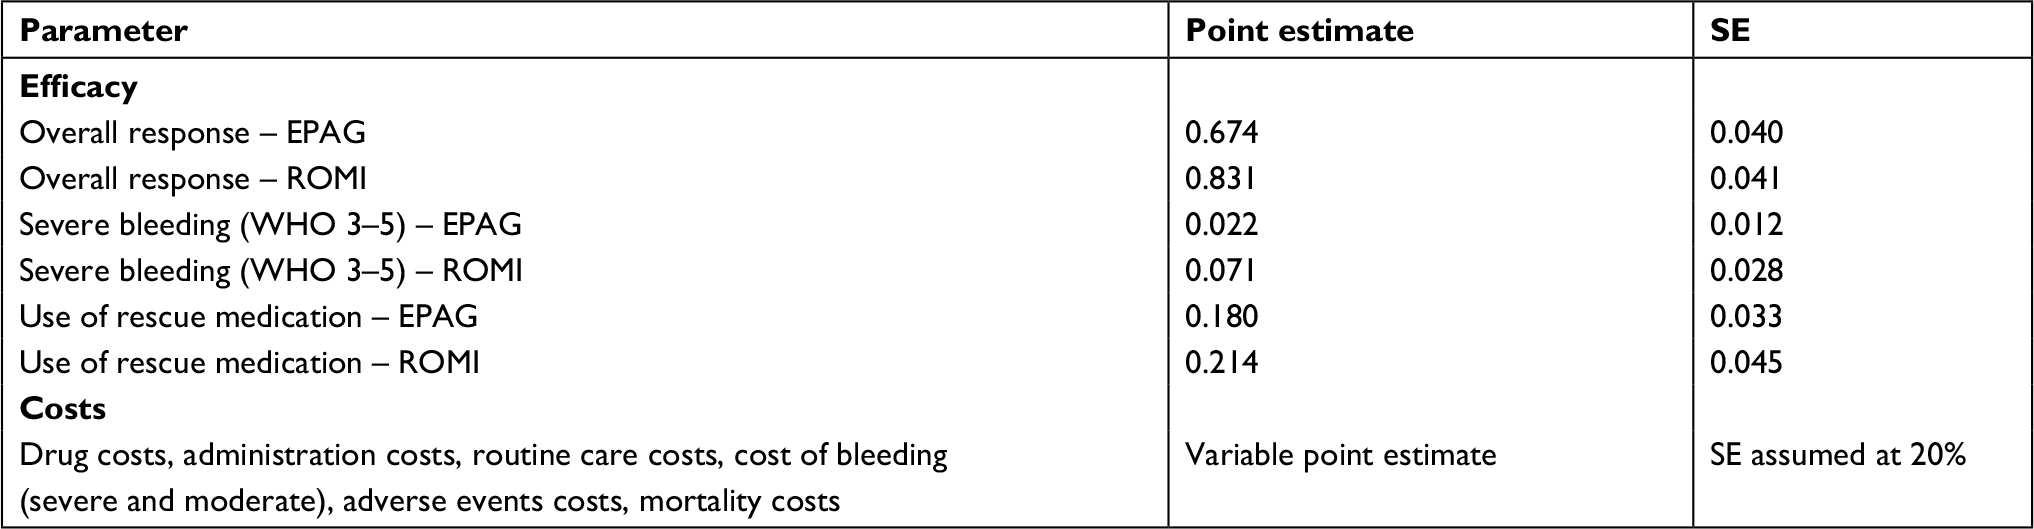 | Table 5 PSA parameters (ITT population) Abbreviations: PSA, probabilistic sensitivity analysis; ITT, intent to treat; SE, standard error; EPAG, eltrombopag; ROMI, romiplostim. |
PSA results were relatively consistent with the base case findings, where the majority of iterations were located in the southwest quadrant showing greater EPAG efficacy, with a lower EPAG cost (Figure 2).
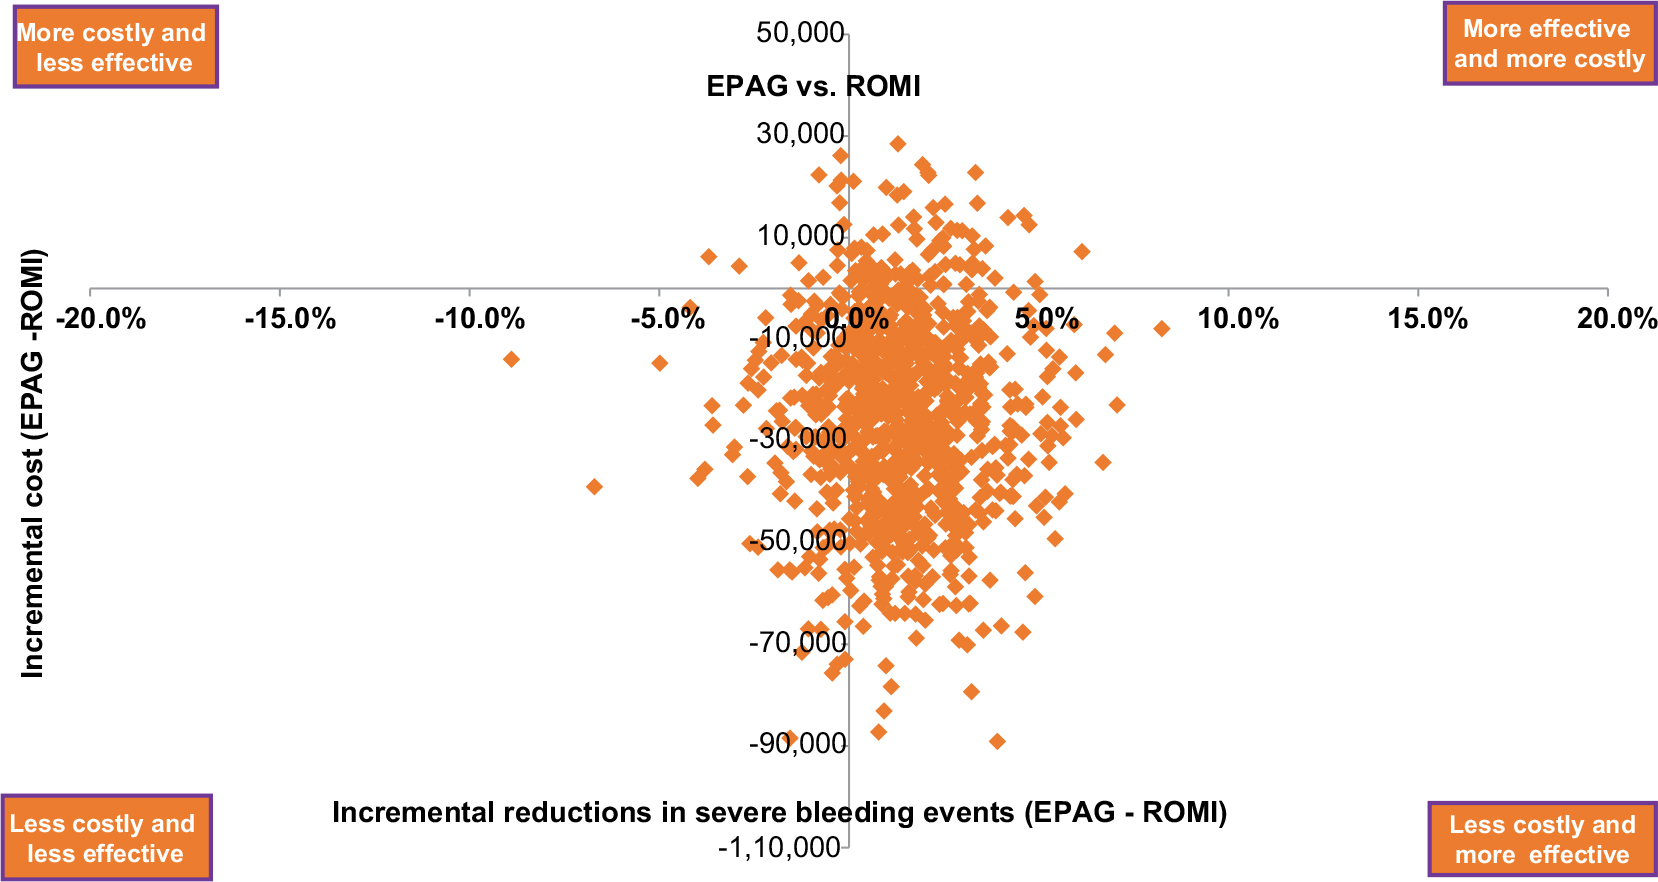 | Figure 2 Cost-effectiveness plane (EPAG vs ROMI). Abbreviations: EPAG, eltrombopag; ROMI, romiplostim. |
Discussion
The previous cost-consequence model comparing EPAG to ROMI12 found that costs per responder for EPAG, ROMI, and W&R were US$64,314, US$58,990, and US$118,314, respectively. However, key limitations in this analysis were identified.
In the analysis by Li et al,12 epidemiology estimates for patient flow were not presented. Additionally, there was no formal comparison of trial, population, or settings to determine if proper comparators were used. Instead, naïve analyses were used to compare the trial data, and no assessment was made to ensure the trials were comparable. When a deviation from the transitivity assumption exists, a model based on an ITC is more likely to validly compare clinical trial data.34
Further limiting the Li et al12 analysis, adverse event and mortality costs were not included, and the only endpoint included was cost per responder based on platelet count (which is a problematic endpoint when determining any sort of clinical or economic benefit, as response is not necessarily associated with tangible implications). Additionally, wastage analysis was not presented. Finally, no sensitivity analyses were performed to explore the uncertainty of their results. These gaps were all addressed in the present study.
In our model, following ITC adjustment, the rate of severe bleeding in EPAG was 2.2% compared to 3.7% with ROMI, which accounted for the difference in bleeding-related costs. In the ITT population, EPAG, ROMI, and W&R had total estimated costs of US$66,560, US$91,039, and US$30,099, respectively, with drug costs comprising most of the price for all comparators. The lower total cost of EPAG and higher severe bleeding events avoided led EPAG to dominate ROMI. When compared to W&R in our assessment, EPAG had a higher total cost and a resulting ICER of US$862,071 per severe bleeding event avoided. When assessing subgroups in our analysis, EPAG generally showed the most favorable results in the splenectomized population subgroup, dominating ROMI for severe bleeding event avoided. PSA results were relatively consistent with the base case findings.
Our study had several limitations. Because of inconsistent reporting in the literature, endpoint definitions in the trials varied occasionally, making direct matching and data selection challenging. Rituximab and splenectomy, two common treatments for cITP, could not be included as comparators due to differences in patient characteristics and study design.16 The time horizon used in this model was relatively short but allowed modeling of within-trial endpoints without the need for extrapolation techniques. Lastly, since there is currently no established cost-effectiveness threshold for severe bleeding events avoided, the interpretation of the ICER results presented can be challenging.
To our knowledge, this is the most comprehensive cost-consequence model comparing EPAG with ROMI in adults with cITP who have had an insufficient response to corticosteroids, immunoglobulins, or splenectomy. This is an area of interest to physicians and health care decision-makers who are seeking to determine the best available treatment options for these patients. The results of our analysis indicate that EPAG is cost-effective for the treatment of cITP when assessing cost per severe bleeding event avoided. Additional analyses are planned to investigate cost comparisons between EPAG and ROMI in pediatric patients.
Conclusion
Overall, EPAG was dominant (less expensive with fewer severe bleeding events) compared with ROMI and had notably fewer severe bleeding events compared with W&R. Further evaluations that incorporate long-term extrapolation and preference-based outcomes (quality-adjusted life year and life year) would be meaningful additions to the evidence base for treatment of cITP.
Acknowledgments
This analysis was presented in part at the 22nd Annual International Meeting of the International Society for Pharmacoeconomics and Outcomes Research (Tremblay et al, May 2017). Additionally, a similar analysis, “Cost-Consequence Model Comparing Eltrombopag and Romiplostim for Pediatric Patients with Previously-Treated Chronic Immune Thrombocytopenia” was presented at the 2017 meeting of the American Society of Hematology (Tremblay et al, December 2017, accessible at: http://www.bloodjournal.org/content/130/Suppl_1/2146). This study was funded by Novartis Pharmaceuticals. Purple Squirrel Economics developed the analysis with validation of external consultants.
Author contributions
G Tremblay and M Dolph made substantial contributions to the conception and design of the analysis. They also analyzed and interpreted data. M Bhor, Q Said, B Elliott, and A Briggs contributed to conception and development of the analysis, as well as evaluation and interpretation of the data. All authors contributed toward drafting and revising the article, gave final approval of the version to be published, and agree to be accountable for all aspects of the work.
Disclosure
M Bhor, Q Said, and B Elliott are employees of Novartis Pharmaceuticals. A Briggs received personal fees from Novartis for this study. He also received personal fees from Amgen, Bayer, Eisai, BMS, Astra Zeneca and Merck for activities ourside the submitted work. The authors report no other conflicts of interest in this work.
References
Segal JB, Powe NR. Prevalence of immune thrombocytopenia: analyses of administrative data. J Thromb Haemost. 2006;4(11):2377–2383. | ||
Terrell DR, Beebe LA, Vesely SK, Neas BR, Segal JB, George JN. The incidence of immune thrombocytopenic purpura in children and adults: A critical review of published reports. Am J Hematol. 2010;85(3):174–180. | ||
Altomare I, Cetin K, Wetten S, Wasser JS. Rate of bleeding-related episodes in adult patients with primary immune thrombocytopenia: a retrospective cohort study using a large administrative medical claims database in the US. Clin Epidemiol. 2016;8:231–239. | ||
National Heart, Lung, and Blood Institute. Immune Thrombocytopenia. 2012. Available from: https://www.nhlbi.nih.gov/health-topics/immune-thrombocytopenia. Accessed September 26, 2018. | ||
Cheng G, Saleh MN, Marcher C, et al. Eltrombopag for management of chronic immune thrombocytopenia (RAISE): a 6-month, randomised, phase 3 study. Lancet. 2011;377(9763):393–402. | ||
Neunert CE. Current management of immune thrombocytopenia. Hematology Am Soc Hematol Educ Program. 2013;2013(1):276–282. | ||
Chiche L, Perrin A, Stern L, Kutikova L, Cohen-Nizard S, Lefrère F. Cost per responder associated with romiplostim and rituximab treatment for adult primary immune thrombocytopenia in France. Transfus Clin Biol. 2014;21(2):85–93. | ||
dos Santos RF, Vargas-Valencia JJ, Giannopoulou A, Campioni M. Cost-Effectiveness Analysis of Romiplostim for The Treatment of Adult Chronic Immune Thrombocytopenic Purpura (Itp) In Brazil. Value Health. 2015;18(7):A668. | ||
López MF, Mingot ME, Valcárcel D, Vicente García V, Perrin A, Campos Tapias I. Cost-per-responder analysis comparing romiplostim to rituximab in the treatment of adult primary immune thrombocytopenia in Spain. Med Clin. 2015;144(9):389–396. | ||
Pepe C, Teich V, Coutinho MB, Almeida S. Romiplostim Cost Per Response In Itp Treatment In the Brazilian Health Care System. Value Health. 2014;17(7):A529A529. | ||
Allen R, Brainsky A, Grotzinger K, Roccia T. A comment on Boyers et al.: “eltrombopag for the treatment of chronic immune or idiopathic thrombocytopenic purpura: a NICE single technology appraisal”. Pharmacoeconomics. 2013;31(1):87–89. | ||
Li X, Sharma A, Zhang X, et al. Cost per Treatment Success of Thrombopoietin Receptor Agonists Vs “Watch and Rescue” Strategy for Treating Adult Non-Splenectomized Patients with Chronic Immune Thrombocytopenia: A US Payer Perspective. Blood. 2015;126:4461. | ||
Bell WR. Long-term outcome of splenectomy for idiopathic thrombocytopenic purpura. Semin Hematol. 2000;37(1 Suppl 1):22–25. | ||
Schwartz J, Leber MD, Gillis S, Giunta A, Eldor A, Bussel JB. Long term follow-up after splenectomy performed for immune thrombocytopenic purpura (ITP). Am J Hematol. 2003;72(2):94–98. | ||
Arnold DM, Heddle NM, Carruthers J, et al. A pilot randomized trial of adjuvant rituximab or placebo for nonsplenectomized patients with immune thrombocytopenia. Blood. 2012;119(6):1356–1362. | ||
Ghanima W, Khelif A, Waage, et al; RITP study group. Rituximab as second-line treatment for adult immune thrombocytopenia (the RITP trial): a multicentre, randomised, double-blind, placebo-controlled trial. Lancet. 2015;385(9978):1653–1661. | ||
Moulis G, Sailler L, Sommet A, Lapeyre-Mestre M, Derumeaux H, Adoue D. Rituximab versus splenectomy in persistent or chronic adult primary immune thrombocytopenia: an adjusted comparison of mortality and morbidity. Am J Hematol. 2014;89(1):41–46. | ||
Kuter DJ, Bussel JB, Lyons RM, et al. Efficacy of romiplostim in patients with chronic immune thrombocytopenic purpura: a double-blind randomised controlled trial. Lancet. 2008;371(9610):395–403. | ||
Kuter DJ, Bussel JB, Lyons RM, et al. Efficacy of romiplostim in patients with chronic immune thrombocytopenic purpura: a double-blind randomised controlled trial. Lancet. 2008;371(9610):395–403. | ||
Boyers D, Jia X, Crowther M, Jenkinson D, Fraser C, Mowatt G. Eltrombopag for the treatment of chronic idiopathic (immune) thrombocytopenic purpura (ITP). Health Technol Assess. 2011;15(Suppl 1):23–32. | ||
Bucher HC, Guyatt GH, Griffith LE, Walter SD. The results of direct and indirect treatment comparisons in meta-analysis of randomized controlled trials. J Clin Epidemiol. 1997;50(6):683–691. | ||
United States Census Bureau. Annual Population Growth Rate. Available from: https://factfinder.census.gov/faces/tableservices/jsf/pages/productview.xhtml?pid=PEP_2015_PEPANNRES&src=pt. Accessed September 26, 2018. | ||
Boyle S, White RH, Brunson A, Wun T. Splenectomy and the incidence of venous thromboembolism and sepsis in patients with immune thrombocytopenia. Blood. 2013;121(23):4782–4790. | ||
Common Terminology Criteria for Adverse Events (CTCAE) National Cancer Institute, US National Institutes of Health. 2006. Available from: https://ctep.cancer.gov/protocolDevelopment/electronic_applications/docs/CTCAE_v5_Quick_Reference_8.5x11.pdf. Accessed September 26, 2018. | ||
Cheng G, Saleh MN, Marcher C, et al. Eltrombopag for management of chronic immune thrombocytopenia (RAISE): a 6-month, randomised, phase 3 study. Lancet. 2011;377(9763):393–402. | ||
AnalySource: Premier Drug Pricing Services. Syracuse, NY2017. Available from: https://www.analysource.com/. Accessed September 26, 2018. | ||
Saleh MN, Fisher M, Grotzinger KM. Analysis of the impact and burden of illness of adult chronic ITP in the US. Curr Med Res Opin. 2009;25(12):2961–2969. | ||
Lee D, Thornton P, Hirst A, Kutikova L, Deuson R, Brereton N. Cost effectiveness of romiplostim for the treatment of chronic immune thrombocytopenia in Ireland. Appl Health Econ Health Policy. 2013;11(5):457–469. | ||
Toner RW, Pizzi L, Leas B, Ballas SK, Quigley A, Goldfarb NI. Costs to Hospitals of Acquiring and Processing Blood in the US. Appl Health Econ Health Policy. 2011;9(1):29–37. | ||
Centers for Medicare & Medicaid Services. Medicare – ASP Drug Pricing Files [Internet]. Medicare. 2016 [cited October 2016]. Available from: https://www.cms.gov/apps/ama/license.asp?file=/Medicare/Medicare-Fee-for-Service-Part-B-Drugs/McrPartBDrugAvgSalesPrice/Downloads/2016-October-ASP-Pricing-File.zip. Accessed September 26, 2018. | ||
Lin J, Zhang X, Li X, et al. Cost of Bleeding-related Episodes in Adult Patients With Primary Immune Thrombocytopenia: A Population-based Retrospective Cohort Study of Administrative Claims Data for Commercial Payers in the United States. Clin Ther. 2017;39(3):3274–609. | ||
CMS Medicare Fee Schedule [Internet]. Medicare. 2017. Available from: https://www.findacode.com/. Accessed September 26, 2018. | ||
Healthcare Cost and Utilization Project (HCUP). US Department of Health & Human Services; 2013. Available from: https://hcupnet.ahrq.gov/#setup. Accessed September 26, 2018. | ||
Jansen JP, Naci H. Is network meta-analysis as valid as standard pairwise meta-analysis? It all depends on the distribution of effect modifiers. BMC Med. 2013;11(1):159. | ||
US Department of Labor. Inflation Rate (2015–2016). US Bureau of Labor Statistics (CPI); 2015. Available from: https://www.bls.gov/news.release/archives/cpi_07152016.pdf. Accessed September 26, 2018. |
 © 2018 The Author(s). This work is published and licensed by Dove Medical Press Limited. The
full terms of this license are available at https://www.dovepress.com/terms
and incorporate the Creative Commons Attribution
- Non Commercial (unported, 3.0) License.
By accessing the work you hereby accept the Terms. Non-commercial uses of the work are permitted
without any further permission from Dove Medical Press Limited, provided the work is properly
attributed. For permission for commercial use of this work, please see paragraphs 4.2 and 5 of our Terms.
© 2018 The Author(s). This work is published and licensed by Dove Medical Press Limited. The
full terms of this license are available at https://www.dovepress.com/terms
and incorporate the Creative Commons Attribution
- Non Commercial (unported, 3.0) License.
By accessing the work you hereby accept the Terms. Non-commercial uses of the work are permitted
without any further permission from Dove Medical Press Limited, provided the work is properly
attributed. For permission for commercial use of this work, please see paragraphs 4.2 and 5 of our Terms.