Back to Journals » Journal of Pain Research » Volume 10
Cortical mapping of painful electrical stimulation by quantitative electroencephalography: unraveling the time–frequency–channel domain
Authors Goudman L, Laton J, Brouns R ![]() , Nagels G, Huysmans E, Buyl R, Ickmans K, Nijs J
, Nagels G, Huysmans E, Buyl R, Ickmans K, Nijs J ![]() , Moens M
, Moens M
Received 7 July 2017
Accepted for publication 13 September 2017
Published 15 November 2017 Volume 2017:10 Pages 2675—2685
DOI https://doi.org/10.2147/JPR.S145783
Checked for plagiarism Yes
Review by Single anonymous peer review
Peer reviewer comments 2
Editor who approved publication: Dr Katherine Hanlon
Lisa Goudman,1–3 Jorne Laton,4 Raf Brouns,4,5 Guy Nagels,4–6 Eva Huysmans,2,3,7,8 Ronald Buyl,7,9 Kelly Ickmans,2,3,10 Jo Nijs,2,3,10 Maarten Moens,1,2,4,11
1Department of Neurosurgery, Universitair Ziekenhuis Brussel, 2Pain in Motion International Research Group, 3Department of Physiotherapy, Human Physiology and Anatomy, Faculty of Physical Education and Physiotherapy, 4Center for Neurosciences (C4N), Vrije Universiteit Brussel (VUB), 5Department of Neurology, Universitair Ziekenhuis Brussel, 6National MS Center, 7Department of Public Health (GEWE), Faculty of Medicine and Pharmacy, Vrije Universiteit Brussel, 8Interuniversity Centre for Health Economics Research (I-CHER), 9Department of Biostatistics and Medical Informatics, Faculty of Medicine and Pharmacy, Vrije Universiteit Brussel, 10Department of Physical Medicine and Physiotherapy, 11Department of Radiology, Universitair Ziekenhuis Brussel, Brussels, Belgium
Abstract: The goal of this study was to capture the electroencephalographic signature of experimentally induced pain and pain-modulating mechanisms after painful peripheral electrical stimulation to determine one or a selected group of electrodes at a specific time point with a specific frequency range. In the first experiment, ten healthy participants were exposed to stimulation of the right median nerve while registering brain activity using 32-channel electroencephalography. Electrical stimulations were organized in four blocks of 20 stimuli with four intensities – 100%, 120%, 140%, and 160% – of the electrical pain threshold. In the second experiment, 15 healthy participants received electrical stimulation on the dominant median nerve before and during the application of a second painful stimulus. Raw data were converted into the time–frequency domain by applying a continuous wavelet transform. Separated domain information was extracted by calculating Parafac models. The results demonstrated that it is possible to capture a reproducible cortical neural response after painful electrical stimulation, more specifically at 250 milliseconds poststimulus, at the midline electrodes Cz and FCz with predominant δ-oscillations. The signature of the top-down nociceptive inhibitory mechanisms is δ-activity at 235 ms poststimulus at the prefrontal electrodes. This study presents a methodology to overcome the a priori determination of the regions of interest to analyze the brain response after painful electrical stimulation.
Keywords: electroencephalography, Parafac model, painful electrical stimulation, conditioned pain modulation
Introduction
Part of the endogenous analgesia system is the bottom-up activation of the pain-modulation (PM) mechanism, namely “diffuse noxious inhibitory controls”.1 As an assessment tool for measuring these in clinical practice, conditioned pain modulation (CPM) evaluates whether the pain intensity of a noxious stimulus can be inhibited by another painful stimulus on a remote area of the body.2,3 A frequent finding in a wide range of chronic pain patients is the malfunctioning of the central PM pathways, whereby CPM can act as a biomarker of chronic pain and furthermore as a predictor of treatment outcomes.3,4 However, this pain-inhibits-pain mechanism relies only on subjective parameters.
Assessing pain in an objective and standardized way is the holy grail for most pain researchers, but would also prove to be highly valuable for clinicians, patients, and public health in general. Several brain-imaging techniques have been used to investigate the neural signature of experimentally induced pain and hyperalgesic or allodynic states in various populations.5 Despite the high spatial resolution and test–retest reliability of functional magnetic resonance imaging, quantitative electroencephalography (EEG) has become a useful tool in clinical settings, due to its technical practicality and excellent temporal resolution.6 EEG recordings reflect the volume-conducted summation of neural oscillations and their synchronization, representing interneuronal communication among brain regions.7,8
A frequently encountered obstacle in the process of objectively measuring brain responses is the need to define regions of interest. Classical analysis requires the determination of an a priori model with regions and connections of interest, in order to restrict the analysis to the predetermined network regions.8 In electrophysiology, the central EEG electrodes are commonly the center of attention, and are usually chosen to analyze experimentally induced pain responses.9–11 However, restriction of the analysis to these regional electrodes is highly debatable. This issue can be circumvented by recording whole-brain activity, but analyzing multiple electrodes is inevitably associated with the risks of multiple testing (type I errors).12
Time–frequency analysis allows assessment of multiple simultaneous neural processes to obtain a dynamic image of the brain’s information-processing network, resulting in different frequency bands.7,13 Event-related oscillations are usually divided into five frequency bands, each participating in different processes: δ- (1–4 Hz), θ- (4–8 Hz), α- (8–12 Hz), β- (12–25 Hz), and γ- (>30 Hz)-frequency bands.14 Of particular interest are δ-oscillations, which reflect reactions to aversive stimuli. Activation of the periaqueductal gray (PAG), which is a key structure in the PM mechanism, is also accompanied by an increase in δ-oscillations.13 Certain models, such as the Parafac model, provide the opportunity to split the time–frequency information into separate domains.15–19 This helps to overcome the previously described challenge of predefining certain regions of interest, since these models deliver separated-component information of the measured brain response.18
The goal of this study was to determine one or a selected group of electrodes at a specific time delay after stimulation to obtain the neural signature of experimentally induced pain (experiment 1) and PM mechanisms (experiment 2) in healthy participants. We expected a gradual increase in δ-oscillations (due to accumulating aversive reactions) with increasing stimulus intensities and an increased δ-frequency (due to the activation of the PAG) during PM mechanisms.
Materials and methods
First experiment
Participants
Ten healthy participants (six males, mean age 28.1±5.7 years) were recruited. None of the participants was allowed to use analgesics or medication for any chronic disease. Exclusion criteria were experiencing acute and/or chronic pain or suffering from any chronic disease. All participants were instructed to abstain from using alcohol, nicotine, and caffeine for the 24 hours before the experiment. All participants provided written informed consent prior to participation. The study was conducted according to the revised Declaration of Helsinki (1998). The study protocol was approved by the Ethics Committee of the Universitair Ziekenhuis Brussel (BUN 143201526924) and was registered on ClinicalTrials.gov (NCT02630732).
Study protocol
All assessments were conducted in the afternoon (between 3 and 6 pm), with all participants seated in a comfortable chair in a quiet room. In the first experiment, the electrical pain-detection threshold (EPDT) and the electrical pain threshold (EPT) were determined first, and thereafter stimulation was executed in four randomized blocks. During the four stimulation blocks, EEG recordings were performed.
Electrical pain-detection threshold
EPDTs were assessed using the Surpass LT stimulator (EMS Biomedical, Korneuburg, Austria). The bipolar felt-pad electrode was placed on the skin above the median nerve 5 cm from the wrist.20 Each stimulus consisted of a constant current rectangular pulse train of 5 pulses, delivered at 250 Hz.21 Stimulation started at 0 mA and was gradually increased using steps of 0.5 mA until the participant experienced a faint sensation. This point was considered the EPDT. Stimulations were further increased until the stimulus was experienced as unpleasant, which was considered the EPT.22 Three measurements were made, with 30 seconds in between. The mean of the PT was used in further analyses.23
Electrical stimulation
In the first experiment, each participant received four stimulation blocks in the region of the right median nerve, consisting of 20 electrical stimuli with a variable interstimulus interval of 8–12 seconds. The stimulation blocks, with different intensities, were applied in a randomized order, with a resting pause of 2 minutes between each stimulation block. The intensities of the four stimulation blocks were tailored to each participant at 100% (condition 1), 120% (condition 2), 140% (condition 3), and 160% (condition 4) of the EPT. Evoked related potentials (ERPs) were recorded with a 32-electrode EEG system during the stimulation blocks.
Self-reported pain
After each stimulation block, patients were instructed to rate the electrical stimulation on a verbal numeric rating scale (VNRS) from 0 to 10, whereby 0 represents no pain and 10 the worst imaginable pain.
Second experiment
Study participants
Fifteen healthy participants (seven males, mean age 32.9±15.5 years) were included. All participants were recruited and included if they met the aforementioned criteria. All participants were instructed to abstain from using alcohol, nicotine, and caffeine for the 24 hours before the experiment.
Study protocol
The second experiment started with the determination of the EPDT and EPT at the dominant median nerve. Secondly, CPM was conducted with the cold pressor as conditioning stimulus and electrical stimulation as test stimulus. During the CPM protocol, EEG recordings were taken. At the end of the experiment, participants were asked to complete a questionnaire about safety and feasibility aspects of the testing procedure.
Conditioned pain modulation
In the second experiment, each participant received 20 electrical stimuli (250 Hz, train of five) at 1.4 times the intensity of the EPT, with a variable interstimulus interval of 8–12 seconds, in the region of the median nerve on the dominant hand.24,25 The 20 stimuli were performed twice: once before (baseline condition) and once during the application of the conditioning stimulus (CPM condition). In order to apply the conditioning stimulus, patients had to insert their nondominant hand in cold, distilled water (VersaCool; Thermo Fisher Scientific, Waltham, MA, USA) of 12°C up to the wrist for 3 minutes.26–28 This temperature is sufficient to produce a painful response, but is still bearable for a few minutes.29 Electrical stimulations started immediately after immersing the hand in the water. After the last stimulation, participants could withdraw their hand, and VNRS scores were obtained on a scale from 0 (no pain) to 10 (worst pain you can imagine). VNRS scores of the baseline condition were compared to the VNRS score of the CPM condition.30 During this phase of the experiment, ERPs were recorded.
Questionnaire
After completion of the second experiment, participants and the assessor completed a questionnaire. Participants were asked to comment on five questions: “Did you feel safe during the experiment?”, “Were you afraid of the electrical stimulation?”, “Were you afraid of the cold water?”, “Did you noticed any reaction, side effect, etc? If yes, please explain”, and “Was the experiment feasible?” The researcher completed the questions “Was the experiment safe?” and “Could you detect any reaction or side effect with the participant?”
EEG recordings
During the recordings, participants were instructed to close their eyes, avoid blinking, and try to sit as still as possible. Scalp EEG (Sienna digital; EMS Biomedical) was recorded with 32 surface Sn electrodes in a headcap (EMS Biomedical) with unipolar montage following the standard 10–20 montage system. Two reference electrodes were positioned behind the ears and the AFz electrode served as the ground electrode. Electrode impedance was evaluated before and after each recording, and was kept as low as possible by rechecking the contact between the electrodes and the scalp, and if necessary reinjecting electrolyte gel into the electrodes to optimize contact.
Data analysis
Preprocessing
Preprocessing was performed with Research 6.1 (BESA, Gräfelfing, Germany) software. All EEG signals were processed at a frequency of 1,024 Hz and band-pass filtered between 0.5 and 50 Hz. The time window from –100 milliseconds to 900 milliseconds poststimulus was selected as an epoch. Independent-component analysis was performed to increase the signal:noise ratio and artifacts (both movement and eye artifacts) were manually removed. Epochs were baseline-corrected by subtracting the first 100-millisecond prestimulus of the epoch (–100 to 0 milliseconds). Remaining epochs were averaged per participant and per condition (Figure 1).
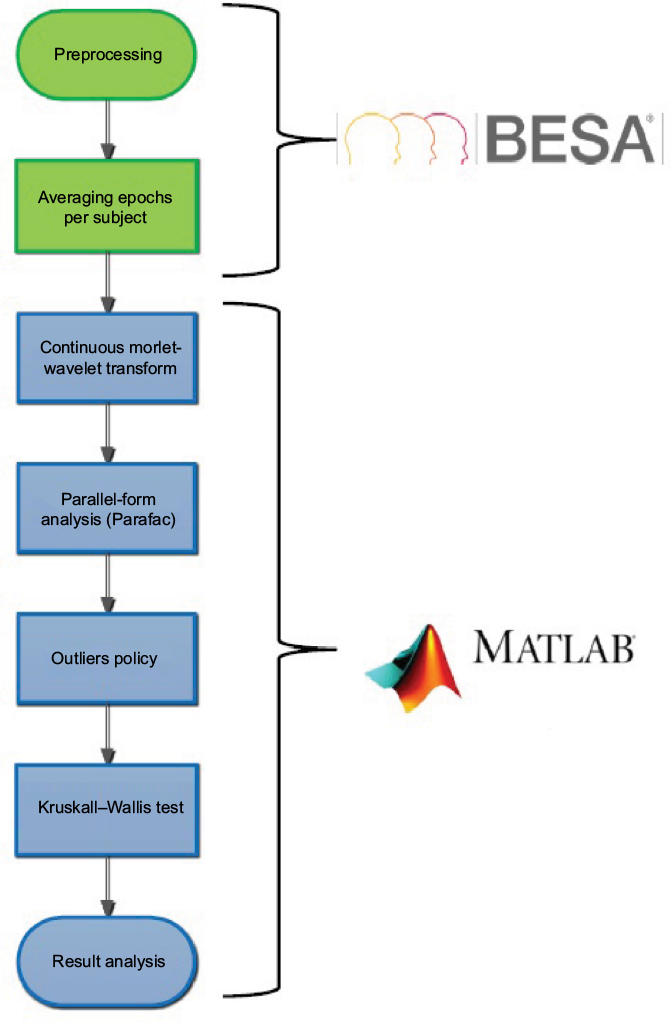 | Figure 1 Flow diagram of data analysis. |
Period of interest
The period of interest for further analysis was limited to 900 ms poststimulus (0–900 milliseconds poststimulus). Further analyses were performed in MatLab (R2016b), where a 3-D matrix was created for each condition with locations in the first dimension, signals in the second dimension, and participants in the third dimension.
Continuous Morlet-wavelet transform
A continuous wavelet transform was applied to obtain frequency decomposition. Data were transformed using a Morlet wavelet with the built-in function “cwtft” in MatLab. The Morlet-wavelet transform is a Gaussian-windowed sinusoidal wave segment, using a Fourier-transform-based algorithm:7
|
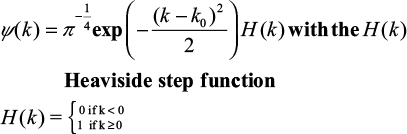
where K0 is set as the default at 6 and represents the center frequency in radians/sample. The center frequency of cycles/sample is  . The Morlet transformation automatically determines the number of frequencies. Frequencies resulting from Morlet transformation are complex values, which required taking their absolute values to avoid calculations with complex numbers comprised of real and imaginary components.7
Parallel-factor analysis
After the Morlet transformation, a three-way tensor remained, which included time, frequency, and channel information for each participant. All information was loaded into the Parafac model, using the Parafac function in the N-way Toolbox of MatLab. Determination of the number of factors, which is important for correct decomposition, was based on core consistency. A core-consistency value of 100 means that the data conforms exactly to the model, while values lower than 85 could be an indication of too many components.16,18 Two-, three-, and four-factor models were applied to the individual information of every participant for the different conditions. Absolute values were taken to determine the magnitude of the responses.
Outlier policy
The last step was the removal of outliers. The combination of a certain patient with a certain intensity and a certain factor was considered an outlier if it fell outside the interval (µ ± 2σ) in more than 60 of 972 cases. This value was calculated as the one-sided cutoff for a binomial distribution with n=972 (columns in the matrix [922 time units, 32 channels, 18 frequencies]) with a 5% significance level. Mathematically, a binomial distribution consists of the sum of independent Bernoulli distributions. We need to consider that this is a rather conservative approach, since it is plausible that the assumption of independence was violated.
Source analysis
For source modeling, the BESA software was used. In both experiments, dipolar source modeling using standardized low-resolution brain electromagnetic tomography (BESA software) was performed on grand averages and accepted if the residual variance was below 10%. Only dipoles with fixed location and free orientation were used. The constructed models were then applied to the averaged files for each individual.
Lateralization
In the second experiment, participants were stimulated on the dominant side, resulting in data obtained from stimulating the left or right median nerve. Where participants were left-handed, pseudomirroring was executed to analyze the results obtained from the Parafac model. Dipolar source modeling was performed only on participants who were right-handed, due to the inability to mirror directly in source analysis.
Statistical analysis
EEG data were analyzed in three dimensions (time, frequency, and channel) for all participants. Due to the violation of the assumption of normality observed in the quantile–quantile plots, nonparametric tests were found to be the most appropriate to differentiate between the conditions. The average of the factors of the Parafac decomposition was used in the statistical analysis. Differences in time, frequency, and channel information (most important components) among the four intensities in the first experiment were evaluated with the Kruskal–Wallis test in MatLab. The independent variable was stimulation intensity (100%, 120%, 140%, 160% EPT), and the dependent variables were prominent components from the Parafac analysis in the time, channel, and frequency domains. Wilcoxon tests were used to determine differences between the baseline and CPM conditions in the second experiment for the most prominent frequency, time, and electrode components.
Source-analysis data were analyzed with the BESA Statistics 2.0 module. In the first experiment, a between-group univariate analysis of variance was used with permutation testing, where the images of the ten participants were compared between the four stimulation intensities (four between-factor levels). In the second experiment, a two-tailed paired-sample Student’s t-test was performed, with permutation testing where the images of the baseline conditions were compared with the images of the CPM condition. Permutation testing resulted in clusters where the null hypothesis was rejected, ie, the data were not interchangeable. Where the null hypothesis could not be rejected, the cluster with the largest F- or t-value was reported.
Results
First experiment
Pain thresholds
Electrical stimulations were divided into four conditions based on personalized EPT (100%, 120%, 140%, and 160% of the EPT). The mean EPDT was 1.65±0.59 mA. The median stimulation threshold in the first condition was 4.38 (Q1–Q3 3–9.5) mA. The thresholds in the following conditions were 5.25 (3.5–11.25) mA for the second, 6.12 (4.25–13.25) mA for the third, and 7 (4.75–15.25) mA for the fourth condition. The median pain score given to stimulations in the first condition was 4 (2–5) on a 10-point rating scale. Median pain scores for the second, third, and fourth conditions were 4 (3–6), 5 (3–6), and 6 (3–7) respectively. Despite the increasing trend in pain ratings, pain scores did not differ significantly among the different stimulation conditions (c2=4.2937, P=0.2315).
Brain response on EEG
The two-factor model fitted the best, since the core consistency approached 100 in each participant, in contrast to the core consistency of the three-factor model, which was close to zero or even negative. After removal of the outliers (12.5%), the remaining results enabled us to observe specific domain information after EP stimulation (Figure 2).
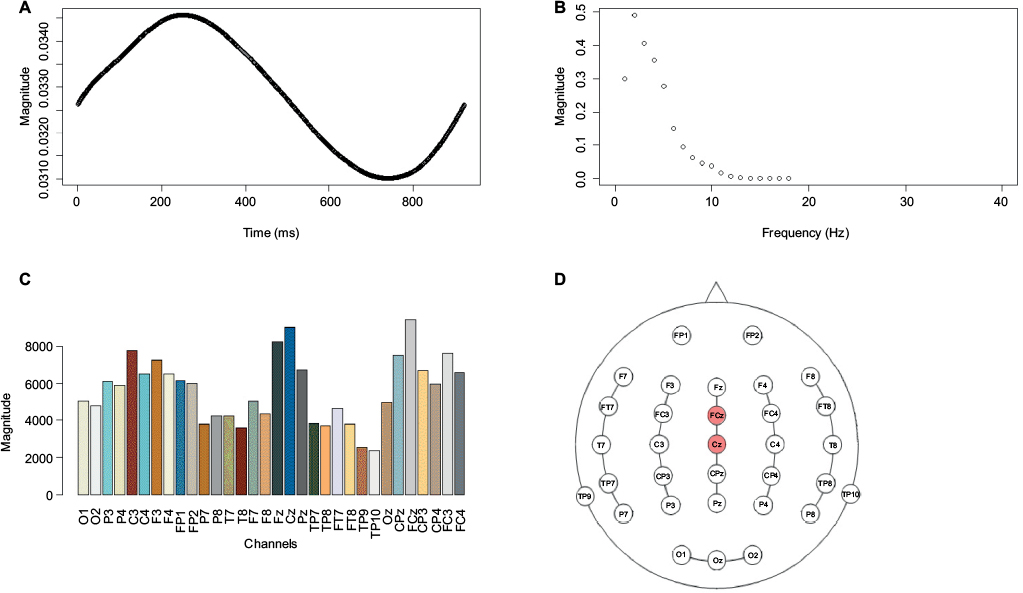 | Figure 2 Neural response channel–frequency–time domain after Parafac calculation in healthy pain-free participants (n=10). Notes: On the x-axis, the specific domain is plotted, ie, time, frequency, or channel, with the magnitude on the y-axis. (A) Poststimulus at 0–900 milliseconds, wherein a peak at 250 milliseconds can be observed. (B) Frequencies determined by the Morlet transformation displayed on the x-axis in ascending order. There was a peak at the second frequency, which represents a peak in the δ-frequency range at 2.194 Hz. (C) The 32 channels are represented by different colors. FCz and Cz electrodes had the highest response. (D) Topographic map of the 32 channels with identified electrodes for capturing brain response after painful electrical stimulation, namely FCz and Cz midline electrodes. |
The Parafac model revealed that the active zone after painful electrical stimulation was mainly situated around the central electrodes Cz and FCz. Within the wavelet decomposition, we used the frequency ranges δ (1–4 Hz), θ (4–8 Hz), α (8–12 Hz), β (12–25 Hz), and γ (30–40 Hz).14 A dominant neural response frequency of 2.1938 Hz was observed, which was allocated to the δ-frequency band. The neural response time was situated at 250 milliseconds poststimulus for all conditions.
When the different stimulation conditions were compared on the selected electrodes, the selected frequency and the selected time components from the Parafac model, no significant differences were revealed. The magnitude of response at the Cz (c2=2.8028, P=0.423) or FCz (c2=3.4047, P=0.333) electrodes when increasing the stimulus intensity was not significantly different. There was no significant difference at the frequency of 2,1938 Hz (c2=2.4995, P=0.4754) or at 250 milliseconds poststimulus (c2=4.8016, P=0.1869) when increasing the stimulation intensity.
Source analysis
The 0- to 900-millisecond poststimulus interval was explained by six dipoles. The dipoles were located at the ventral posterior cingulate cortex, dorsal posterior cingulate cortex, right anterior prefrontal cortex, primary visual cortex, left premotor cortex, and right inferior temporal gyrus. There were no significant differences among the orientation of the dipoles in the different conditions (P>0.05). sLORETA imaging techniques revealed two major clusters: the first cluster in Brodmann area 42 (auditory cortex) and the second in Brodmann area 10 (anterior prefrontal cortex). Permutation testing revealed no significant differences between the different conditions on the two clusters (cluster 1, P=0.812; cluster 2, P=0.861).
Second experiment
Safety and feasibility
All participants and the assessors found this experiment safe. No severe adverse events were reported. There were four side effects each reported once – pain in the groin, sweating, wounds on the skull surface, and headache symptoms – of which the latter immediately disappeared after removing the EEG cap. Eleven of 15 participants reported this protocol as feasible, two of 15 found it just feasible once, and two of 15 reported it was not feasible (Table 1). Participants who found the protocol not feasible indicated that it was a painful experiment.
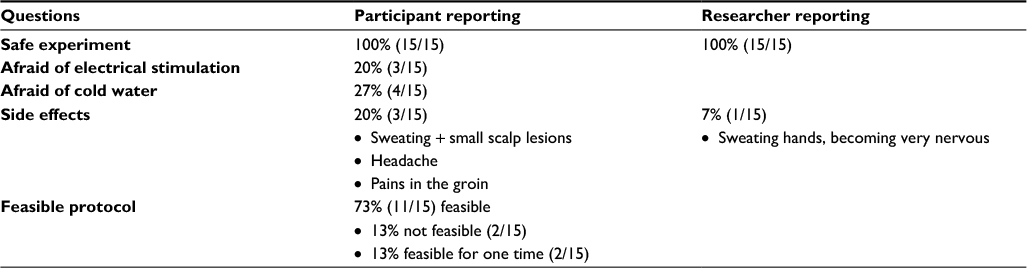 | Table 1 Safety and feasibility reporting from both participant and researcher |
Conditioned pain modulation
The mean EPDT was 1.3444±0.5821 mA. The mean EPT was 6.4556±4.4630 mA. Nine participants were able to demonstrate a clear CPM effect, five participants had the same VNRS score on the baseline and the CPM condition, and one participant had no CPM effect. There was no significant difference between the median VNRS scores in baseline condition 4 (3–6) and CPM condition 3 (2–4.75) (W=262.5, P=0.2159) (Table 2).
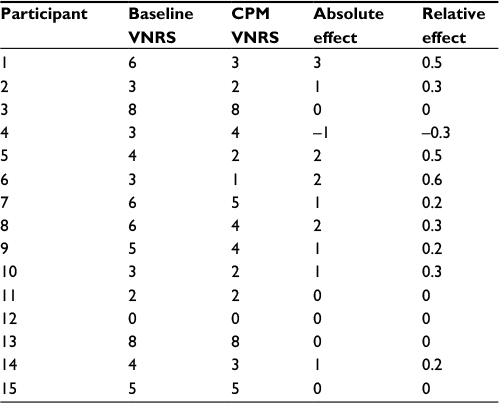 | Table 2 Pain-intensity ratings of healthy, pain-free participants (n=15) in the second experiment during baseline and CPM conditions Notes: In the second and third columns, pain-intensity ratings of the baseline and CPM conditions are reported. The absolute CPM effect (baseline VNRS – CPM VNRS) and relative CPM effect ([baseline VNRS – CPM VNRS]/baseline VNRS) can be observed in the fourth and fifth columns for every participant. Abbreviations: CPM, conditioned pain modulation; VNRS, verbal numeric rating scale. |
Brain response on EEG
A two-factor Parafac model was the most appropriate to analyze the data of the baseline and CPM conditions. Ten percent of the data were considered outliers. The active zone in the baseline condition was mainly situated at the FCz and Cz central electrodes (Figure 3). In the CPM condition, the active zone was located primarily at the Fp1 and Fp2 electrodes. The neural response time was 249 milliseconds poststimulus for the baseline condition and 235 ms for the CPM condition. After wavelet composition, a dominance in δ-frequency was observed in both the baseline and CPM conditions.
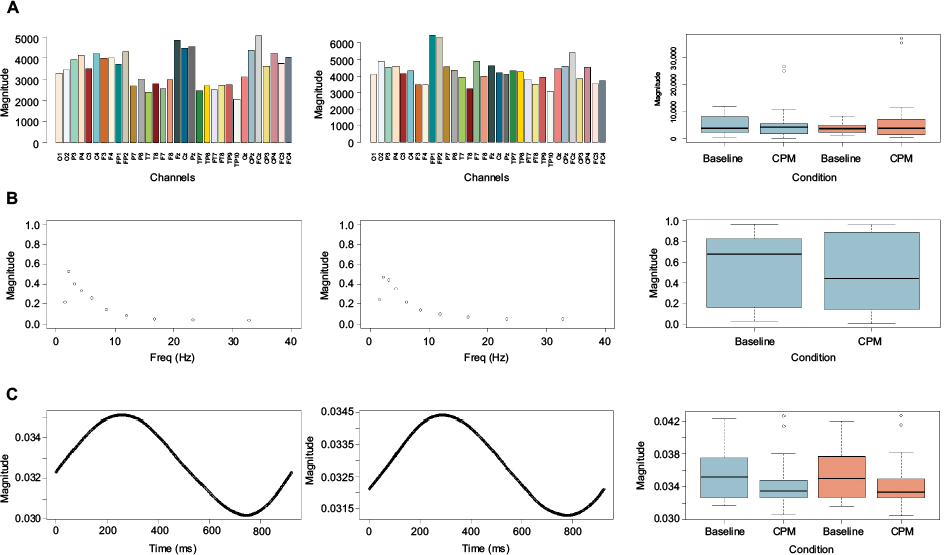 | Figure 3 Neural response channel–frequency–time domain after Parafac calculation for baseline and CPM conditions in healthy pain-free participants (n=15). Notes: Left column, channel–frequency–time domain in the baseline condition; middle column, channel–frequency–time domain in the CPM condition; right column, box plots with differences between baseline and CPM conditions on dominant responses. On the x-axis, the specific domain is plotted (first row, channels; second row, frequency; third row, time) with magnitude on the y-axis. (A) The 32 channels are represented by different colors. The FCz and Cz electrodes had the highest response in the baseline condition. Fp1 and Fp2 captured the most activity in the CPM condition. There were no significant differences between the baseline and CPM conditions on the FCz electrode (blue) and the Fp1 electrode (red). (B) Frequencies determined by Morlet transformation displayed on the x-axis in ascending order. Both conditions represent a peak in the δ-band frequency. (C) Poststimulus at 0–900 milliseconds, wherein a peak at 249 ms can be observed in the baseline condition and at 235 milliseconds poststimulus in the CPM condition. There was no significant difference between the two conditions at 235 ms (blue) and 249 ms (red) poststimulus. Abbreviation: CPM, conditioned pain modulation. |
When comparing the baseline and CPM conditions at the selected channels from the Parafac model, there were no significant differences at Fp1 (W=339, P=0.8392), Fp2 (W=374, P=0.6913), FCz (W=387, P=0.5307), or Fz electrodes (W=382, P=0.5903). The magnitude of responses between the baseline and CPM conditions was not significantly different at 235 ms (W=426, P=0.1866) or 249 ms (W=425, P=0.1926) poststimulus. There was no significant difference between the two conditions at a frequency of 2.1938 Hz (W=376, P=0.6655). Post hoc testing for the frequency domain in a subgroup of CPM responders (participants who demonstrated a clinical CPM response [n=9]) also revealed a predominance of the δ-frequency in both conditions, without significant differences at 2.1938 Hz (W=301, P=0.1688).
Source analysis
Seven dipoles were used to explain the EEG data. Dipoles were fitted at the left dorsolateral prefrontal cortex, left premotor cortex (two dipoles), left inferior frontal gyrus pars opercularis, the pulvinar (thalamus), putamen, and caudate tail. Dipole source mapping revealed no significant differences between the baseline and CPM conditions. sLORETA-imaging techniques revealed four major clusters of activity: the first at Brodmann area 7, the second and third at Brodmann area 8, and the fourth at area 10. Permutation testing revealed no significant differences between the different conditions on the four clusters (cluster 1, P=0.115; cluster 2, P=0.19; cluster 3, P=0.239; cluster 4, P=0.408).
Discussion
In this study, brain responses were measured during experimentally induced pain and PM mechanisms on the dominant median nerve in healthy participants. The goal was to obtain clear neural signatures to be able to select (a) specific electrode(s) that reflect(s) the underlying brain activity after peripherally induced painful electrical stimulation without the necessity to point out regions of interest. Additionally, the neural signature during PM was evaluated as well. As such, we calculated Parafac models to obtain accurate information in each of the domains (time, frequency, and channel) separately. Such models decompose a multidimensional array into a sum of different components in such a way that different matrices explain the array with minimal residual error.16,17 With this strategy, it was possible to decompose the EEG signal into three separate components, whereby a clear signature of experimentally induced painful electrical stimulation on the median nerve was able to be observed at the central electrodes at around 250 milliseconds poststimulus, with dominant activity in the δ-band frequency range. The neural signature during the activation of the top-down inhibitory nociceptive pathways was characterized by dominance at the prefrontal electrodes at around 235 ms poststimulus, with dominant activity in the δ-band. The Parafac decompositions of the first experiment and the baseline condition of the second experiment revealed similar results, indicating that electrical stimulation on the median nerve at painful intensities produces a reproducible result in terms of Parafac decomposition.
The results confirmed the superiority of the central electrodes, specifically the Cz and FCz electrodes. It has previously been demonstrated that triggering the anterior, middle, and posterior parts of the cingulate cortex by transcranial stimulation of the central electrode positions is associated with a decrease in subjective pain intensity.31 The higher activation of the central electrodes in this study probably indicates activation of brain regions involved in antinociception, such as the cingulate cortex, the thalamus, or even the PAG, of which the latter could explain the dominance of the δ-frequency in this study.13 The dominance of the central electrodes for capturing nociceptive stimulation could indicate that we merely captured major underlying nociceptive processing mechanisms, rather than specific localizations on the somatosensory cortex. During top-down inhibitory processes, the neural signature was captured dominantly at the prefrontal electrodes (Fp1 and Fp2), possibly indicating activation of brain regions that correlate with psychophysical pain reduction during CPM, such as the orbitofrontal cortex.32,33
θ-Frequencies (4–8 Hz) are linked with the limbic system, memory processes, emotional arousal, and conditioned fear. They can be formed in the hippocampal region or in the midline prefrontal region of the cortex.34 δ-Frequencies (1–4 Hz) are generated in the anterior medial frontal cortex and in subcortical nuclei like the nucleus accumbens. They are correlated with compromised neuronal function and cognitive processes.34,35 The δ-oscillatory system is also expected to participate in atavistic defensive responses and reactions to unavoidable aversive stimuli like EP stimuli.13 Cells of the lateral PAG predominantly respond to cutaneous nociception, and PAG activity is accompanied by an increase in δ-oscillations.13 Wang et al found that administering moderately painful and unpainful electrical stimulation on the dominant index finger resulted in a dominant central response at 250 milliseconds poststimulus with a dominant frequency response of 5.5 Hz after Parafac decomposition.19 In this study, similar neural signatures were found after painful electrical stimulation of different painful intensities, except for the frequency domain. A possible explanation for the different frequency bands in both studies could be the predefined knowledge of the participants. Being uninformed whether a painful or unpainful stimulus will be administered could trigger a higher activation of emotional and fear-related processes and reflect a more dominant θ-frequency band.
Across the four stimulus intensities, we were not able to discriminate frequency ranges in the δ-band between the different conditions. It has been demonstrated that the magnitude of deflections after 200 milliseconds correlates better with subjective perceived intensity than with objective stimulus intensity, giving a lot of weight to the personal connotation of a stimulus.36 The intention of this study was to define four intensities that would represent an increase in pain perception. The subjective pain ratings each participant provided after each condition increased when the objective intensity increased. However, this increase was not significant, meaning the subjective stimulation intensity did not differ between all conditions. Therefore, we suppose all the stimulations covered the area of moderate pain without reaching the point of severe pain. Since the objective intensity was used instead of the subjective intensity for defining the intensity of electrical stimulation, it seems unlikely that different frequency ranges would be observed if the interpretation of the stimulations did not differ. This could also explain the fact that there was no difference in the magnitude of activation on the sLORETA images between the different stimulation intensities. To overcome this limitation, we recommend defining the conditions (with their related stimulation intensity) prior to the experiment based on the subjective pain ratings of the participant to ensure clear, distinguishable conditions, though it is possible we would trigger a fear-related process with this methodology, corresponding to an increase in the θ-frequency band.
The δ-frequency range remained the dominant frequency band while evaluating the top-down mechanisms. A dominant neural response frequency of α- or δ-oscillations can be expected when evaluating the functioning of the nociceptive inhibitory pathways. α-Oscillations are a top-down-controlled inhibitory rhythm, which is the fundament of the descending inhibitory pathways,34 although this study demonstrated a dominance in the δ-frequency, which can be explained by the key role of the PAG in top-down processing. Since we expected a significant difference in frequency domain between the baseline and CPM conditions due to the key function of the PAG in descending nociceptive inhibitory control processes, a post hoc analysis in CPM responders was performed. This revealed that regardless of successful activation of the top-down nociceptive inhibitory mechanisms, the δ-frequency spectrum did not change. In this study, we focused only on the dominant frequency of experimentally induced pain, ie, δ-oscillations, since the goal was to determine the regions of interest. It is possible that a comparison between the total frequency spectrum would reveal differences in the frequency domain when endogenous analgesia is activated. With the current protocol, we immediately measured the frequency spectrum after application of the second painful stimulus. Perhaps a delay needs to be taken into account to enable us to measure differences in the frequency spectrum. Further research is needed to clarify this.
With regard to the materials used for this research, the choice was made to use a 32-channel EEG cap for capturing neural responses due to painful stimulation. A 32-channel cap should have enough electrodes for performing all desired analyses in clinical pain research. Following the standard 10–20 electrode-placement system, the 19-channel EEG cap contains the central electrodes Fpz, Fz, Cz, Pz, and Oz, while the 32-channel cap additionally contains the FCz and CPz central electrodes. In clinical practice, the 19-channel EEG cap should be sufficient for measuring ERPs when performing time–frequency analysis on the Cz electrode. In the literature, painful stimuli administered to study participants for inducing pain experimentally can be classified according to their presumed mechanisms, the tissue involved, and their time course.37 In the EEG registration of such painful stimuli, the cornerstone of success is the delay between the stimulating device and the registration system. In contrast to mechanical and chemical stimulation, thermal and more specific electrical stimulation allows synchronization between devices with good precision.
It would be interesting to explore the neural signatures of electrical stimulation during top-down inhibitory processes in different patient populations further. The malfunctioning of the top-down nociceptive inhibitory system in chronic pain patients has been suggested to have predictive value for the development of chronic postoperative pain.38,39 Compared to healthy participants, chronic pain patients may have more frontal cortical activation and a lower response frequency.19 Evaluating the signatures of experimentally induced pain and comparing them to the signatures of healthy participants may provide more insight into the altered brain-processing mechanisms of chronic pain patients and may possibly have predictive value for the development of chronic pain. This could help in answering an important question in clinical practice to predict in which patients a certain treatment or surgery will be successful and which patients will be likely to develop chronic pain.
Conclusion
Painful cutaneous electrical stimulation at the dominant median nerve region in healthy participants can be captured with EEG. Decomposing the EEG signals with Parafac models enabled us to define a reproducible neural signature of painful electrical stimulation at the dominant median nerve region at the midline electrodes at 250 milliseconds poststimulus, with predominant δ-oscillations. The neural signature during top-down inhibitory processes shifted to the frontal electrodes with predominant δ-oscillations. The δ-frequency dominance suggests the activation of a primitive defense mechanism in response to painful cutaneous electrical stimulation at the dominant median nerve region in healthy participants.
Acknowledgments
This work was supported by the Applied Biomedical Research Program, Institute for the Agency for Innovation by Science and Technology, Belgium (IWT-TBM project 150180).
The authors would like to thank the BESA support team and Thierry Henrion (Ad Hoc Medical) for the technical support and Koen Putman for the critical feedback on this manuscript.
Disclosure
The authors report no conflicts of interest in this work.
References
Yarnitsky D. Role of endogenous pain modulation in chronic pain mechanisms and treatment. Pain. 2015;156 (Suppl 1):S24–S31. | ||
Pud D, Granovsky Y, Yarnitsky D. The methodology of experimentally induced diffuse noxious inhibitory control (DNIC)-like effect in humans. Pain. 2009;144(1–2):16–19. | ||
Hermans L, Calders P, Van Oosterwijck J, Verschelde E, Bertel E, Meeus M. An overview of offset analgesia and the comparison with conditioned pain modulation: a systematic literature review. Pain Physician. 2016;19(6):307–326. | ||
Kennedy DL, Kemp HI, Ridout D, Yarnitsky D, Rice AS. Reliability of conditioned pain modulation: a systematic review. Pain. 2016;157(11):2410–2419. | ||
Wager TD, Atlas LY, Lindquist MA, Roy M, Woo CW, Kross E. An fMRI-based neurologic signature of physical pain. N Engl J Med. 2013;368(15):1388–1397. | ||
Diniz RC, Fontenele AM, Carmo LH, et al. Quantitative methods in electroencephalography to access therapeutic response. Biomed Pharmacother. 2016;81:182–191. | ||
Roach BJ, Mathalon DH. Event-related EEG time-frequency analysis: an overview of measures and an analysis of early gamma band phase locking in schizophrenia. Schizophr Bull. 2008;34(5):907–926. | ||
Apkarian V. The Brain Adapting with Pain: Contribution of Neuroimaging Technology to Pain Mechanisms. Washington: IASP Press; 2015. | ||
Gram M, Graversen C, Nielsen AK, et al. A novel approach to pharmaco-EEG for investigating analgesics: assessment of spectral indices in single-sweep evoked brain potentials. Br J Clin Pharmacol. 2013;76(6):951–963. | ||
Burgell RE, Lelic D, Carrington EV, et al. Assessment of rectal afferent neuronal function and brain activity in patients with constipation and rectal hyposensitivity. Neurogastroenterol Motil. 2013;25(3):260–267, e167–268. | ||
Brock C, Andresen T, Frøkjaer JB, et al. Central pain mechanisms following combined acid and capsaicin perfusion of the human oesophagus. Eur J Pain. 2010;14(3):273–281. | ||
Singh Y, Singh J, Sharma R, Talwar A. FFT transformed quantitative EEG analysis of short term memory load. Ann Neurosci. 2015;22(3):176–179. | ||
Knyazev GG. EEG delta oscillations as a correlate of basic homeostatic and motivational processes. Neurosci Biobehav Rev. 2012;36(1):677–695. | ||
Maeoka H, Matsuo A, Hiyamizu M, Morioka S, Ando H. Influence of transcranial direct current stimulation of the dorsolateral prefrontal cortex on pain related emotions: a study using electroencephalographic power spectrum analysis. Neurosci Lett. 2012;512(1):12–16. | ||
Cong F, Lin QH, Kuang LD, Gong XF, Astikainen P, Ristaniemi T. Tensor decomposition of EEG signals: a brief review. J Neurosci Methods. 2015;248:59–69. | ||
Martínez-Montes E, Sánchez-Bornot JM, Valdés-Sosa PA. Penalized Parafac analysis of spontaneous EEG recordings. Stat Sin. 2008;18:1449–1464. | ||
Miwakeichi F, Martínez-Montes E, Valdés-Sosa PA, Nishiyama N, Mizuhara H, Yamaguchi Y. Decomposing EEG data into space-time-frequency components using parallel factor analysis. Neuroimage. 2004;22(3):1035–1045. | ||
Mørup M, Hansen LK, Herrmann CS, Parnas J, Arnfred SM. Parallel factor analysis as an exploratory tool for wavelet transformed event-related EEG. Neuroimage. 2006;29(3):938–947. | ||
Wang J, Li X, Lu C, Voss LJ, Barnard JP, Sleigh JW. Characteristics of evoked potential multiple EEG recordings in patients with chronic pain by means of parallel factor analysis. Comput Math Methods Med. 2012;2012:279560. | ||
Motohashi K, Umino M. Heterotopic painful stimulation decreases the late component of somatosensory evoked potentials induced by electrical tooth stimulation. Brain Res Cogn Brain Res. 2001;11(1):39–46. | ||
Terkelsen AJ, Andersen OK, Hansen PO, Jensen TS. Effects of heterotopic- and segmental counter-stimulation on the nociceptive withdrawal reflex in humans. Acta Physiol Scand. 2001;172(3):211–217. | ||
Vuilleumier PH, Manresa JA, Ghamri Y, et al. Reliability of quantitative sensory tests in a low back pain population. Reg Anesth Pain Med. 2015;40(6):665–673. | ||
Vuilleumier PH, Besson M, Desmeules J, Arendt-Nielsen L, Curatolo M. Evaluation of anti-hyperalgesic and analgesic effects of two benzodiazepines in human experimental pain: a randomized placebo-controlled study. PLoS One. 2013;8(3):e43896. | ||
Piché M, Watanabe N, Sakata M, et al. Basal μ-opioid receptor availability in the amygdala predicts the inhibition of pain-related brain activity during heterotopic noxious counter-stimulation. Neurosci Res. 2014;81–82:78–84. | ||
Fujii-Abe K, Oono Y, Motohashi K, Fukayama H, Umino M. Heterotopic CO2 laser stimulation inhibits tooth-related somatosensory evoked potentials. Pain Med. 2010;11(6):825–833. | ||
Albu S, Gomez-Soriano J, Avila-Martin G, Taylor J. Deficient conditioned pain modulation after spinal cord injury correlates with clinical spontaneous pain measures. Pain. 2015;156(2):260–272. | ||
Schoen CJ, Ablin JN, Ichesco E, et al. A novel paradigm to evaluate conditioned pain modulation in fibromyalgia. J Pain Res. 2016;9:711–719. | ||
Lewis GN, Heales L, Rice DA, Rome K, McNair PJ. Reliability of the conditioned pain modulation paradigm to assess endogenous inhibitory pain pathways. Pain Res Manag. 2012;17(2):98–102. | ||
Potvin S, Marchand S. Pain facilitation and pain inhibition during conditioned pain modulation in fibromyalgia and in healthy controls. Pain. 2016;157(8):1704–1710. | ||
Terkelsen AJ, Andersen OK, Hansen PO, Jensen TS. Effects of heterotopic- and segmental counter-stimulation on the nociceptive withdrawal reflex in humans. Acta Physiol Scand. 2001;172(3):211–217. | ||
D’Agata F, Cicerale A, Mingolla A, et al. Double-cone coil TMS stimulation of the medial cortex inhibits central pain habituation. PloS One. 2015;10(6):e0128765. | ||
Brock C, Olesen SS, Valeriani M, Arendt-Nielsen L, Drewes AM. Brain activity in rectosigmoid pain: unravelling conditioning pain modulatory pathways. Clin Neurophysiol. 2012;123(4):829–837. | ||
Moont R, Crispel Y, Lev R, Pud D, Yarnitsky D. Temporal changes in cortical activation during conditioned pain modulation (CPM), a LORETA study. Pain. 2011;152(7):1469–1477. | ||
Knyazev GG. Motivation, emotion, and their inhibitory control mirrored in brain oscillations. Neurosci Biobehav Rev. 2007;31(3):377–395. | ||
Steriade M. Grouping of brain rhythms in corticothalamic systems. Neuroscience. 2006;137(4):1087–1106. | ||
Lee MC, Mouraux A, Iannetti GD. Characterizing the cortical activity through which pain emerges from nociception. J Neurosci. 2009;29(24):7909–7916. | ||
Reddy KS, Naidu MU, Rani PU, Rao TR. Human experimental pain models: a review of standardized methods in drug development. J Res Med Sci. 2012;17(6):587–595. | ||
Hermans L, Van Oosterwijck J, Goubert D, et al. Inventory of personal factors influencing conditioned pain modulation in healthy people: a systematic literature review. Pain Pract. 2016;16(6):758–769. | ||
Yarnitsky D, Crispel Y, Eisenberg E, et al. Prediction of chronic post-operative pain: pre-operative DNIC testing identifies patients at risk. Pain. 2008;138(1):22–28. |
 © 2017 The Author(s). This work is published and licensed by Dove Medical Press Limited. The
full terms of this license are available at https://www.dovepress.com/terms
and incorporate the Creative Commons Attribution
- Non Commercial (unported, 3.0) License.
By accessing the work you hereby accept the Terms. Non-commercial uses of the work are permitted
without any further permission from Dove Medical Press Limited, provided the work is properly
attributed. For permission for commercial use of this work, please see paragraphs 4.2 and 5 of our Terms.
© 2017 The Author(s). This work is published and licensed by Dove Medical Press Limited. The
full terms of this license are available at https://www.dovepress.com/terms
and incorporate the Creative Commons Attribution
- Non Commercial (unported, 3.0) License.
By accessing the work you hereby accept the Terms. Non-commercial uses of the work are permitted
without any further permission from Dove Medical Press Limited, provided the work is properly
attributed. For permission for commercial use of this work, please see paragraphs 4.2 and 5 of our Terms.