Back to Journals » International Journal of Nanomedicine » Volume 18
Combined Molybdenum Gelatine Methacrylate Injectable Nano-Hydrogel Effective Against Diabetic Bone Regeneration [Corrigendum]
Liao X, Shen M, Li T, et al. Int J Nanomedicine. 2023;18:5925–5942.
The authors wish to advise, following publication of the article they identified errors were made during the collection and organization of data for Figures 3 and 4 on pages 5934 and 5935, respectively.
The correct Figures 3 and 4 are as follows.
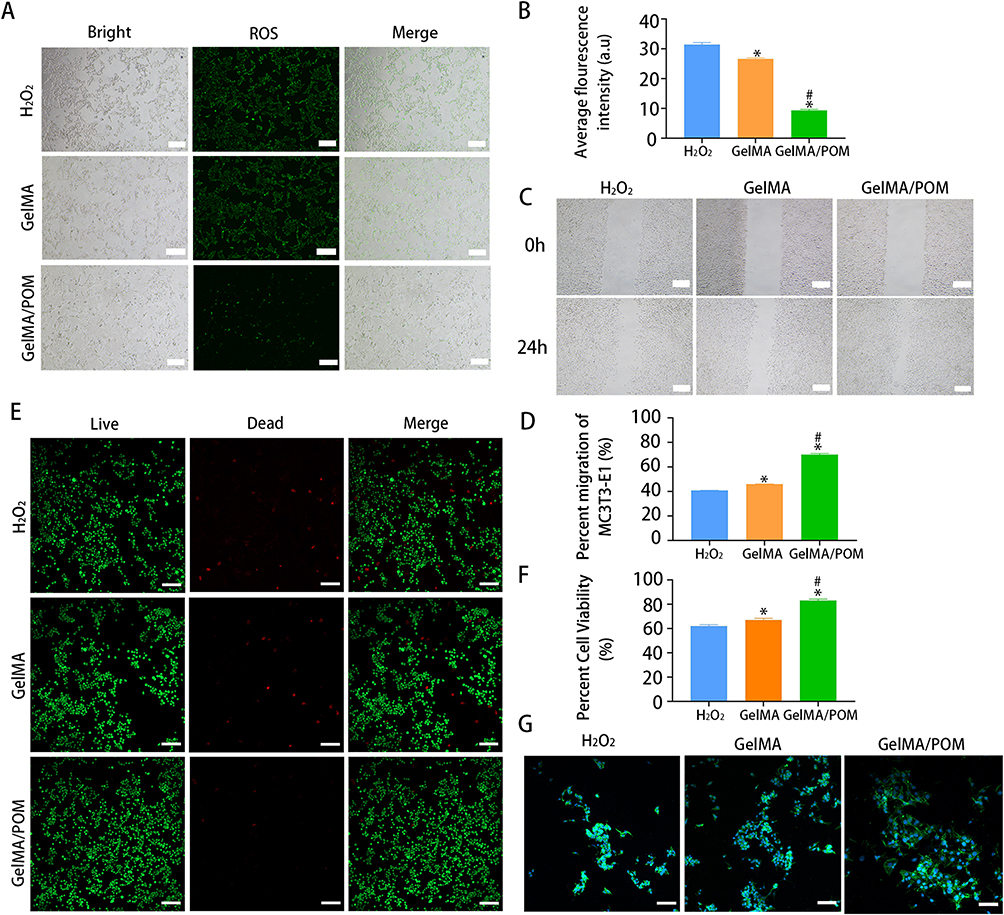 |
Figure 3 Antioxidant properties of POM or hydrogel. (A) DCFH-DA assay showing intracellular ROS of MC3T3-E1 after incubation with POM in the presence of H2O2 (100 μM). (B) Quantification analysis of DCFH-DA staining (*And #Indicate p < 0.05 in comparison with the H2O2 group and GelMA group, respectively.) (C) Cell capacity of migration (scratch test). (D) Quantitative analysis of percent migration in scratch assay. (*And #Indicate p < 0.05 in comparison with the H2O2 group and GelMA group, respectively.) (E) Live/dead staining showing MC3T3-E1 cell viability after culturing on hydrogel in the presence of H2O2. (F) Quantification analysis of live cells. (*And #Indicate p < 0.05 in comparison with the H2O2 group and GelMA group, respectively.) (G) LSCM images showing MC3T3-E1 cultured on different hydrogels following H2O2 treatment. (n = 3, each group). (H2O2, cells cultured on the tissue culture plate with H2O2). Scale bar: 200 μm (A), 200 μm (C), 100 μm (E) and 100 μm (G). |
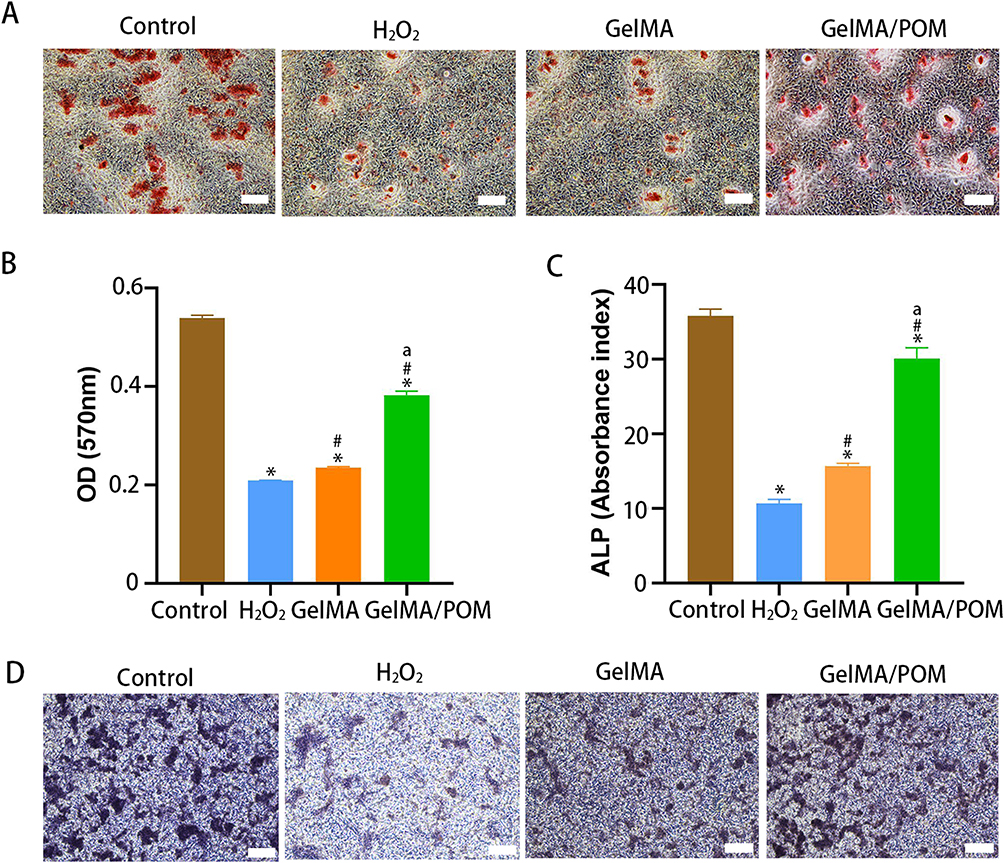 |
Figure 4 The osteogenesis properties of GelMA/POM hydrogel in vitro. In vitro assay of effects of hydrogel on ALP activity and extracellular calcium nodule production during osteogenesis differentiation of MC3T3-E1. (A) Alizarin red S staining. (B) Quantitative analysis of mineralized nodules. (C) Alkaline phosphatase activity. (D) Alkaline phosphatase staining. (*, # And a indicate p < 0.05 in comparison with the Control group, H2O2 group and GelMA group, respectively). (Control, cells cultured without H2O2). (n = 3, each group). Scale bar: 200 μm (A) and 200 μm (D). |
The authors advise these corrections do not significantly impact the overall findings and conclusions of the article or alter the interpretations or validity of the research.
The authors apologize for any confusion these errors may have caused and appreciate the opportunity to rectify them.
 © 2023 The Author(s). This work is published and licensed by Dove Medical Press Limited. The
full terms of this license are available at https://www.dovepress.com/terms
and incorporate the Creative Commons Attribution
- Non Commercial (unported, 3.0) License.
By accessing the work you hereby accept the Terms. Non-commercial uses of the work are permitted
without any further permission from Dove Medical Press Limited, provided the work is properly
attributed. For permission for commercial use of this work, please see paragraphs 4.2 and 5 of our Terms.
© 2023 The Author(s). This work is published and licensed by Dove Medical Press Limited. The
full terms of this license are available at https://www.dovepress.com/terms
and incorporate the Creative Commons Attribution
- Non Commercial (unported, 3.0) License.
By accessing the work you hereby accept the Terms. Non-commercial uses of the work are permitted
without any further permission from Dove Medical Press Limited, provided the work is properly
attributed. For permission for commercial use of this work, please see paragraphs 4.2 and 5 of our Terms.