Back to Journals » OncoTargets and Therapy » Volume 12
Correlations of lncRNAs with cervical lymph node metastasis and prognosis of papillary thyroid carcinoma
Authors Li N, Cui M, Yu P, Li Q
Received 22 October 2018
Accepted for publication 17 January 2019
Published 18 February 2019 Volume 2019:12 Pages 1269—1278
DOI https://doi.org/10.2147/OTT.S191700
Checked for plagiarism Yes
Review by Single anonymous peer review
Peer reviewer comments 2
Editor who approved publication: Dr Arseniy Yuzhalin
Na Li,1,2 Mingming Cui,2 Ping Yu,1 Qiang Li1
1Department of Endocrinology and Metabolism, The 2nd Affiliated Hospital of Harbin Medical University, Harbin, Heilongjiang 150080, China; 2Department of Internal Medicine, Harbin Medical University Cancer Hospital, Harbin Medical University, Harbin, Heilongjiang 150081, China
Background: Cervical lymph node metastasis is an important prognostic indicator for papillary thyroid carcinoma (PTC) and affects treatment strategies for PTC. lncRNAs essentially contribute to the biological functions of tumors. This study aimed to identify the lncRNAs associated with cervical lymph node metastasis and prognosis of PTC and their potential pathophysiological mechanisms.
Materials and methods: PTC-associated lncRNAs were selected from The Cancer Genome Atlas database, and correlations among lncRNAs, lymph node metastasis, tumor staging, and prognosis of PTC were analyzed in silico. These correlations were then validated through quantitative reverse transcription PCR (qRT-PCR) and immunohistochemistry (IHC).
Results: In silico analysis showed that FAM95B1 and UCA1 were significantly correlated with cervical lymph node metastasis, tumor staging, and PTC prognosis (P<0.05). qRT-PCR analysis revealed high UCA1 expression in PTC tissues and correlations between UCA1 expression levels and cervical lymph node metastasis and tumor staging in PTC, that is, higher UCA1 expression resulted in poorer PTC prognosis. IHC analysis revealed that a high expression of UCA1 was accompanied by a high expression of metastasis-related proteins (MMP-2 and MMP-9), thereby validating the correlation of UCA1 expression with metastasis.
Conclusion: FAM95B1 and UCA1 expression was significantly correlated with the occurrence and progression of PTC. The expression levels of UCA1 significantly affected the prognosis of PTC patients and were significantly correlated with tumor staging and cervical lymph node metastasis.
Keywords: papillary thyroid carcinoma, lncRNA, FAM95B1, UCA1
Introduction
The worldwide incidence of thyroid carcinomas has increased over the past decades. An estimated over 64,300 new cases of thyroid cancer occurred in men and women in 2016, leading to 1,980 deaths in USA.1,2 Papillary thyroid carcinoma (PTC) is the most common pathologic type of thyroid carcinoma, accounting for ~60%–70% of all thyroid carcinomas, and patients are prone to cervical lymph node metastasis at an early stage of PTC.3–6 With appropriate treatments such as operation and radioactive iodine ablation, the majority of PTCs have excellent prognoses with an overall survival rate of 97.7% at 5 years.7,8 Nonetheless, up to 20% patients can suffer locoregional recurrence, and occasionally some progress to aggressive and lethal outcomes.9 Molecular mechanisms contributing to its carcinogenesis and progression remain obscure. Thus, it is urgent to identify reliable biomarkers of PTC for its early diagnosis, effective therapy, and prognosis evaluation.
With the rapid advancements in molecular biology techniques, greater emphasis has been gradually placed on the role of non-coding transcripts. lncRNAs, which are >200 nucleotides in length10 and unable to be translated into proteins, may serve as master gene regulators in transcriptional or posttranscriptional level.11 The involvement of lncRNAs in various biological processes such as cell proliferation, differentiation, apoptosis, metabolism, and signal transduction have been reported in numerous studies.12–14 The association of lncRNAs with tumor diseases such as lung cancer, colon cancer, stomach cancer, and breast cancer has been reported previously.15–19 Recently, a few lncRNAs were found to be important regulators of PTC. For instance, a study indicated that lncRNAs (ENST00000426615 and ENST00000537266) might be important regulators of PTC cell proliferation and migration.20 Another study identified lncRNAs that were associated with BRAFV600E oncogenic mutation in PTC.21 However, the understanding of the expression and function of lncRNAs is still at a preliminary stage. The present study aimed to identify significant prognostic lncRNAs using data from public database, followed by experimental validation and investigation of association between lncRNAs expression level and clinicopathologic characteristics of PTC. The lncRNAs identified may assist us in evaluating disease status and prognosis for PTC patients.
Materials and methods
In silico analysis of gene expression data
Clinical data on PTC and gene expression data (RNASeqV2) of PTC were downloaded from The Cancer Genome Atlas (TCGA) database.22 Known lncRNAs and their expression profiles were screened on the basis of records from the GENCODE database.23 Then, the RNA-seq count data were normalized by the voom function24 of the R package limma.25 The voom method estimates the mean–variance relationship of the log-counts, generates a precision weight for each individual normalized observation, and enters these into the limma analysis pipeline.24 lncRNAs with significant differential expression in paracancerous and cancerous tissue were subsequently screened using empirical Bayes method of limma.25 Fold change >2 and corrected P-value <0.05 were set as the threshold for significant differential expression. A volcano plot for differential expression was drawn using R plot function.26 The optimal cutoff points for each lncRNA with expression value were determined using receiver operating characteristic (ROC) curves. Patients were then divided into the high-expression group and low-expression group based on the optimal cutoff points, and differences in prognosis between the two groups were compared. Kaplan–Meier (KM) survival curves were plotted on the basis of test results of each lncRNA, and the log-rank test was performed to calculate the P-values for KM curves. Differences in survival between the two groups were considered significant when P<0.05. In addition, lncRNAs were identified with the area under the ROC curve (AUC) value >0.6 and P-values for KM curves as the threshold; these lncRNAs could well distinguish adjacent noncancerous control tissues from tumor tissues and their expression levels had significant impact on patient prognosis.
Moreover, using the lncRNA threshold obtained from the ROC curve, patients were divided into high-expression and low-expression groups. Patients were divided into lymph node metastasis group and non-metastasis group according to clinical information, and then chi-squared test of independence was used to determine if there was a significant relationship between lncRNA expression and lymph node metastasis. On the other hand, patients were grouped into stage I, II, III, and IV according to the clinical information. Chi-squared test was performed to assess the association between gene expression and tumor stage. The P-value by chi-squared test was obtained.
The target genes for the prognosis-related lncRNAs were predicted based on co-expression relationship. Genes with absolute value of the correlation coefficient greater than 0.5 and false discovery rate <0.01 were predicted as potential targets for lncRNA. Subsequently, functional enrichment analysis was performed on the target genes of prognosis-related lncRNAs using the database for annotation, visualization, and integrated discovery (DAVID) tool with the cutoff of P-value being <0.05.
Quantitative reverse transcription PCR (qRT-PCR) validation
A total 40 pairs of cancerous tissue and matched paracancerous tissue specimens and 15 metastatic cervical lymph node tissue specimens were collected from patients with PTC, who underwent surgical treatment at the Affiliated Cancer Hospital of Harbin Medical University between January 2016 and May 2016. All specimens were collected after obtaining written informed consent from the patients in accordance with the tenets of the Declaration of Helsinki and approval from the ethics committee of the hospital. After resection, specimens were immediately placed in RNA protection buffer and stored at −80°C freezer until use. The PTC patients included 30 female and 10 male patients aged 27–60 years, and complete clinical data (age, sex, family history, past medical history, clinical stage, pathologic diagnosis, tumor size, number, morphology, pathologic grade, metastatic cervical lymph nodes, surgical procedures) were collected. Clinical staging of thyroid cancer was performed in accordance with the American Joint Committee on Cancer Staging System for Thyroid Cancer published in 2010.
Total RNA was extracted from fresh frozen tissue specimens using TRIzol reagent (Thermo Fisher Scientific, Waltham, MA, USA) in accordance with manufacturer’s instructions. Based on the instructions provided with the Transcriptor First Strand cDNA Synthesis Kit (Roche, Brussels, Belgium), the reverse transcription reagent was added, and total RNA was reverse transcribed into cDNA using a conventional PCR machine (Thermo Fisher Scientific). Using the synthesized cDNA as a template, qPCR was performed with the addition of an RNA fluorescence reagent in accordance with the manufacturer’s instructions. The following primers were used: UCA1 forward primer: 5′-ACGCTAACTGGCACCTTGTT-3′, reverse primer: 5′-TGGGGATTACTGGGGTAGGG-3′; GAPDH forward primer: 5′-GAAGGTGAAGGTCGGAGTC-3′, reverse primer: 5′-GAAGATGGTGGGATTTC-3′. The cycling conditions were as follows: 95°C for 5 minutes, followed by 45 cycles of 95°C for 5 seconds, 60°C for 15 seconds, and 70°C for 15 seconds. The expression level of UCA1 was normalized to the internal control GAPDH and the relative expression level of UCA1 in cancerous tissue, paracancerous tissue, and metastatic lymph nodes was calculated using the 2−ΔΔCT method.
Immunohistochemistry (IHC) analysis
Tissue samples were fixed, dehydrated, cleared, and processed into conventional paraffin blocks, which were then cut into 5 μm sections and adhered to polylysine-coated glass slides. The sections were then deparaffinized. Benzene was removed, and the antigens were retrieved using citric acid. Then 3% of H2O2 was used for blocking the sections and MMP-2 or MMP-9 antibodies, both diluted to 1:200, were added (anti-MMP-2 antibody [ab37150], anti-MMP-9 antibody [ab73734]; Abcam, Cambridge, MA, USA). The sections were incubated at 4°C overnight, washed with PBS for three times, and incubated with the working solution of the secondary antibody (Beijing Zhongshan gold bridge Biotechnology Co., Ltd) at room temperature (25°C) for 30 minutes. Diaminobenzidine was used as a chromogen (Beijing Zhongshan gold bridge Biotechnology Co., Ltd), hematoxylin was used for counterstaining, and neutral resin was used to seal the film.
Expression of MMP-2 and MMP-9 was considered positive when yellowish-brown and/or brown particles were observed in the cytoplasm. Samples without color were considered negative. Five high magnification fields or 500 cells were counted. A score was given according to the staining intensity: 0 for absence of color (no staining), 1 for light yellow color (weak staining), 2 for yellowish-brown color (medium staining), and 3 for brown color (strong staining). A score was calculated based on the percentage of positively stained tumor cells in a sample: 0 represented absence of positive tumor cells, 1 represented <10% of positive tumor cells, 2 represented 10%–50% of positive tumor cells, and 3 represented >50% of positive tumor cells. The scores for staining intensity and those for percentages of positive tumor cells were multiplied, and the product was used as the staining index. Using this method, the staining indices for MMP-2 and MMP-9 expression in PTC were 0, 1, 2, 3, 4, 6, or 9. High expression was defined as an index ≥4 and low expression as an index <4.
Statistical analysis
SPSS 20.0 software (IBM Corporation, Armonk, NY, USA) was used for statistical analysis. The paired t-test was performed to compare differences in UCA1 expression levels between matched cancer tissues and adjacent normal tissues, while unpaired t-test was performed to compare UCA1 expression levels in cancerous tissues with those in metastatic lymph nodes. Chi-squared test was performed to analyze the association between UCA1 expression levels in patients and their clinical characteristics in a 2×2 contingency table. Chi-squared test was also performed to analyze the association between UCA1 expression levels in patients and the expression of metastasis-related proteins (MMP-2 and MMP-9). Differences were considered statistically significant when P<0.05.
Results
In silico analysis of lncRNAs associated with PTC
Characteristics of gene expression data and differential expression analysis
A total of 557 samples comprising 500 cancerous tissue samples and 57 paracancerous tissue samples were collected from the TCGA database. Clinical data were available for 506 samples (survival data and tumor expression samples were available for 499 patients). Based on the records from the GENCODE database, 110 lncRNAs with expression values were identified (Table S1).
Then, 21 differentially expressed lncRNAs were identified using limma software (Table 1). The volcano plot of lncRNAs with differential expression is shown in Figure S1.
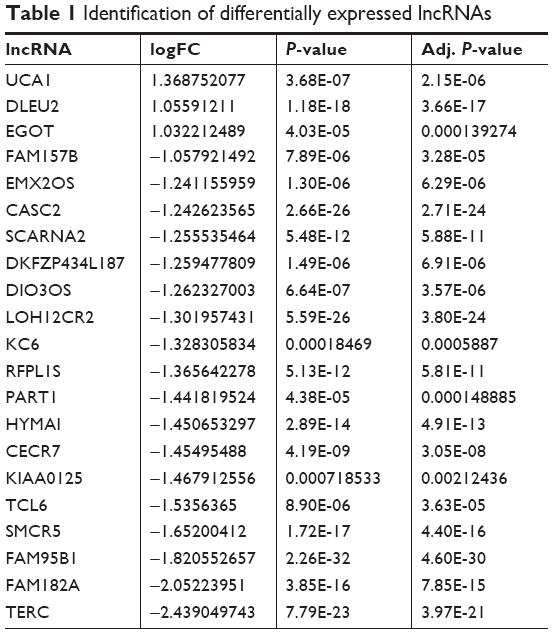 | Table 1 Identification of differentially expressed lncRNAs |
lncRNAs significantly affecting PTC prognosis
Using AUC ≥0.6 and P<0.05 for KM survival curves as the screening criteria, three lncRNAs (FAM95B1, HCG22, and UCA1) were identified which could well distinguish paracancerous tissue from cancerous tissue, and their expression level significantly affected patient prognosis (Table 2). In particular, FAM95B1 was downregulated in tumors, and KM plot showed that lower expression values of FAM95B1 were associated with lower survival probabilities. However, UCA1 was upregulated in tumors, and KM plot showed that higher expression values of UCA1 were associated with lower survival probabilities (Figure 1).
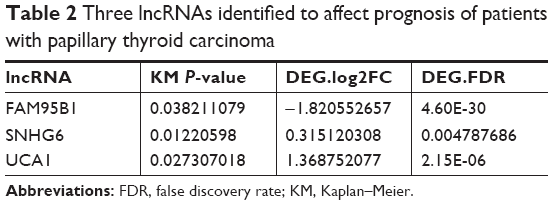 | Table 2 Three lncRNAs identified to affect prognosis of patients with papillary thyroid carcinoma |
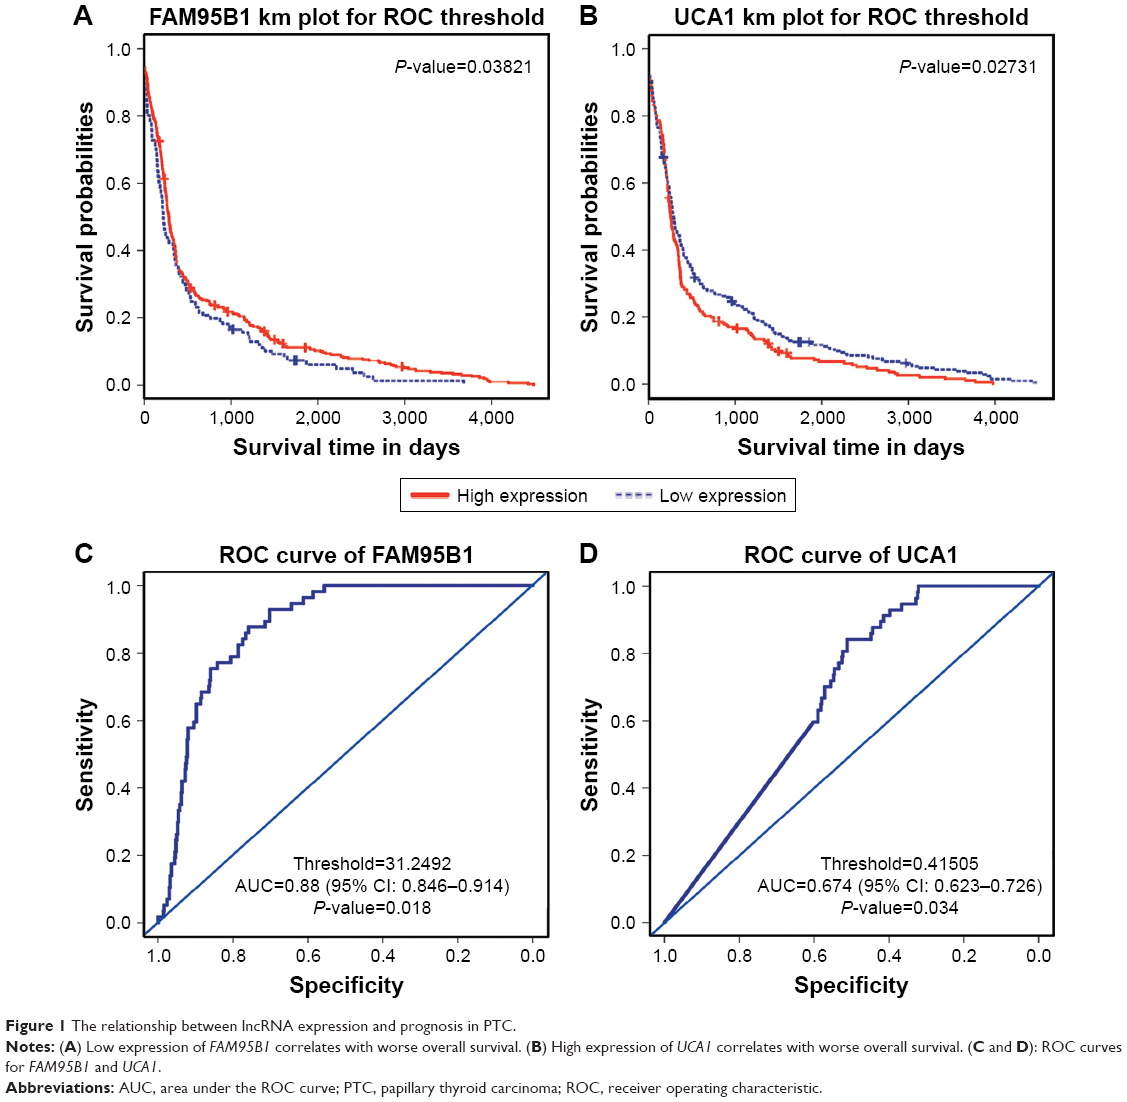 | Figure 1 The relationship between lncRNA expression and prognosis in PTC. |
Association between lncRNA expression levels and lymph node metastasis
A significant correlation (P<0.05) was obtained between expression levels and lymph node metastasis in 66 lncRNAs (Table S2), including 2 of the 3 lncRNAs (FAM95B1 and UCA1) with a significant effect on prognosis (Table 3).
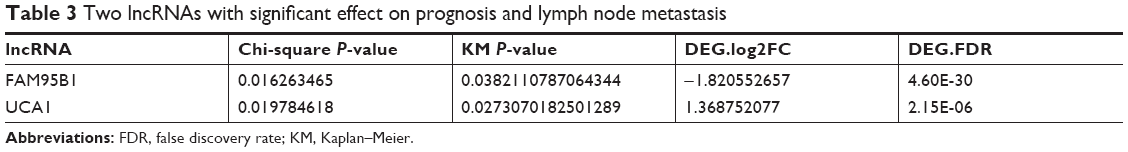 | Table 3 Two lncRNAs with significant effect on prognosis and lymph node metastasis |
Lymph node metastasis was unknown in 49 of the 499 patients, with an effective data rate of 90.2%. Among the remaining 450 patients, 223 patients had lymph node metastasis, including 40 cases (17.9%) in the FAM95B1 high-expression group and 183 (82.1%) cases in the FAM95B1 low-expression group. Also, 227 cases were included in the lymph node non-metastasis group, including 67 cases (29.5%) in the FAM95B1 high-expression group and 160 cases (70.5%) in the FAM95B1 low-expression group. Chi-squared test showed that the expression level of FAM95B1 was associated with lymph node metastasis (P<0.05). Similarly, for UCA1, in the lymph node metastasis group, there were 135 (60.5%) cases with high expression of UCA1 and 88 (39.5%) cases with low expression of UCA1; in the lymph node non-metastasis group, there were 103 (45.4%) cases with high expression of UCA1 and 124 cases (54.6%) with low expression of UCA1. Chi-squared test showed that the expression of UCA1 was associated with lymph node metastasis (P<0.05).
Association between lncRNA expression level and tumor staging
Expression levels of 34 lncRNAs were associated with tumor staging (P<0.05; Table S3), which included FAM95B1 and UCA1 (Table 4). Among the 499 patients, 2 patients had unknown tumor stage, and the data efficiency was 99.6%. Among the remaining 497 patients, there were 282 patients in stage I, including 75 (26.6%) in the FAM95B1 high-expression group and 207 (73.4%) in the low-expression group; there were 52 patients in stage II, including 14 (26.9%) in the FAM95B1 high-expression group and 38 cases (73.1%) in the low-expression group; there were 110 patients in stage III, including 18 cases (16.4%) in the FAM95B1 high-expression group and 92 cases (83.6%) in the low-expression group. Of the 53 patients in stage IV, 14 (26.4%) had high expression of FAM95B1 and 39 (73.6%) had low expression of FAM95B1. Chi-squared test showed that the expression level of FAM95B1 was related to tumor stage (P<0.05). For UCA1, in the stage I group, there were 140 cases (49.7%) with high expression of UCA1 and 142 cases (50.3%) with low expression of UCA1. In the stage II group, there were 18 cases (34.6%) with high expression of UCA1 and 34 cases (65.4%) with low expression of UCA1. In the stage III group, there were 64 cases (58.2%) with high expression of UCA1 and 46 cases (41.8%) with low expression of UCA1. In the stage IV group, there were 34 cases (64.2%) with high expression of UCA1 and 19 patients (35.8%) with low expression of UCA1. Chi-squared test showed that the expression of UCA1 was related to tumor stage (P<0.05).
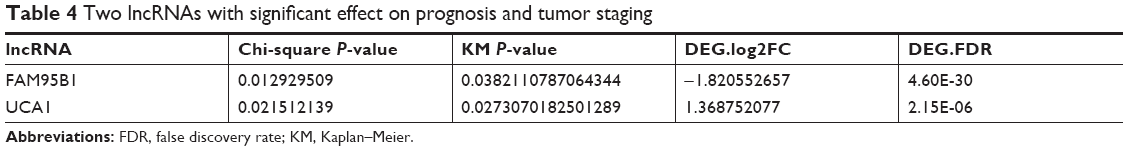 | Table 4 Two lncRNAs with significant effect on prognosis and tumor staging |
Target gene prediction and lncRNA functional analysis
A total of 316 target genes and 6 target genes were predicted for FAM95B1 and UCA1, respectively. Then, Gene Ontology (GO) and Kyoto Encyclopedia of Genes and Genomes (KEGG) pathway enrichment analysis were carried out based on the target genes of FAM95B1 and UCA1. No significant GO terms and pathways were identified for UCA1. On the other hand, the functional enrichment analysis revealed that FAM95B1 was associated with various pathways, such as oncogenic pathways, lipid metabolic pathways, glycerophospholipid metabolic pathways, and lysine degradation pathways (Figure 2).
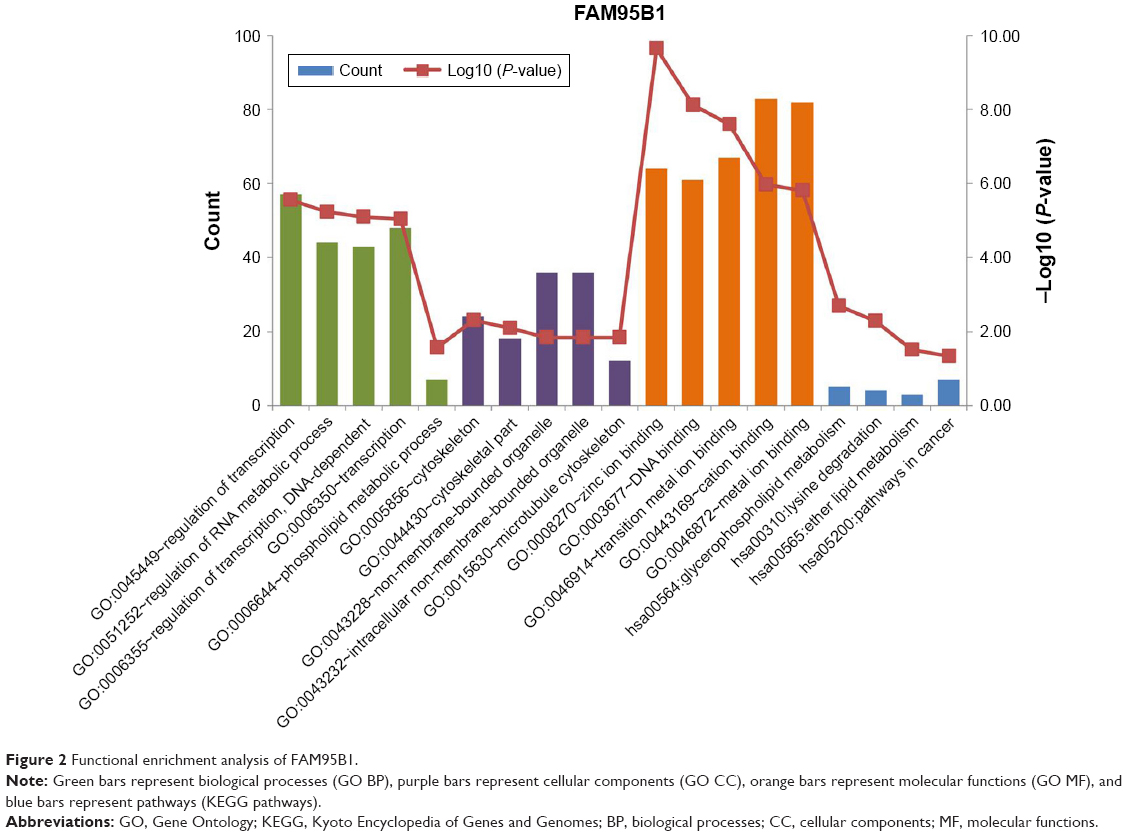 | Figure 2 Functional enrichment analysis of FAM95B1. |
qRT-PCR validation
UCA1 expression levels were significantly higher in PTC tissues than in the matched paracancerous tissues (P<0.05). In addition, UCA1 expression levels were significantly higher in metastatic cervical lymph node tissues than in the primary tumor tissues (P<0.01; Figure 3). Therefore, UCA1 was highly expressed in PTC tissues, and its expression levels correlated with cervical lymph node metastasis.
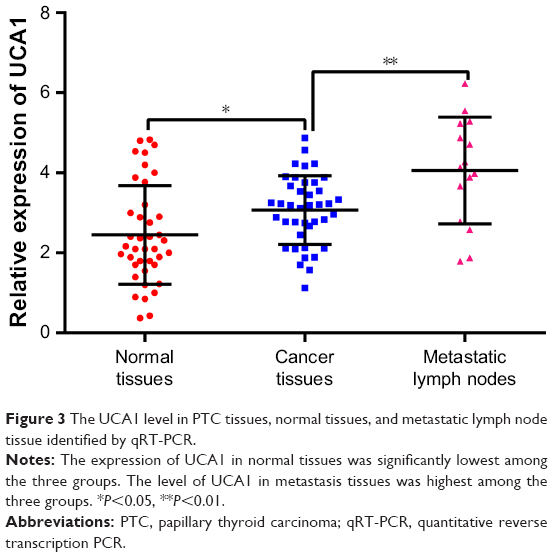 | Figure 3 The UCA1 level in PTC tissues, normal tissues, and metastatic lymph node tissue identified by qRT-PCR. |
Correlation between UCA1 expression levels and clinicopathologic characteristics of PTC
The association between UCA1 expression levels in tumor tissues and clinicopathologic characteristics of PTC patients is shown in Table 5. There were no significant differences in UCA1 expression levels between sexes and different age groups (P>0.05), and UCA1 expression was not significantly correlated with tumor size (P>0.05). However, UCA1 expression levels were significantly higher in the cervical lymph node metastasis group than in the non-metastasis group, and in clinical stage III/IV patients than in stage I and stage II patients (P<0.05).
 | Table 5 Correlation between UCA1 expression and clinicopathologic characteristics of PTC patients |
Patients with high expression of UCA1 had high expression levels of MMP-2 and MMP-9
MMP-2 and MMP-9 were mainly expressed in the cytoplasm, and their expression levels were positively correlated with lymph node metastases in PTC (P=0.0022 and P=0.0072, respectively; Table 6). Results from IHC showed that MMP-2 and MMP-9 were highly expressed in samples with high expression of UCA1. Contrarily, MMP-2 and MMP-9 expression were low in patients with low expression of UCA1 (P=0.0457 and P=0.0238, respectively; Table 7). These results indicated that the high expression of UCA1 was accompanied by the high expression of metastasis-related proteins (MMP-2 and MMP-9), suggesting that UCA1 expression was correlated with metastasis (Figure 4).
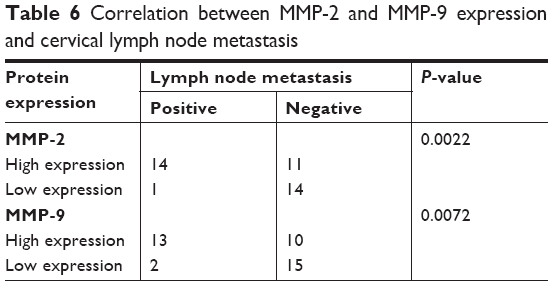 | Table 6 Correlation between MMP-2 and MMP-9 expression and cervical lymph node metastasis |
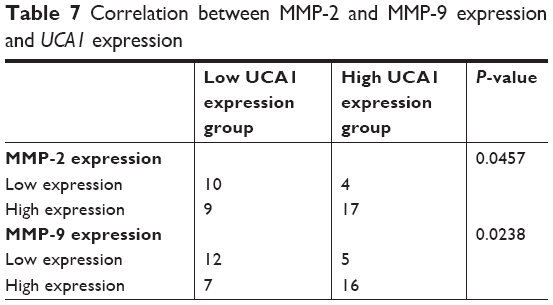 | Table 7 Correlation between MMP-2 and MMP-9 expression and UCA1 expression |
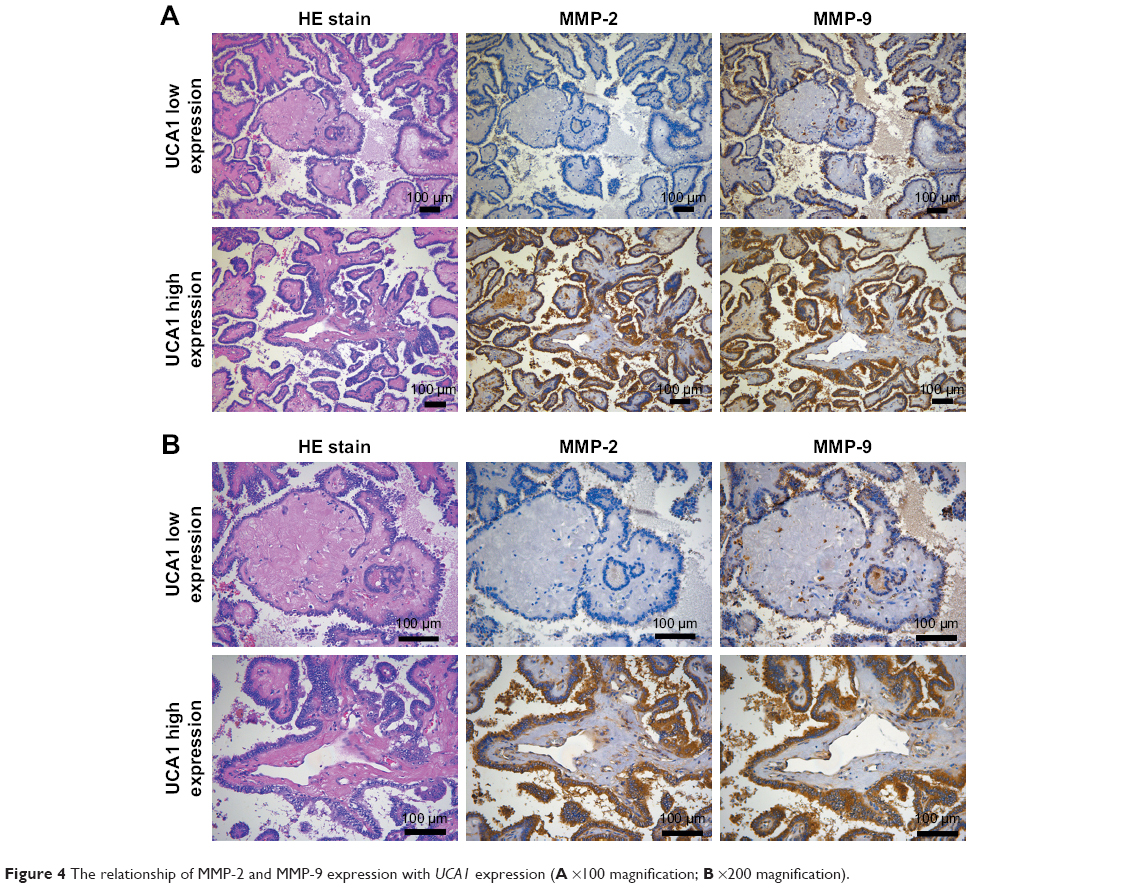 | Figure 4 The relationship of MMP-2 and MMP-9 expression with UCA1 expression (A ×100 magnification; B ×200 magnification). |
Discussion
The role of lncRNA in tumorigenesis and tumor development has received increasing interest in oncology research. Numerous lncRNAs display altered expression levels in human cancers, including lung cancer, colon cancer, gastric cancer, and breast cancer.15–19 In this study, in silico analyses were performed to identify PTC-related lncRNA. Based on the analyses, lncRNAs that significantly affected prognosis, lymph node metastases, and tumor stage were respectively selected. This study focused on lncRNAs (FAM95B1 and UCA1) that significantly affected prognosis while being concurrently associated with lymph node metastases and tumor stage. Of these two lncRNAs, FAM95B1 was downregulated in PTC and its expression level was positively correlated with the survival rates of patients. However, UCA1 was upregulated in cancer and its expression level was negatively correlated with the survival rates of PTC patients.
The upregulation of UCA1 promotes invasion and migration of numerous types of cancer, including gastric cancer, lung cancer, hepatocellular carcinoma, and pancreatic cancer.27–31 Recently, the investigation of Liu et al showed that UCA1 was upregulated in PTC tissues and cell lines and knockdown of UCA1 significantly inhibited proliferation and migration of PTC cells through regulating miR-204/IGFBP5 axis.32 Two other studies also indicated the role of UCA1 in stimulating proliferation of PTC cells.33,34 In line with these previous studies, we found that UCA1 was upregulated in PTC tissues and associated with prognosis by public data investigation. To further explore the clinical significance of UCA1 in PTC, qRT-PCR analysis was performed to determine UCA1 expression levels in PTC tissue, adjacent noncancerous control tissues, and metastatic cervical lymph nodes. UCA1 expression levels were significantly higher in PTC tissue than in adjacent noncancerous control tissues. In addition, UCA1 expression levels were the highest in the metastatic cervical lymph nodes and were higher than those in the primary tumor. This finding suggested that UCA1 expression was significantly correlated with cervical lymph node metastases. Statistical analyses of the relationships between UCA1 expression levels and the clinicopathologic features of PTC also revealed that UCA1 expression levels correlated with lymph node metastases and tumor stage. Thus, these results suggest that UCA1 may be an effective target for PTC treatment.
Degradation of the extracellular matrix and basement membrane is necessary for local invasion or metastases of malignant tumors.35 MMP-2 and MMP-9, members of MMP family, are mainly involved in the decomposition of type IV collagen, thereby degrading the basement membrane and promoting tumor invasion and metastases.36 Studies have shown that the expression of MMP-2 and MMP-9 is positively correlated with lymph node metastases and degree of tumor invasion in PTC.37,38 In order to further verify the correlation of UCA1 expression with cervical lymph node metastasis, IHC experiments were carried out to verify the correlation between UCA1 and lymph node metastases. We detected high levels of MMP-2 and MMP-9 in samples with high UCA1 expression. Our results indicate that upregulation of UCA1 is associated with an increased expression of metastasis-related proteins, suggesting its relation with lymph node metastases in PTC.
FAM95B1 is a new type of lncRNA and its relationship with cancer has not been previously reported. In silico analysis revealed that FAM95B1 was downregulated in PTC, which was also correlated with cervical lymph node metastases and tumor stage. Furthermore, patients with lower expression of FAM95B1 had lower survival rates. GO and KEGG analyses of FAM95B1 revealed that FAM95B1 was related to cancer signaling pathways and metabolic pathways. The biological functions and detailed mechanisms of FAM95B1 were not elucidated, and more investigation is underway.
Overall, the comprehensive study of FAM95B1 and UCA1 in this work broadens the oncogenic lncRNA landscape of PTC. This study revealed FAM95B1 and UCA1 as potential biological markers, and may aid in the prognosis and the comprehensive management of PTC.
Ethical approval
The project was approved by the Ethics Committees of Harbin Medical University Cancer Hospital, Harbin Medical University
Informed consent
Informed consent was obtained from all individual participants included in the study. This article does not contain any study with animals performed by any of the authors.
Acknowledgment
This work is supported by the National Natural Science Foundation of China (Nos 81370902 and 81170744) and Research Project of Health Commission of Heilongjiang Province (No. 2017-121).
Disclosure
The authors report no conflicts of interest in this work.
References
Antonelli A, La Motta C. Novel therapeutic clues in thyroid carcinomas: the role of targeting cancer stem cells. Med Res Rev. 2017;37(6):1299–1317. | ||
Siegel RL, Miller KD, Jemal A. Cancer statistics, 2016. CA Cancer J Clin. 2016;66(1):7–30. | ||
Weeks KS, Kahl AR, Lynch CF, Charlton ME. Racial/ethnic differences in thyroid cancer incidence in the United States, 2007–2014. Cancer. 2018;124(7):1483–1491. | ||
Davies L, Welch HG. Current thyroid cancer trends in the United States. JAMA Otolaryngol Head Neck Surg. 2014;140(4):317–322. | ||
Kitahara CM, Sosa JA. The changing incidence of thyroid cancer. Nat Rev Endocrinol. 2016;12(11):646–653. | ||
Vergamini LB, Frazier AL, Abrantes FL, Ribeiro KB, Rodriguez-Galindo C. Increase in the incidence of differentiated thyroid carcinoma in children, adolescents, and young adults: a population-based study. J Pediatr. 2014;164(6):1481–1485. | ||
Luo YH, Liang L, He RQ, et al. RNA-sequencing investigation identifies an effective risk score generated by three novel lncRNAs for the survival of papillary thyroid cancer patients. Oncotarget. 2017;8(43):74139. | ||
He Y, Pan MZ, Huang JM, Xie P, Zhang F, Wei LG. Iodine-131: an effective method for treating lymph node metastases of differentiated thyroid cancer. Med Sci Monit. 2016;22:4924–4928. | ||
Schlumberger MJ. Papillary and follicular thyroid carcinoma. N Engl J Med. 1998;338(5):297–306. | ||
Prensner JR, Chinnaiyan AM. The emergence of lncRNAs in cancer biology. Cancer Discov. 2011;1(5):391–407. | ||
Yoon JH, Abdelmohsen K, Gorospe M. Posttranscriptional gene regulation by long noncoding RNA. J Mol Biol. 2013;425(19):3723–3730. | ||
Gupta RA, Shah N, Wang KC, et al. Long non-coding RNA HOTAIR reprograms chromatin state to promote cancer metastasis. Nature. 2010;464(7291):1071–1076. | ||
Bhan A, Soleimani M, Mandal SS. Long noncoding RNA and cancer: a new paradigm. Cancer Res. 2017;77(15):3965–3981. | ||
Marchese FP, Raimondi I, Huarte M. The multidimensional mechanisms of long noncoding RNA function. Genome Biol. 2017;18(1):206. | ||
Ma MZ, Chu BF, Zhang Y, et al. Long non-coding RNA CCAT1 promotes gallbladder cancer development via negative modulation of miRNA-218-5p. Cell Death Dis. 2015;6(1):e1583. | ||
White NM, Maher CA. The potential use of lncRNAs found in the 8q24 region as biomarkers for colon cancer. Ann Oncol. 2017;28(8):1688–1689. | ||
Li Y, Zhu G, Ma Y, Qu H. LncRNA CCAT1 contributes to the growth and invasion of gastric cancer via targeting miR-219-1. J Cell Biochem. 2017;12(10):26560. | ||
Hao NB, He YF, Li XQ, Wang K, Wang RL. The role of miRNA and lncRNA in gastric cancer. Oncotarget. 2017;8(46):81572. | ||
Qu CH, Sun QY, Zhang FM, Jia YM. Long non-coding RNA ROR is a novel prognosis factor associated with non-small-cell lung cancer progression. Eur Rev Med Pharmacol Sci. 2017;21(18):4087–4091. | ||
Xu B, Shao Q, Xie K, et al. The long non-coding RNA ENST00000537266 and ENST00000426615 influence papillary thyroid cancer cell proliferation and motility. Cell Physiol Biochem. 2016;38(1):368–378. | ||
Goedert L, Plaça JR, Fuziwara CS, et al. Identification of long noncoding RNAs deregulated in papillary thyroid cancer and correlated with BRAFV600E mutation by bioinformatics integrative analysis. Sci Rep. 2017;7(1):1662. | ||
Tomczak K, Czerwinska P, Wiznerowicz M. The Cancer Genome Atlas (TCGA): an immeasurable source of knowledge. Contemp Oncol. 2015;19(1A:47136. | ||
Harrow J, Frankish A, Gonzalez JM, et al. GENCODE: the reference human genome annotation for the ENCODE Project. Genome Res. 2012;22(9):1760–1774. | ||
Law CW, Chen Y, Shi W, Smyth GK. voom: precision weights unlock linear model analysis tools for RNA-seq read counts. Genome Biol. 2014;15(2):R29–R2015. | ||
Ritchie ME, Phipson B, Wu D, et al. limma powers differential expression analyses for RNA-sequencing and microarray studies. Nucleic Acids Res. 2015;43(7):e47–e47. | ||
Durinck S. Pre-processing of microarray data and analysis of differential expression. Methods Mol Biol. 2008;452:89–110. | ||
Li T, Sun X, Jiang X. UCA1 involved in the metformin-regulated bladder cancer cell proliferation and glycolysis. Tumour Biol. 2017;39(6):101042831771082. | ||
Nasrollahzadeh-Khakiani M, Emadi-Baygi M, Nikpour P. Augmented expression levels of lncRNAs ecCEBPA and UCA1 in gastric cancer tissues and their clinical significance. Iran J Basic Med Sci. 2017;20(10):1149. | ||
Wang HM, Lu JH, Chen WY, Gu AQ. Upregulated lncRNA-UCA1 contributes to progression of lung cancer and is closely related to clinical diagnosis as a predictive biomarker in plasma. Int J Clin Exp Med. 2015;8(7):11824. | ||
Li J, Gao J, Kan A, Hao T, Huang L. SNHG and UCA1 as prognostic molecular biomarkers in hepatocellular carcinoma: recent research and meta-analysis. Minerva Med. 2017;108(6):568–574. | ||
Chen P, Wan D, Zheng D, Zheng Q, Wu F, Zhi Q. Long non-coding RNA UCA1 promotes the tumorigenesis in pancreatic cancer. Biomed Pharmacother. 2016;83:1220–1226. | ||
Liu H, Li R, Guan L, Jiang T. Knockdown of lncRNA UCA1 inhibits proliferation and invasion of papillary thyroid carcinoma through regulating miR-204/IGFBP5 axis. Onco Targets Ther. 2018;11:7197–7204. | ||
Lu HW, Liu XD. UCA1 promotes papillary thyroid carcinoma development by stimulating cell proliferation via Wnt pathway. Eur Rev Med Pharmacol Sci. 2018;22(17):5576–5582. | ||
Li D, Cui C, Chen J, Hu Z, Wang Y, Hu D. Long non-coding RNA UCA1 promotes papillary thyroid cancer cell proliferation via miR-204-mediated BRD4 activation. Mol Med Rep. 2018;18(3):3059–3067. | ||
Kleiner DE, Stetler-Stevenson WG. Matrix metalloproteinases and metastasis. Cancer Chemother Pharmacol. 1999;43 Suppl(7):S42–S51. | ||
Bauvois B. New facets of matrix metalloproteinases MMP-2 and MMP-9 as cell surface transducers: outside-in signaling and relationship to tumor progression. Biochim Biophys Acta. 2012;1825(1):29–36. | ||
Luo D, Chen H, Li X, et al. Activation of the ROCK1/MMP-9 pathway is associated with the invasion and poor prognosis in papillary thyroid carcinoma. Int J Oncol. 2017;51(4):1209–1218. | ||
Huang LL, Wang Z, Cao CJ, et al. AEG-1 associates with metastasis in papillary thyroid cancer through upregulation of MMP2/9. Int J Oncol. 2017;51(3):812–822. |
 © 2019 The Author(s). This work is published and licensed by Dove Medical Press Limited. The
full terms of this license are available at https://www.dovepress.com/terms
and incorporate the Creative Commons Attribution
- Non Commercial (unported, 3.0) License.
By accessing the work you hereby accept the Terms. Non-commercial uses of the work are permitted
without any further permission from Dove Medical Press Limited, provided the work is properly
attributed. For permission for commercial use of this work, please see paragraphs 4.2 and 5 of our Terms.
© 2019 The Author(s). This work is published and licensed by Dove Medical Press Limited. The
full terms of this license are available at https://www.dovepress.com/terms
and incorporate the Creative Commons Attribution
- Non Commercial (unported, 3.0) License.
By accessing the work you hereby accept the Terms. Non-commercial uses of the work are permitted
without any further permission from Dove Medical Press Limited, provided the work is properly
attributed. For permission for commercial use of this work, please see paragraphs 4.2 and 5 of our Terms.