Back to Journals » Clinical Ophthalmology » Volume 14
Correlations Between Optical Coherence Tomography Angiography Parameters and the Visual Acuity in Patients with Diabetic Retinopathy
Authors Abdelshafy M ![]() , Abdelshafy A
, Abdelshafy A ![]()
Received 8 February 2020
Accepted for publication 2 April 2020
Published 23 April 2020 Volume 2020:14 Pages 1107—1115
DOI https://doi.org/10.2147/OPTH.S248881
Checked for plagiarism Yes
Review by Single anonymous peer review
Peer reviewer comments 2
Editor who approved publication: Dr Scott Fraser
Marwa Abdelshafy, Ahmed Abdelshafy
Ophthalmology Department, Benha Faculty of Medicine, Benha University, Benha, Egypt
Correspondence: Marwa Abdelshafy
Ophthalmology Department, Benha Faculty of Medicine, Benha University, 1 El Amira Fawzya Street, Benha, Qalubiya Governorate 13512, Egypt
Email [email protected]
Aim: The aim of this study was to assess the correlation between different optical coherence tomography angiography (OCTA) parameters and the best corrected visual acuity (BCVA) in patients with diabetic retinopathy (DR).
Patients and Methods: Sixty eyes of 60 participants were included in this prospective study: 40 diabetic patients [20 with non-proliferative diabetic retinopathy (NPDR group), 20 with proliferative diabetic retinopathy (PDR group)] and 20 age- and gender-matched normal healthy subjects (control group). After full ophthalmological examination and fundus fluorescein angiography, OCTA was performed for all participants. Quantitative OCTA parameters, such as the foveal avascular zone (FAZ) area, the superficial capillary plexus vessel density (%) (SCP-VD) and the deep capillary plexus vessel density (%) (DCP-VD) in, whole and parafoveal areas were measured. Correlations between BCVA and OCTA parameters were analyzed.
Results: There were no statistically significant differences between groups regarding age, gender, refraction, macular thickness or intraocular pressure. The median (IQR) FAZ area was 0.42 (0.39– 0.46) mm2 in the NPDR group, 0.54 (0.45– 0.65) mm2 in the PDR group and 0.24 (0.21– 0.26) mm2 in the control group (P< 0.001). The FAZ area increased with increasing severity of DR. SCP-VD and DCP-VD showed significant differences between groups (P< 0.001). Vessel density (VD) was decreased in both DCP and SCP as DR progressed. There was a significant positive correlation between BCVA (LogMAR) and FAZ area. There were significant negative correlations between BCVA (LogMAR) and VD in both SCP and DCP. Stepwise multiple linear regression analysis demonstrated that SCP-VD in the whole area and DCP-VD in the parafoveal area were the best predictive factors for BCVA in the NPDR and PDR groups.
Conclusion: With progression of DR, the VD decreased and the FAZ area increased, and both parameters were correlated with poor visual acuity. OCTA is a non-invasive tool which can be used to detect diabetic macular ischemia and help in the prediction of visual prognosis.
Keywords: visual acuity, OCT angiography, vessel density, foveal avascular zone, diabetic retinopathy
Introduction
Diabetic retinopathy (DR) is considered the leading cause of defective vision in developed countries.1 Fluorescein angiography (FA) is commonly used in imaging and monitoring the progression of DR. Currently, with advances in optical coherence tomography angiography (OCTA), it serves as an adjunctive, non-invasive and rapid imaging technique for detecting microvascular diabetic changes, especially diabetic macular ischemia, and can help in the prediction of visual prognosis in these patients.2,3
Optical coherence tomography (OCT) can provide high-resolution cross-sectional scans of the retinal microstructure and is considered a standard tool for detecting and monitoring diabetic maculopathy.4,5 OCTA is a novel tool that permits quantitative analysis of retinal and choroidal blood flow, without the need for dye injection, by performing high-contrast repeated scan images of the retinal and choroidal microvascular bed to detect the motion change signals from the red blood cells moving inside the blood vessels.2,6-8
The retinal microvascular changes in DR may lead to visually fatal complications, including macular ischemia, neovascularization and macular edema.9 Recent research has highlighted the potential role of this new imaging modality in assessing the retinal microvascular abnormalities in various retinal diseases, including DR.7–10 The quantitative OCTA parameters, such as foveal avascular zone (FAZ) area, vessel density, and perfusion density in the superficial and deep capillary plexus, may have a useful role in the early detection of subclinical disease and may also provide valuable biomarkers in monitoring the progression of DR and preventing its severe complications.11–13
The aim of the current study was to assess the correlation between best corrected visual acuity (BCVA) and different OCTA parameters in patients with DR.
Patients and Methods
Patients
Sixty eyes of 60 participants were included in this prospective study, which was conducted between January 2019 and January 2020, with the participants recruited from the outpatient clinics of Benha University Hospital. All participants signed informed consent forms, which were in compliance with the requirements of the Declaration of Helsinki, and approval for the study was obtained from the local ethics committee (Benha Faculty of Medicine Research Ethics Committee). The participants were divided into three groups: 20 eyes of 20 diabetic patients with non-proliferative diabetic retinopathy (NPDR group), 20 eyes of 20 diabetic patients with proliferative diabetic retinopathy (PDR group) and 20 eyes of 20 normal healthy subjects (control group). The controls were matched for age and gender to both the NPDR group and PDR group.
The classification of DR was carried out in compliance with the International Clinical Disease Severity Scale for DR.14 Inclusion criteria were diabetic patients with type 2 diabetes mellitus (DM), spherical equivalent ranging between −1.5 and +1.5 diopter and intraocular pressure (IOP) <21 mmHg. Exclusion criteria were eyes with a history of laser photocoagulation or any other treatment for DR, the presence of macular edema, tractional retinal detachment, vitreomacular traction, media opacity (eg, cataract,) IOP ≥21 mmHg and a history of other retinal diseases (eg, retinal vein or artery occlusion and choroidal neovascular membrane). The healthy subjects had BCVA better than 6/9, with no evidence of any ocular or neurological diseases.
Ophthalmological Examination
All participants underwent a full ophthalmological examination including slit-lamp examination, refraction, BCVA using the Snellen chart (expressed as LogMAR), IOP measurement by applanation tonometry, dilated fundus examination and fundus fluorescein angiography.
OCTA was performed for all subjects using the RTVue XR OCT Avanti System with AngioVue version 2018.0.0.18 (Optovue, Fremont, CA, USA); AngioVue HD imaging retinal scan size 6×6 mm2, 400×400 pixels (two repeats/B-scan), scan time 3 s, axial resolution 5 µm and transversal resolution 15 µm. En face, A-scan and B-scan angiography images of both the superficial capillary plexus (SCP) and deep capillary plexus (DCP) were used for analysis. The automated measured OCTA parameters were the FAZ area (mm2), the superficial capillary plexus vessel density (SCP-VD) and the deep capillary plexus vessel density (DCP-VD), in whole and parafoveal areas. The vessel density was automatically calculated in two circular rings after excluding the FAZ area: the parafoveal area in a circular zone of 3 mm diameter and the whole area in a circular zone of 6 mm diameter. The automated vessel density measurements were applied using the new AngioVue software (Optovue, USA), which includes automated algorithms for mapping capillary density in the SCP and DCP, and the vessel density was demonstrated as a percentage by taking the ratio of the total vessel area to the total area of analyzed region. The central retinal thickness was recorded from a 6×6 mm2 area on the B-scan map. OCTA images with a signal strength index (SSI) <6 were excluded from the present study.
Statistical Analysis
The collected data were tabulated and analyzed using SPSS version 16 software (SPS, Chicago, IL, USA). Categorical data were presented as number and percentages, and analyzed using the chi-squared (χ2) test. Quantitative data were tested for normality using the Shapiro–Wilks test, assuming normality at P>0.05. Normally distributed variables were expressed as mean±standard deviation and analyzed by Student’s t-test for two independent groups or one-way analysis of variance (ANOVA, F-test) for three independent groups, while non-parametric data were presented as median and interquartile range (IQR), and analyzed by the Kruskal–Wallis (KW) test. Significant KW findings were followed by post-hoc multiple comparisons using Bonferroni adjusted tests to detect significant pairs. The Spearman correlation coefficient (rho) was used to assess non-parametric correlations. Stepwise multiple linear regression analysis [adjusted for glycated hemoglobin (HbA1c) and DM duration] was run to detect the significant predictors of BCVA. P≤0.05 was considered significant and P≤0.001 was considered highly significant.
Results
Twenty patients (10 males and 10 females) with a mean age of 50.0±3.4 years (NPDR group), 20 patients (12 males and 8 females) with a mean age of 50.6±2.4 years (PDR group) and a control group of 20 healthy normal subjects (8 females and 12 males) with a mean age of 49.2±2.5 years were included in this study. There were no significant differences in the age, gender, refraction, macular thickness or IOP between the studied groups (P=0.299, 0.76, 0.75, 0.20 and 0.79, respectively) (Table 1).
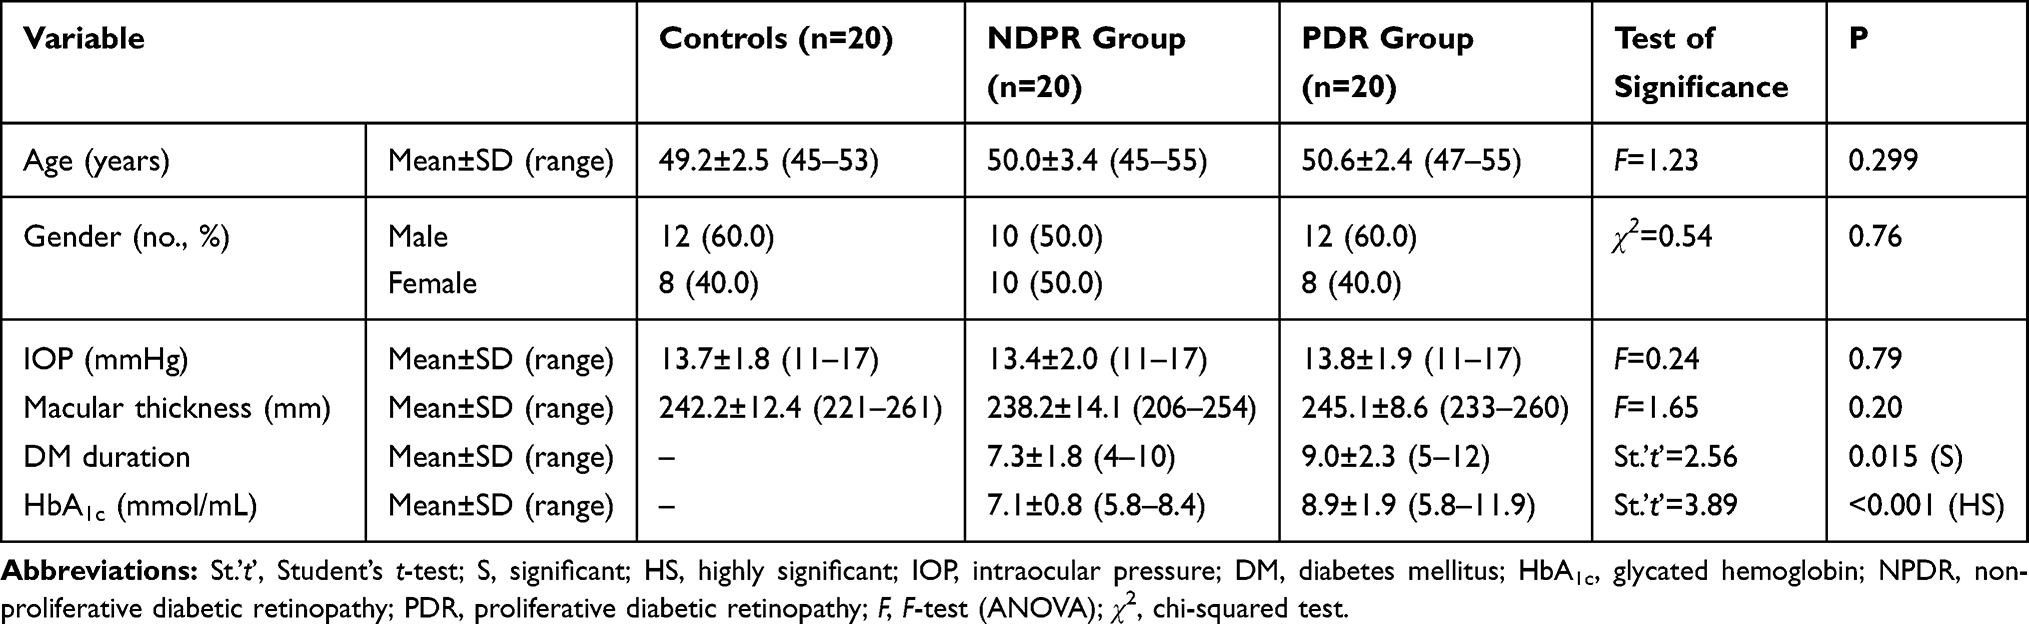 |
Table 1 Comparison Between the Studied Groups Regarding Basic Characteristics |
DM disease duration was 7.3±1.8 years in the NPDR group and 9.0±2.3 years in the PDR group. Mean BCVA was significantly higher in the control group in comparison to the other groups (P<0.001). The mean FAZ area showed significant differences between groups (P<0.001). The FAZ area was larger in patients with NPDR and PDR in comparison to the healthy control group (Figure 1), and the FAZ area increased with increasing severity of DR (Figure 2). SCP-VD and DCP-VD showed significant differences between groups (P<0.001) in whole and parafoveal areas (Figure 3). The mean vessel density was reduced in eyes with DR in comparison to the control group (Figure 4). The mean vessel density values were shown to decrease in both DCP and SCP as DR progressed (Table 2). There was a significant positive correlation between BCVA (LogMAR) and the FAZ area. Larger FAZ areas were correlated with poorer BCVA. There were significant negative correlations between BCVA (LogMAR) and vessel density in both SCP and DCP. The reduction in vessel density was correlated with poorer visual acuity (Table 3).
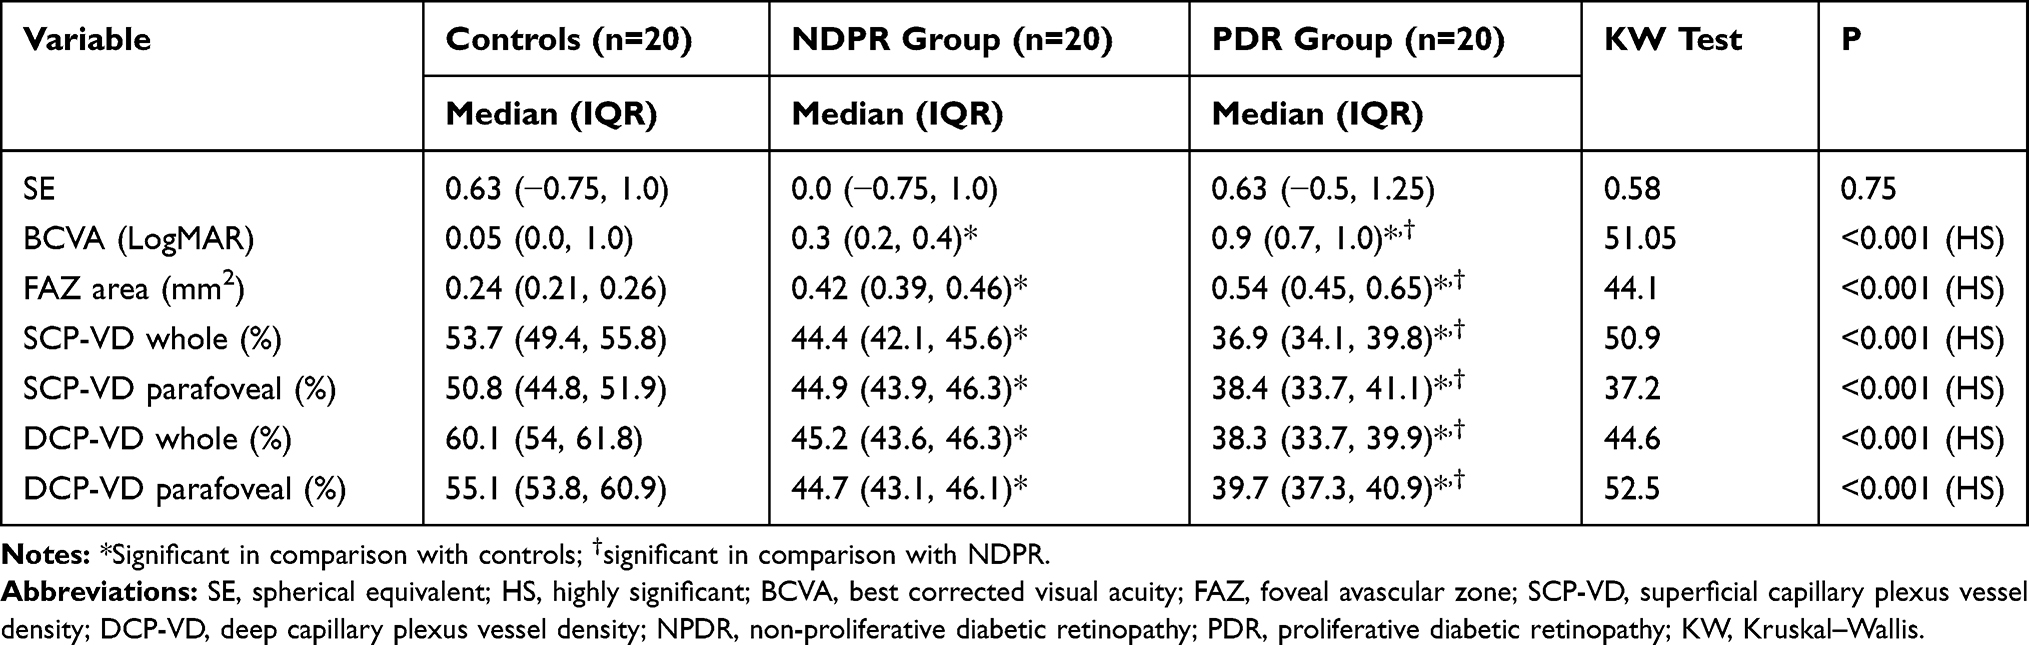 |
Table 2 Comparison Between the Studied Groups Regarding Visual Acuity and OCTA Parameters |
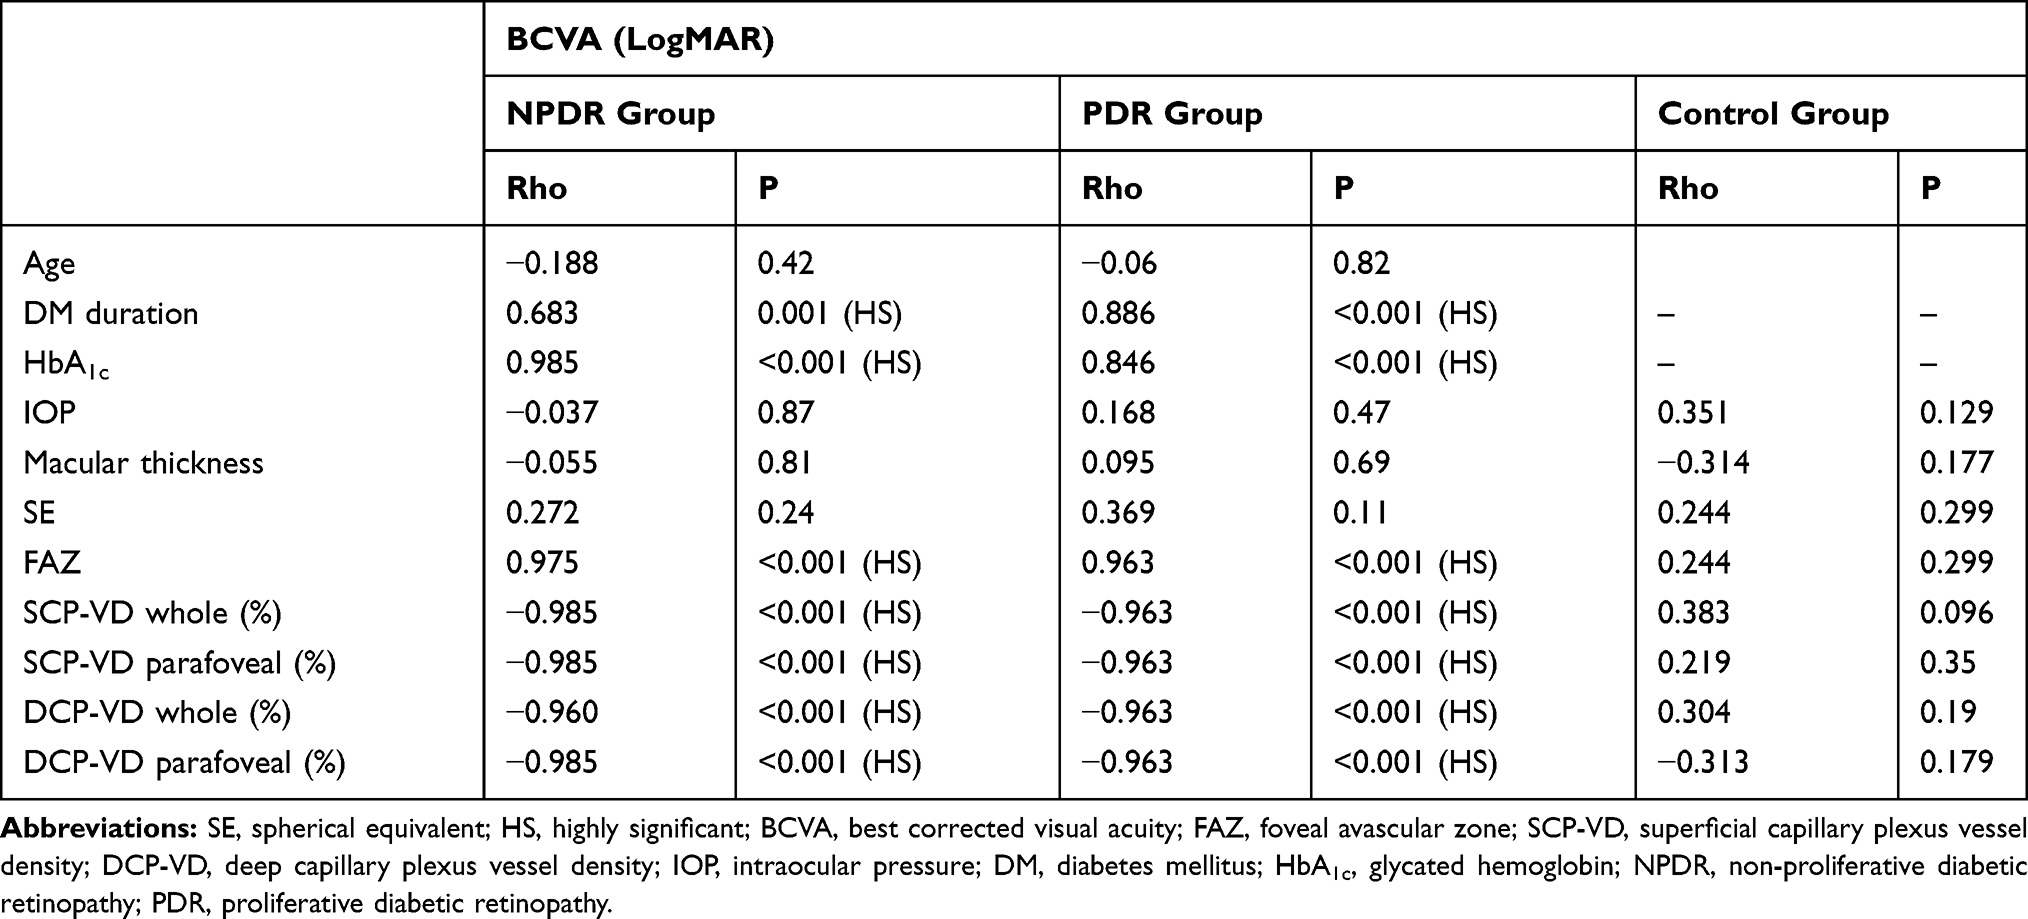 |
Table 3 Correlations Between BCVA and the Studied Variables Among the Studied Groups |
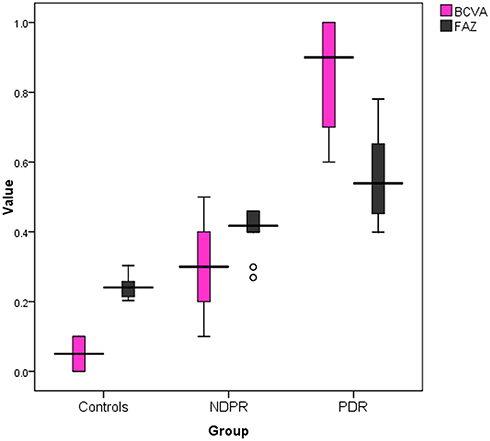 |
Figure 1 Box plot showing median and IQR of BCVA (LogMAR) and FAZ area among the studied groups. |
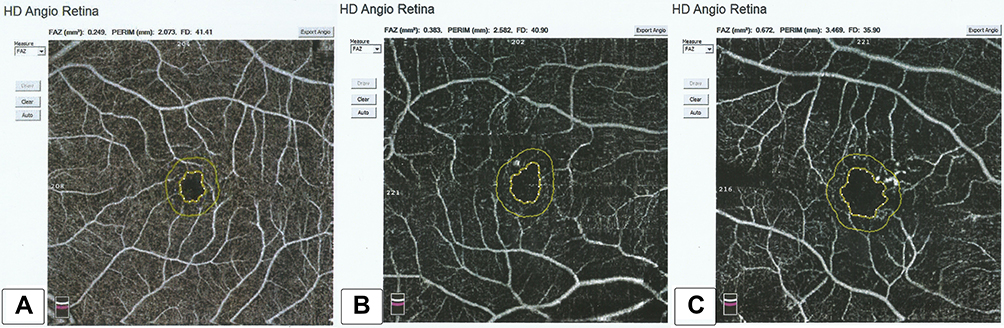 |
Figure 2 Foveal avascular zone (FAZ) area: (A) in a healthy subject (B) in a patient with NPDR, and (C) in a patient with PDR. There was widening of the FAZ area as DR progressed. |
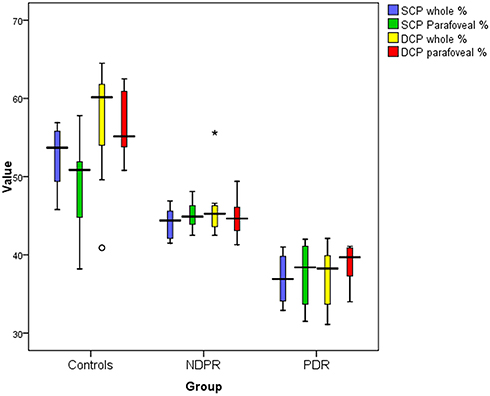 |
Figure 3 Box plot showing median and IQR of vessel density in superficial capillary plexus (SCP) and deep capillary plexus (DCP) among the studied groups. |
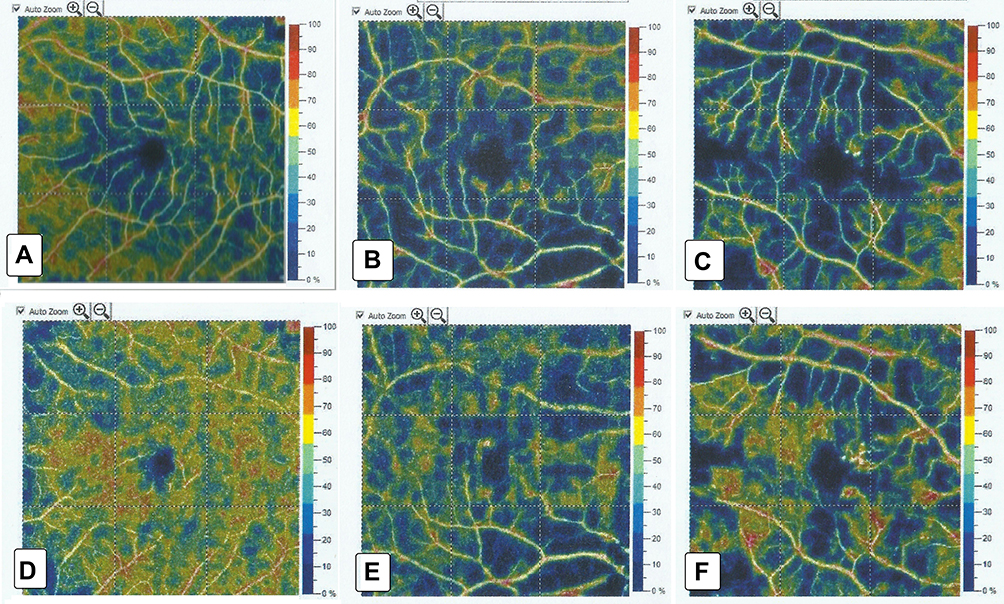 |
Figure 4 OCTA images (6×6 mm) from SCP and DCP: corresponding color-coded vessel density (VD) mapping with quantitative data. The VD is reduced in eyes with DR in comparison to controls with areas of capillary non-perfusion outside the FAZ. (A) SCP-VD in a healthy subject, (B) SCP-VD in a patient with NPDR, (C) SCP-VD in a patient with PDR, (D) DCP-VD in a healthy subject, (E) DCP-VD in a patient with NPDR, and (F) DCP-VD in a patient with PDR. |
The changes in FAZ area and vessel density were found to correlate with systemic indicators such as duration of DM and HbA1c (Tables 4 and 5).
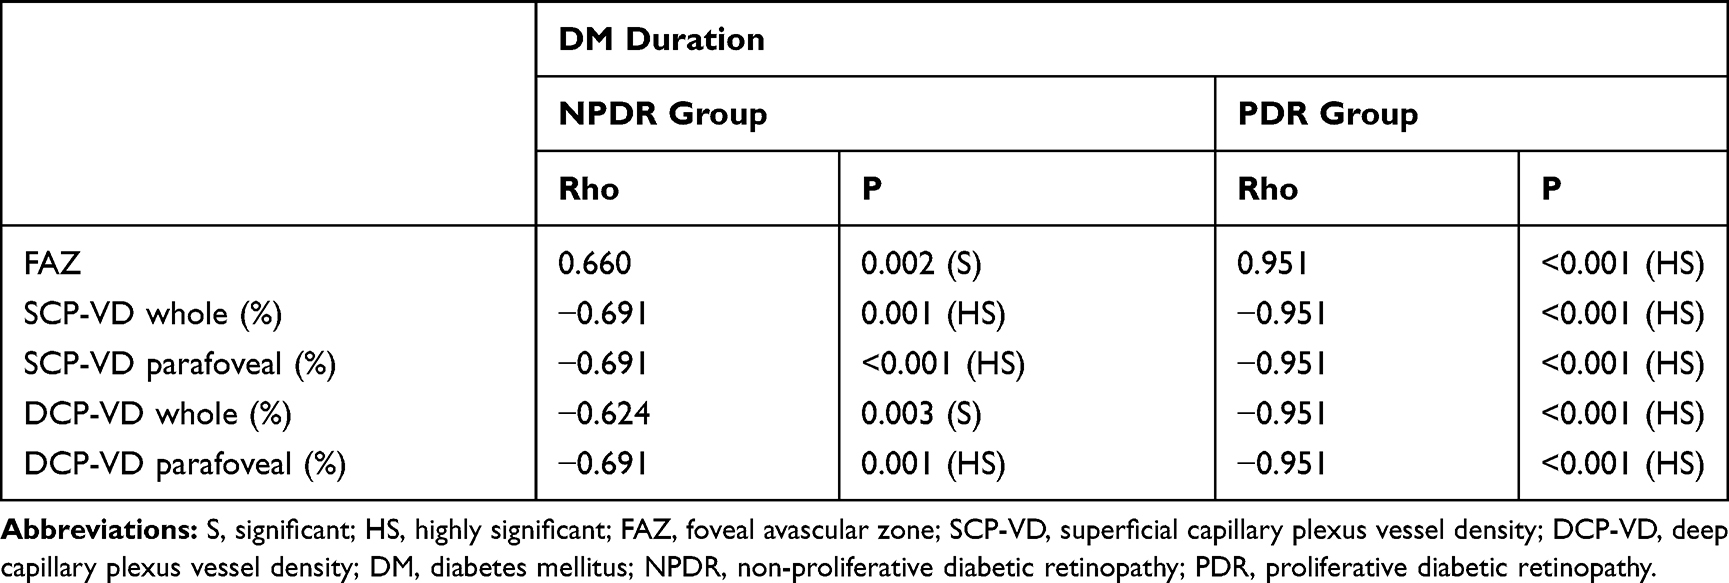 |
Table 4 Correlations Between DM Duration and OCTA Parameters |
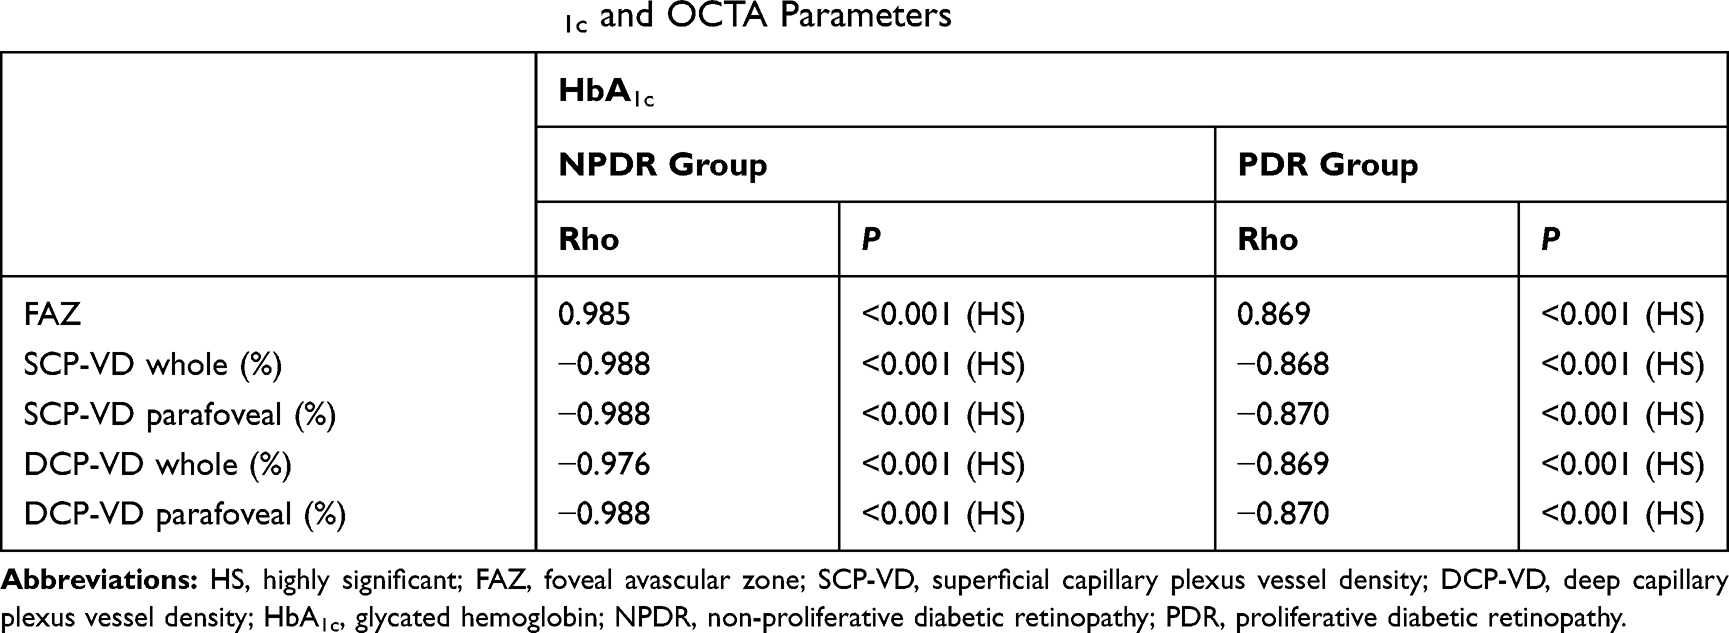 |
Table 5 Correlations Between HbA1c and OCTA Parameters |
HgA1c and DM duration were adjusted in the regression analysis to demonstrate the actual relationship between BCVA and OCTA parameters. Stepwise multiple linear regression analysis demonstrated that SCP-VD in the whole area and DCP-VD in the parafoveal area were the best predictive factors for BCVA in the NPDR and PDR groups (Table 6).
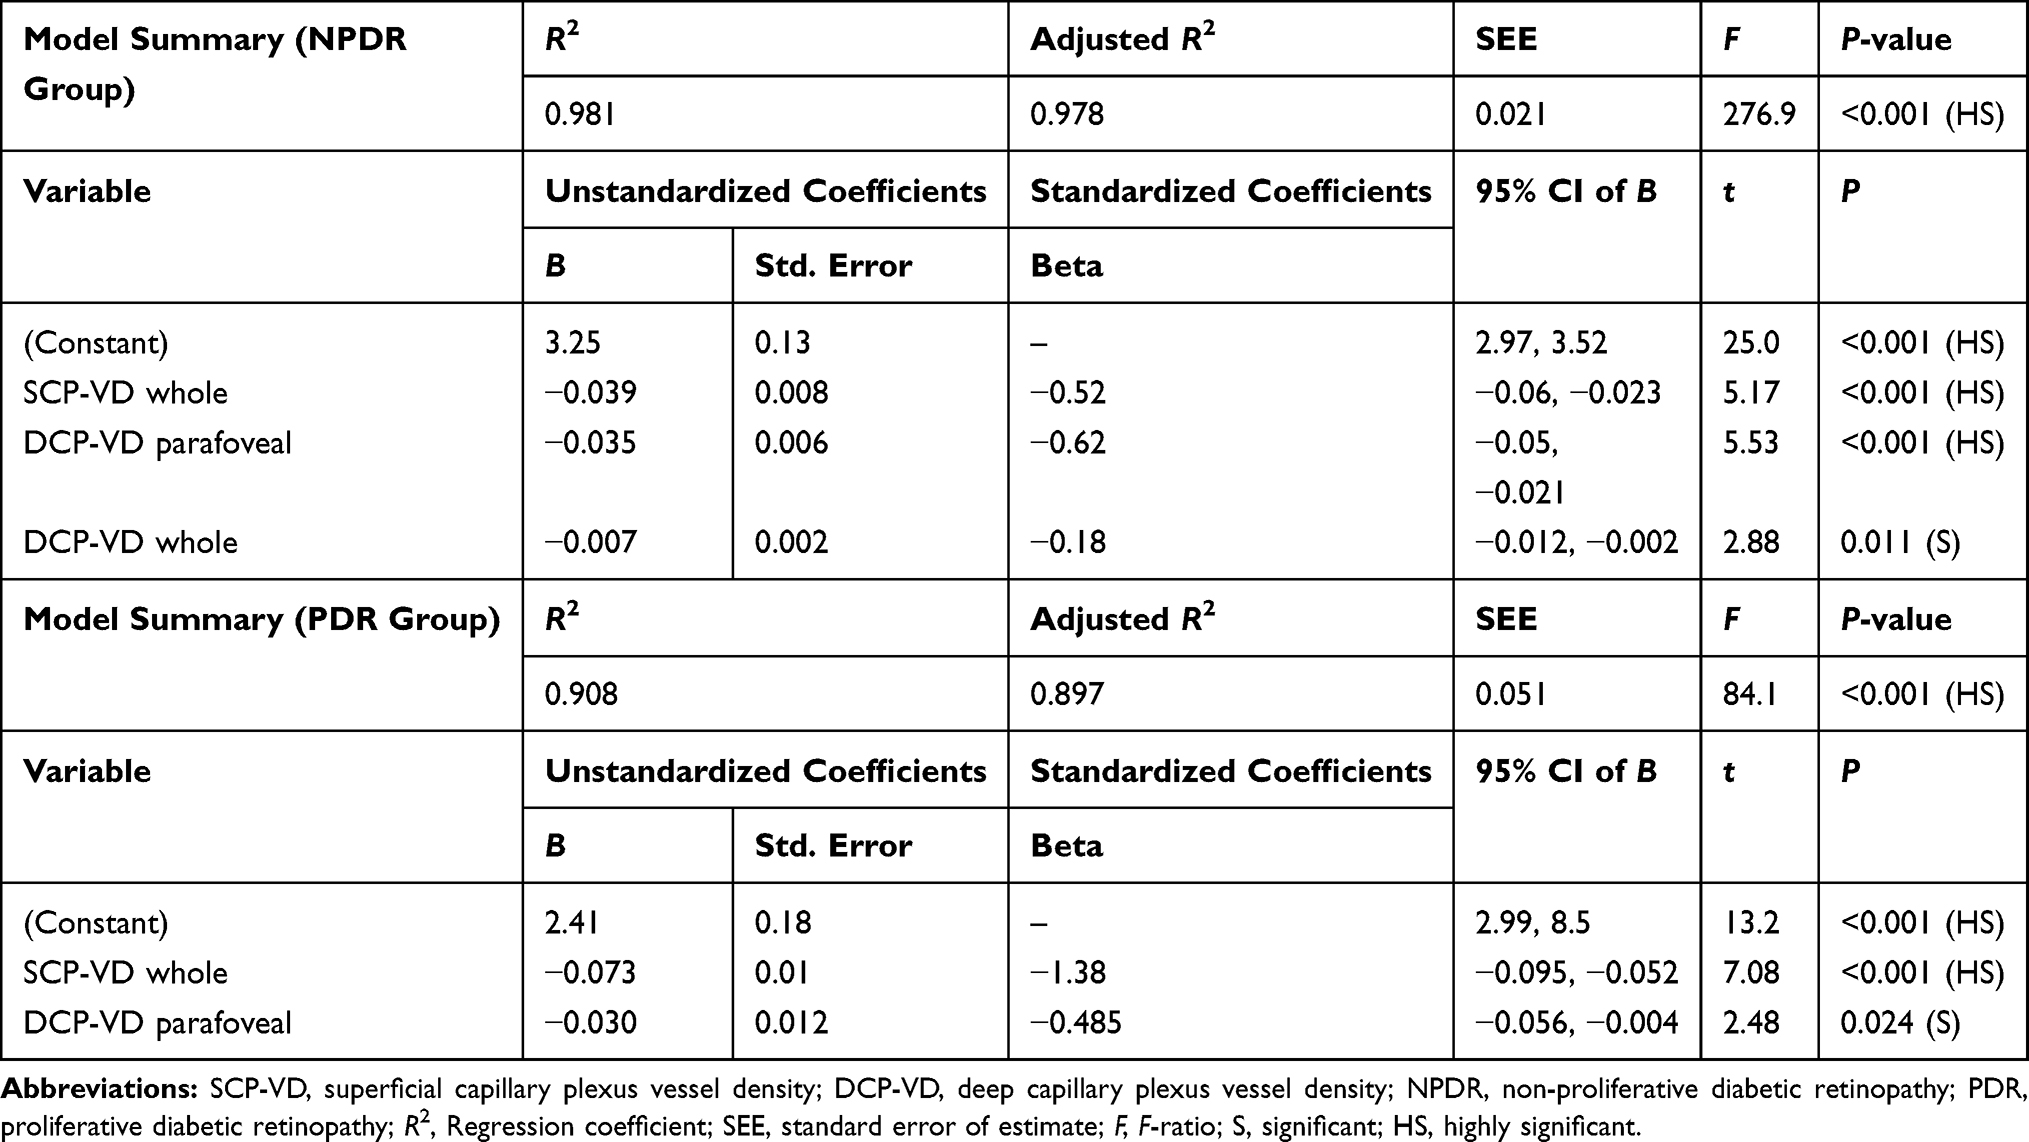 |
Table 6 Stepwise Multiple Linear Regression Analysis for the Predictors of BCVA |
Discussion
OCTA is a new imaging technique which can assess the retinal and choroidal microvasculature.2–12 It allows demonstration of the blood flow in both superficial and deep retinal capillary layers, so it can delineate the microvascular changes in DR, such as irregular FAZ, areas of capillary dropout and neovascularization, which have serious effects on visual acuity.15
The aim of the current study was to demonstrate the impact of these microvascular changes on the vision of patients with DR by analyzing the correlation between visual acuity and retinal vessel density, as well as the area of FAZ, using OCTA.
In our study, the FAZ area shows significant differences between the studied groups. It shows more widening with increasing severity of DM. We found a significant positive correlation between the FAZ area and BCVA (LogMAR) in DR patients; larger FAZ areas were correlated with poorer BCVA (P<0.001). These results concur with previous research by Balaratnasingam et al, who also demonstrated a significant correlation between the FAZ area and BCVA in patients with DR.16 Our results are also in agreement with a study by Johannesen et al,17 who stated that the FAZ area was larger in patients with NPDR and PDR in comparison to the healthy control group. The association between DR progression and increased FAZ area may reflect the increased amount of non-perfused areas.18
Many previous studies also reported an increase in FAZ area with advancing DR severity;19–22 however, one study, by Carnevali et al, stated that the FAZ area had not changed as DR progressed.23
Controversy regarding the correlation between FAZ size and BCVA in DR is still present; some studies reported a significant correlation between them16,24,25 while another did not find an association between them.26 Further research is needed to explicate this correlation.
We found a significant correlation between FAZ size, vessel density and systemic indicators such as duration of DM and HbA1c. Our results are in accordance with previous research;27–29 however, other studies reported no correlation between them.19,30
We also found that poor visual acuity in DR was associated with decreased vessel density in the SCP and DCP. Diminished vessel density reflects low perfusion and the presence of capillary dropout in parafoveal areas. Macular ischemia (inadequate blood supply) may contribute to both macular dysfunction and poor visual acuity.4
Past studies concluded that diminished vessel density, irregularity of the FAZ and increased FAZ area were associated with progression and worsening of DR.24,31,32 Other studies also reported that poorer visual acuity was correlated with diminished vessel density and widening of the FAZ area in DR patients without diabetic macular edema.25
In a 2019 study, Hsiao et al15 concluded that poor visual acuity in diabetic maculopathy was significantly correlated with decreased DCP-VD, and no correlation was found with SCP-VD.
Previous studies also reported significant effects on DCP-VD, more than on SCP-VD, in DR patients, and concluded that DCP-VD may be a useful tool for the prediction of DR severity and identifying subjects at high risk, even in the absence of any signs of DR.23,33–35 These results disagree with other studies, which stated that DR severity and BCVA were significantly correlated with SCP-VD rather than DCP-VD.27–36
We found a significant negative correlation between the BCVA (LogMAR) and vessel density in both DCP and SCP. Our results are comparable to a study by Samara et al;25 however, no correlation was found between them in another study.26 Further research is still needed to elucidate these controversial issues.
In the present study, the stepwise multiple linear regression analysis demonstrated that the SCP-VD in the whole area and the DCP-VD in the parafoveal area were the best predictive factors for BCVA in the NPDR and PDR groups. OCTA is an objective measure of the microvascular changes, while visual acuity (BCVA) is a subjective measure. Therefore, the changes in OCTA vascular parameters may be used as a surrogate for changes in visual acuity in patients with DR. These OCTA quantitative vascular measurements may be used as biomarkers to detect changes in visual acuity with progression of DR.
One limitation of this study is the relatively small sample size. Future research involving bigger numbers and studying the correlation between microvascular OCTA parameters and the functional changes in macular area using other technologies, such as multifocal electroretinography, are needed to assess the relative sensitivity between microvascular damage and macular dysfunction.
Conclusion
With progression of DR, the vessel density is decreased and the FAZ area is increased, and these parameters are correlated with poor visual acuity. OCTA may be a useful imaging tool not only for the diagnosis of DR but also in monitoring disease progression. OCTA is a non-invasive tool which can be used to detect diabetic macular ischemia and help in the prediction of visual prognosis.
Disclosure
The authors report no funding and no conflicts of interest in this work.
References
1. World Health Organisation. Global Report on Diabetes. Geneva: World Health Organisation; 2016.
2. Tey KY, Teo K, Tan ACS, et al. Optical coherence tomography angiography in diabetic retinopathy: a review of current applications. Eye Vis. 2019;6:37. doi:10.1186/s40662-019-0160-3
3. Roy MS, Klein R, O’Colmain BJ, Klein BE, Moss SE, Kempen JH. The prevalence of diabetic retinopathy among adults in the United States. Arch Ophthalmol. 2004;122(4):546–551. doi:10.1001/archopht.122.4.546
4. Sim DA, Keane P, Fung S, et al. Quantitative analysis of diabetic macular ischemia using optical coherence tomography. Invest Ophthalmol Vis Sci. 2014;55(1):417–423. doi:10.1167/iovs.13-12677
5. Virgili G, Menchini F, Casazza G, et al. Optical coherence tomography (OCT) for detection of macular oedema in patients with diabetic retinopathy. Cochrane Database Syst Rev. 2015;1:CD008081.
6. Ang M, Tan ACS, Cheung CMG, et al. Optical coherence tomography angiography: a review of current and future clinical applications. Graefes Arch Clin Exp Ophthalmol. 2018;256(2):237–245. doi:10.1007/s00417-017-3896-2
7. Gupta V, Agarwal A, Grewal DS, Jaffe GJ, Stewart MW, Srivastava S. Current role of optical coherence tomography angiography: expert panel discussion. Indian J Ophthalmol. 2018;66(12):1696. doi:10.4103/ijo.IJO_1048_18
8. Tan ACS, Tan GS, Denniston AK, et al. An overview of the clinical applications of optical coherence tomography angiography. Eye. 2018;32(2):262–286. doi:10.1038/eye.2017.181
9. Khadamy J, Aghdam KA, Falavarjani KG. An update on optical coherence tomography angiography in diabetic retinopathy. J Ophthalmic Vis Res. 2018;13(4):487–497. doi:10.4103/jovr.jovr_57_18
10. Koustenis A, Harris A, Gross J, Januleviciene I, Shah A, Siesky B. Optical coherence tomography angiography: an overview of the technology and an assessment of applications for clinical research. Br J Ophthalmol. 2017;101(1):16–20. doi:10.1136/bjophthalmol-2016-309389
11. de Barros Garcia JMB, Isaac DLC, Avila M. Diabetic retinopathy and OCT angiography: clinical findings and future perspectives. Int J Retin Vitr. 2017;3:14. doi:10.1186/s40942-017-0062-2
12. LIN JAMES, YANG JIN, HARRY W, JR. FLYNN. Evolving technology and new terminology in swept-source OCT angiography for diabetic retinopathy. Retin Physician. 2019;16:22–27.
13. Moein HR, Novais EA, Rebhun CB, et al. Optical coherence tomography angiography to detect macular capillary ischemia in patients with inner retinal changes after resolved diabetic macular edema. Retina. 2018;38(12):2277–2284. doi:10.1097/IAE.0000000000001902
14. Wilkinson CP, Ferris FL, Klein RE, et al. Proposed international clinical diabetic retinopathy and diabetic macular edema disease severity scales. Ophthalmology. 2003;110(9):1677–1682. doi:10.1016/S0161-6420(03)00475-5
15. Hsiao C, Yang C, Yang C, et al. Correlations between visual acuity and macular microvasculature quantified with optical coherence tomography angiography in diabetic macular oedema. Eye. 2019. doi:10.1038/s41433-019-0549-1
16. Balaratnasingam C, Inoue M, Ahn S, et al. Visual acuity is correlated with the area of the foveal avascular zone in diabetic retinopathy and retinal vein occlusion. Ophthalmology. 2016;123:2352–2367. doi:10.1016/j.ophtha.2016.07.008
17. Johannesen SK, Viken JN, Vergmann AS, Grauslund J. Optical coherence tomography angiography and microvascular changes in diabetic retinopathy: a systematic review. Acta Ophthalmol. 2019;97(1):7–14. doi:10.1111/aos.13859
18. Salz DA, de Carlo TE, Adhi M, et al. Select features of diabetic retinopathy on swept-source optical coherence tomographic angiography compared with fluorescein angiography and normal eyes. JAMA Ophthalmol. 2016;134(6):644–650. doi:10.1001/jamaophthalmol.2016.0600
19. Gozlan J, Ingrand P, Lichtwitz O, et al. Retinal microvascular alterations related to diabetes assessed by optical coherence tomography angiography: a cross-sectional analysis. Medicine. 2017;96:e6427. doi:10.1097/MD.0000000000006427
20. Miwa Y, Murakami T, Suzuma K, et al. Relationship between functional and structural changes in diabetic vessels in optical coherence tomography angiography. Sci Rep. 2016;6:29064. doi:10.1038/srep29064
21. Di G, Weihong Y, Xiao Z, et al. A morphological study of the foveal avascular zone in patients with diabetes mellitus using optical coherence tomography angiography. Graefes Arch Clin Exp Ophthalmol. 2016;254:873–879. doi:10.1007/s00417-015-3143-7
22. de Carlo TE, Chin AT, Bonini Filho MA, et al. Detection of microvascular changes in eyes of patients with diabetes but not clinical diabetic retinopathy using optical coherence tomography angiography. Retina. 2015;35:2364–2370. doi:10.1097/IAE.0000000000000882
23. Carnevali A, Sacconi R, Corbelli E, et al. Optical coherence tomography angiography analysis of retinal vascular plexuses and choriocapillaris in patients with type 1 diabetes without diabetic retinopathy. Acta Diabetol. 2017;54:695–702. doi:10.1007/s00592-017-0996-8
24. Freiberg FJ, Pfau M, Wons J, Wirth MA, Becker MD, Michels S. Optical coherence tomography angiography of the foveal avascular zone in diabetic retinopathy. Graefes Arch Clin Exp Ophthalmol. 2016;254:1051–1058. doi:10.1007/s00417-015-3148-2
25. Samara WA, Shahlaee A, Adam MK, et al. Quantification of diabetic macular ischemia using optical coherence tomography angiography and its relationship with visual acuity. Ophthalmology. 2017;124:235–244. doi:10.1016/j.ophtha.2016.10.008
26. Hwang TS, Gao SS, Liu L, et al. Automated quantification of capillary non perfusion using optical coherence tomography angiography in diabetic retinopathy. JAMA Ophthalmol. 2016;134:367–373. doi:10.1001/jamaophthalmol.2015.5658
27. Durbin MK, An L, Shemonski ND, et al. Quantification of retinal microvascular density in optical coherence tomographic angiography images in diabetic retinopathy. JAMA Ophthalmol. 2017;135:370–376. doi:10.1001/jamaophthalmol.2017.0080
28. Bhanushali D, Anegondi N, Gadde SGK, et al. Linking retinal microvasculature features with severity of diabetic retinopathy using optical coherence tomography angiography retinal vasculature changes in diabetic retinopathy. Invest Ophthalmol Vis Sci. 2016;57(9):OCT519–OCT525. doi:10.1167/iovs.15-18901
29. Kim AY, Chu Z, Shahidzadeh A, et al. Quantifying microvascular density and morphology in diabetic retinopathy using spectral-domain optical coherence tomography angiography. Invest Ophthalmol Vis Sci. 2016;57:OCT362–OCT370. doi:10.1167/iovs.15-18904
30. Dimitrova G, Chihara E, Takahashi H, Amano H, Okazaki K. Quantitative retinal optical coherence tomography angiography in patients with diabetes without diabetic retinopathy. Invest Ophthalmol Vis Sci. 2017;58:190–196. doi:10.1167/iovs.16-20531
31. Coscas G, Lupidi M, Coscas F. Optical coherence tomography angiography in diabetic maculopathy. Dev Ophthalmol. 2017;60:38–49.
32. Krawitz BD, Mo S, Geyman LS, et al. A circularity index and axis ratio of the foveal avascular zone in diabetic eyes and healthy controls measured by optical coherence tomography angiography. Vis Res. 2017;139:177–186. doi:10.1016/j.visres.2016.09.019
33. Bhardwaj S, Tsui E, Zahid S, et al. Value of fractal analysis of optical coherence tomography angiography in various stages of diabetic retinopathy. Retina. 2018;38:1816–1823. doi:10.1097/IAE.0000000000001774
34. Ting DSW, Tan GSW, Agrawal R, et al. Optical coherence tomographic angiography in type 2 diabetes and diabetic retinopathy. JAMA Ophthalmol. 2017;135:306–312. doi:10.1001/jamaophthalmol.2016.5877
35. Chen Q, Ma Q, Wu C, et al. Macular vascular fractal dimension in the deep capillary layer as an early indicator of microvascular loss for retinopathy in type 2 diabetic patients. Invest Ophthalmol Vis Sci. 2017;58:3785–3794. doi:10.1167/iovs.17-21461
36. Al-Sheikh M, Akil H, Pfau M, Sadda SR. Swept-source oct angiography imaging of the foveal avascular zone and macular capillary network density in diabetic retinopathyoct-angiography in diabetic retinopathy. Invest Ophthalmol Vis Sci. 2016;57(8):3907–3913.
 © 2020 The Author(s). This work is published and licensed by Dove Medical Press Limited. The
full terms of this license are available at https://www.dovepress.com/terms
and incorporate the Creative Commons Attribution
- Non Commercial (unported, 3.0) License.
By accessing the work you hereby accept the Terms. Non-commercial uses of the work are permitted
without any further permission from Dove Medical Press Limited, provided the work is properly
attributed. For permission for commercial use of this work, please see paragraphs 4.2 and 5 of our Terms.
© 2020 The Author(s). This work is published and licensed by Dove Medical Press Limited. The
full terms of this license are available at https://www.dovepress.com/terms
and incorporate the Creative Commons Attribution
- Non Commercial (unported, 3.0) License.
By accessing the work you hereby accept the Terms. Non-commercial uses of the work are permitted
without any further permission from Dove Medical Press Limited, provided the work is properly
attributed. For permission for commercial use of this work, please see paragraphs 4.2 and 5 of our Terms.