Back to Journals » International Journal of Chronic Obstructive Pulmonary Disease » Volume 15
Correlation of Clinical Symptoms and Sputum Inflammatory Markers with Air Pollutants in Stable COPD Patients in Beijing Area
Authors Guo C, Sun X, Diao W, Shen N, He B
Received 16 March 2020
Accepted for publication 8 May 2020
Published 26 June 2020 Volume 2020:15 Pages 1507—1517
DOI https://doi.org/10.2147/COPD.S254129
Checked for plagiarism Yes
Review by Single anonymous peer review
Peer reviewer comments 2
Editor who approved publication: Dr Chunxue Bai
Chenxia Guo, Xiaoyan Sun, Wenqi Diao, Ning Shen,* Bei He*
Department of Respiratory Medicine, Peking University Third Hospital, Beijing, People’s Republic of China
*These authors contributed equally to this work
Correspondence: Bei He
Peking University Third Hospital, Beijing, People’s Republic of China
Tel +86 13910125933
Email [email protected]
Ning Shen
Peking University Third Hospital, People’s Republic of China
Tel +86 13693638871
Email [email protected]
Abstract: Short-term exposure to major air pollutants can increase the risk of acute exacerbation in chronic obstructive pulmonary disease (COPD) patients. However, evidence on the mechanism of acute exacerbation of COPD (AECOPD) caused by air pollutants is still limited. A total of 78 patients with stable COPD and 58 healthy controls were recruited in Peking University Third Hospital in China from December 2014 to January 2015. The correlation and lag effect over 7 days (lag1– 7) of 6 air pollutants with clinical symptoms and inflammatory markers in induced sputum were analyzed. PM2.5, NO2 and CO were positively correlated with the COPD assessment test (CAT) score at lag 5, PM10 was positively correlated with the CAT score at lag 3, MMP-9 and IL-8 were positively correlated with PM2.5, PM10 and NO2 at lag 2, and CO was positively correlated with each other marker at lag 4. Short-term exposure to PM2.5, PM10, NO2, and CO can cause a neutrophil-mediated airway inflammatory response, followed by increased clinical symptoms. If the PM2.5, PM10, NO2 and CO exposure levels increase during air pollution monitoring, the early usage of medication or reduction of exposure to pollutants can effectively reduce the clinical symptoms of patients.
Keywords: chronic obstructive pulmonary disease, air pollution, matrix metalloproteinase 9, interleukin 8, induced sputum
Introduction
Chronic obstructive pulmonary disease (COPD) is a common, preventable and treatable disease that is characterized by persistent respiratory symptoms and airflow limitation due to airway and/or alveolar abnormalities that are usually caused by significant exposure to noxious particles or gases. Severe respiratory symptoms and poor quality of life are risk factors affecting long-term survival in patients with acute exacerbation of COPD (AECOPD).1 Air pollution is a risk factor for COPD. PM2.5, PM10, SO2, NO2, CO and O3 are the main components of air pollutants. Previous studies have shown that short-term exposure to air pollution may lead to acute exacerbation, hospital admission, and even an increased risk of death in COPD patients.2–4 In recent decades, rapid industrialization and urbanization have not only brought economic development but also serious haze. The average annual PM2.5 level in 2013 was 89.5 µg/m,3 in Beijing more than 8 times the World Health Organization (WHO) standard value (10 µg/m3). Air pollution in Beijing remains serious.
Previous studies on air pollution and COPD mainly focus on epidemiological studies of the effects of short-term exposure on the hospitalization and mortality rates and those of long-term exposure on the COPD prevalence rate, as well as effects on symptoms and acute exacerbation. Only a few studies have examined the effects of air pollution on COPD-related inflammation. A prospective study in Germany showed increased fibrinogen (Fib) levels after exposure to PM10, CO and NO.5 A study in Spain showed that increased NO2 exposure was associated with a 51% and 10% increase in the C-reactive protein (CRP) and Fib level, respectively, at lag 5. They also observed a 12% increase in the interleukin 8 (IL-8) level associated with an increase in NO2 exposure. The results for PM2.5 were not conclusive.6 Currently, studies on air pollution the context of COPD-related inflammation focus only on serum Fib, CRP, IL-8 and other systemic inflammatory markers, which have many influencing factors related to the systemic inflammatory response and cannot fully reflect the level of airway inflammation. This study aims to measure the levels of inflammatory markers in the induced sputum of stable COPD patients after air pollutant exposure and analyze not only the correlations between the levels and different particle sizes and components but also the change patterns following air pollution to explore appropriate clinical management strategies.
Methods
Subjects
Individuals with COPD were enrolled in the clinic of Peking University Third Hospital in China from December 2014 to January 2015. Patients with COPD were included based on the following criteria: 1) males 40–80 years of age; 2) diagnosed with a clinically stable stage of COPD according to the Global Initiative on Obstructive Lung Disease (GOLD);3) a post-bronchodilator ratio of the forced expiratory volume in one second to the forced vital capacity (FEV1/FVC)<0.70;no exacerbation within 8 weeks; residence in Beijing for more than 1 year; and residence and place of work within 5 km as the crow flies from the environmental atmospheric monitoring station of this study;4) no special occupational or dust exposure history. Selected patients were excluded based on the following criteria: 1) diagnosed with severe hepatic, cardiovascular, mental or renal dysfunction; 2) diagnosed with asthma, bronchiectasis, interstitial lung disease, or alpha-antitrypsin deficiency; and 3) history of occupational dust exposure, chest trauma or surgery. Information regarding long-term drug use, age, body mass index (BMI), smoking history and COPD assessment test (CAT) score were also acquired from the subjects by self-reporting. During the same period, 58 smokers without COPD were recruited as the control group. Baseline information was also collected from these subjects. The control subjects were also required to have lived in Beijing for more than 1 year and reside and work within 5km as the crow flies from the environmental and atmospheric monitoring station in this study. Control subjects with a history of pulmonary disease, a family history of COPD, or acute respiratory tract infection within the last 4 weeks were excluded.
Induced Sputum Sample Collection and Management
COPD patients according to their own long-term use of medication, do not interfere with the day of medication. Subjects were instructed to adequately rinse their mouth with water and inhale 3% hypertonic sodium chloride solution through ultrasonic atomization. After atomization, the patients were asked to remove nasal secretions, cough deeply and collect the sputum into a sterile sputum box. 78 patients in the COPD group and 58 patients in the smoking group completed induced sputum collection without adverse side effects.
Induced sputum was weighed and treated with 0.1% dithiothreitol (DTT) diluted equal to four times (in μL) the weight (in mg) of the sputum. The sputum samples were mixed for 5 min. In a constant-temperature water bath at 37°C, the samples were shaken at a constant speed for 15 min and then centrifuged at 3000 r/min for 10 min. The sputum supernatant was stored at −80°C.
Measurement of Inflammatory Markers
The levels of IL-8, CXC chemokine 10 (CXCL10), chemokine ligand 18 (CCL18), soluble advanced glycation end products (sRAGE), matrix metalloproteinase 3 (MMP-3), and MMP-9 were determined with the AimPlex® Human Custom 7-Plex kit (FACS Aria II). The levels of pulmonary surfactant protein D (SP-D) and Clara cell protein 16 (CC16) were detected using R&D Systems commercial ELISA kit. All assays were performed according to the manufacturers’ instructions.
Collection of Meteorological Data
Air component pollution data (PM2.5, PM10, SO2, NO2, CO, and O3) were obtained from the national control point of the Olympic sports center, and the hourly pollutant exposure data were sorted into average pollutant exposure concentrations on the follow-up days by the EXCEL table. The researchers arranged the follow-up days to spread the population as widely as possible to obtain different exposure levels of pollutants among individuals.
Lung Function and High-Resolution Computed Tomography
Lung function was measured by a Sensor Medics 6200 system in the two groups, and the lung function indexes included FEV1/FVC%, FEV1%, the ratio of residual volume to total lung capacity (RV/TLC), and the diffusing capacity of the lungs for carbon monoxide (DLCO%). Chest high-resolution computed tomography (HRCT) with continuous slices at 0.625 mm was performed at the time of induced sputum sample collection. The emphysema extent was assessed by calculating the percent of the lung volume with a low attenuation area (LAA%), defined as less than −950 Hounsfield Units (HU) (AW 4.5 software, GE healthcare, Fairfield, CT, USA).
Statistical Analysis
SPSS 23.0 software was used for data processing. Demographic and biomarker data are presented as the mean ± standard deviation or median (25–75% interquartile range) for continuous variables and as % positive for categorical variables. Measures not passing the Kolmogorov–Smirnov test for a normal distribution were transformed by log or square root values. Continuous variables were tested by t-test or nonparametric test. Categorical variables were analyzed using chi-squared or Fisher’s exact tests. Correlations were examined by Pearson’s correlation test. Logistic regression analysis was used to adjust for the influence of confounding factors and analyze the relationship between biomarkers and COPD. Partial correlation analysis was used to control for confounders and analyze the correlation between biomarkers and different air pollutants. Variables with P<0.05 were accepted as significant.
Results
Subject Demographics
A total of 78 patients with stable COPD and 58 healthy controls were recruited in Peking University Third Hospital in China from December 2014 to January 2015. All subjects completed induced sputum collection and pulmonary function tests. The demographic data of the final cohort are summarized in Table 1. The subjects with COPD and the smokers showed a significant difference in age, cigarette smoking pack-years and % current smoker. There was no difference in BMI or smoking history between smokers with and without COPD. The white blood cell (WBC) count, CRP and Fib levels and LAA% were all significantly higher in patients with COPD than in smokers (P<0.05).
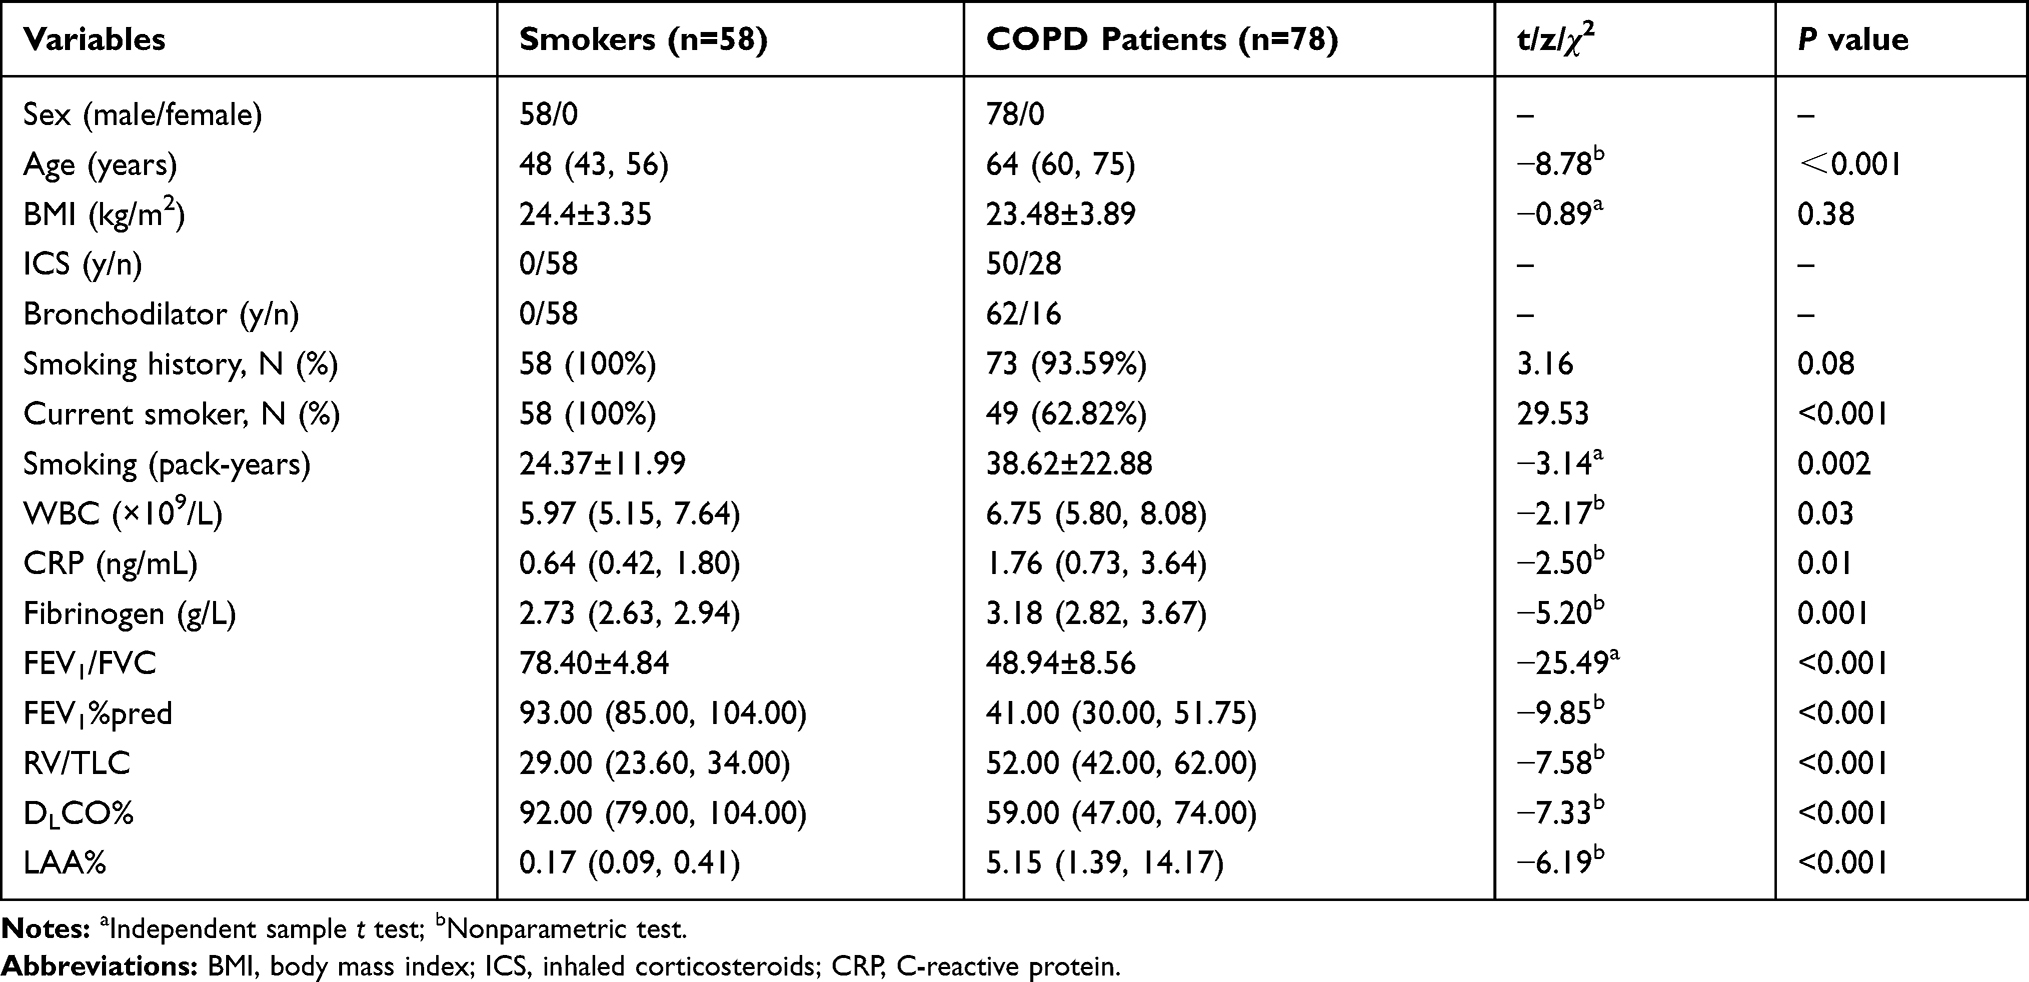 |
Table 1 Demographic and Clinical Data of COPD Patients and Smokers |
Sputum Inflammatory Markers
The MMP-9, MMP-3 and SP-D levels in the COPD group were all significantly higher than those in the control group (P<0.05).The sRAGE level was lower in the COPD group than in the control group (P < 0.001).CXCL10 (z=−0.78 P=0.43), CCL18 (z=−0.37P=0.71), IL-8 (z=−0.41 P=0.68), and CC16 (z=−1.39 P=0.16) showed no significant differences between the groups (Table 2). We divided the patients with COPD into two subgroups according to the FEV1%pred, as follows: group I, FEV1%pred ≥50%; group II, FEV1%pred<50%. The MMP-9 and IL-8 levels in group II were significantly higher than those in group I (P=0.02and 0.006, respectively) (Table 3).With the control group as the reference, the single-factor analysis of age, smoking amount, BMI and biomarker levels showed a significant difference in age, smoking amount and levels of MMP-9, SP-D, MMP-3 and sRAGE. These six variables were further included in the binary logistic regression analysis, and after excluding the influence of other factors, MMP-9 was correlated with COPD (OR=1.01, P=0.003, 95% CI:1.00–1.13).
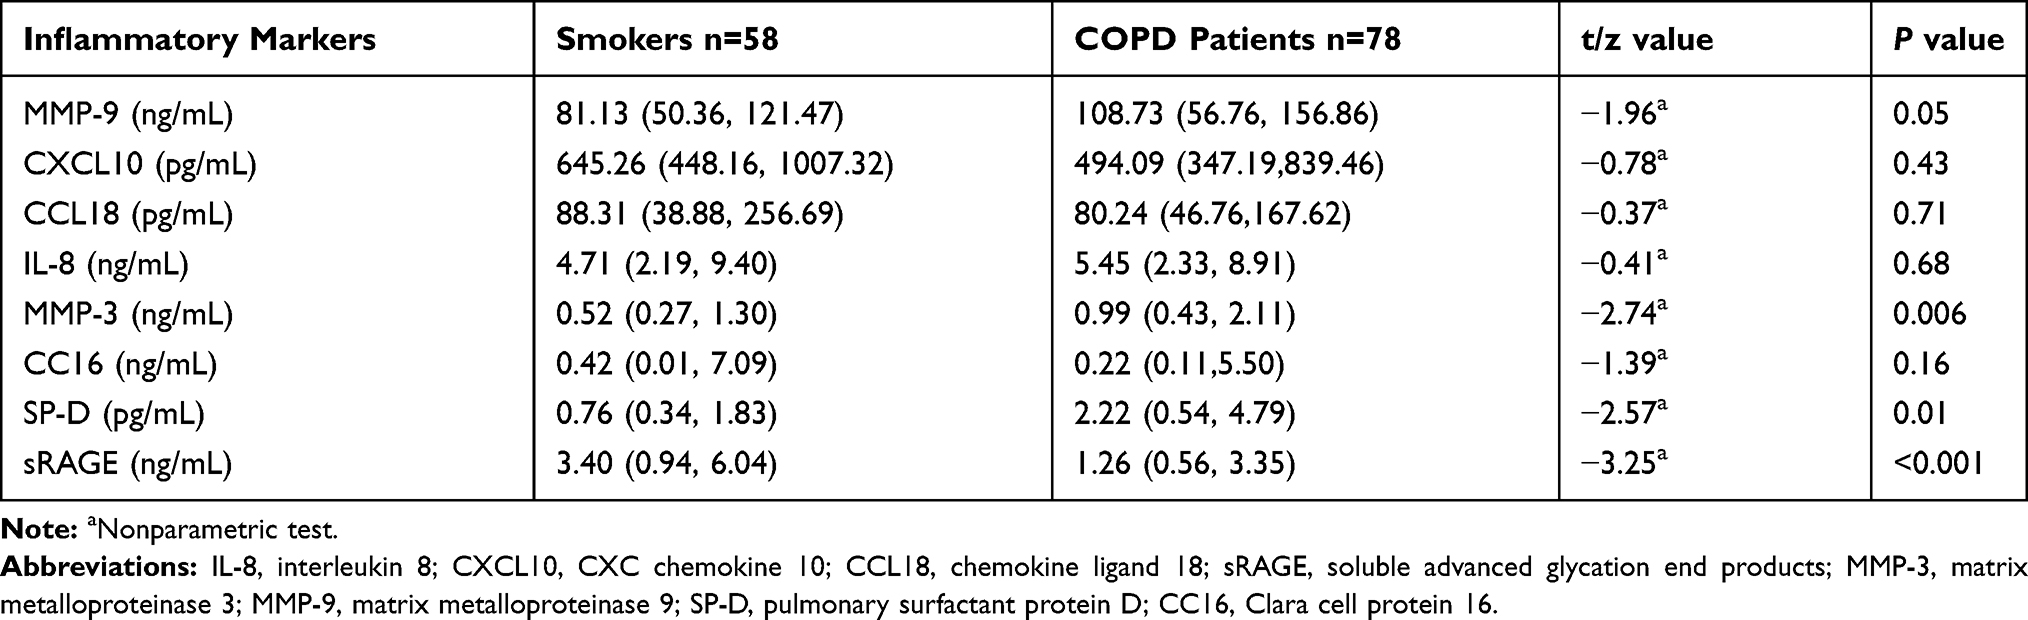 |
Table 2 Sputum Inflammatory Markers in COPD Patients and Smokers |
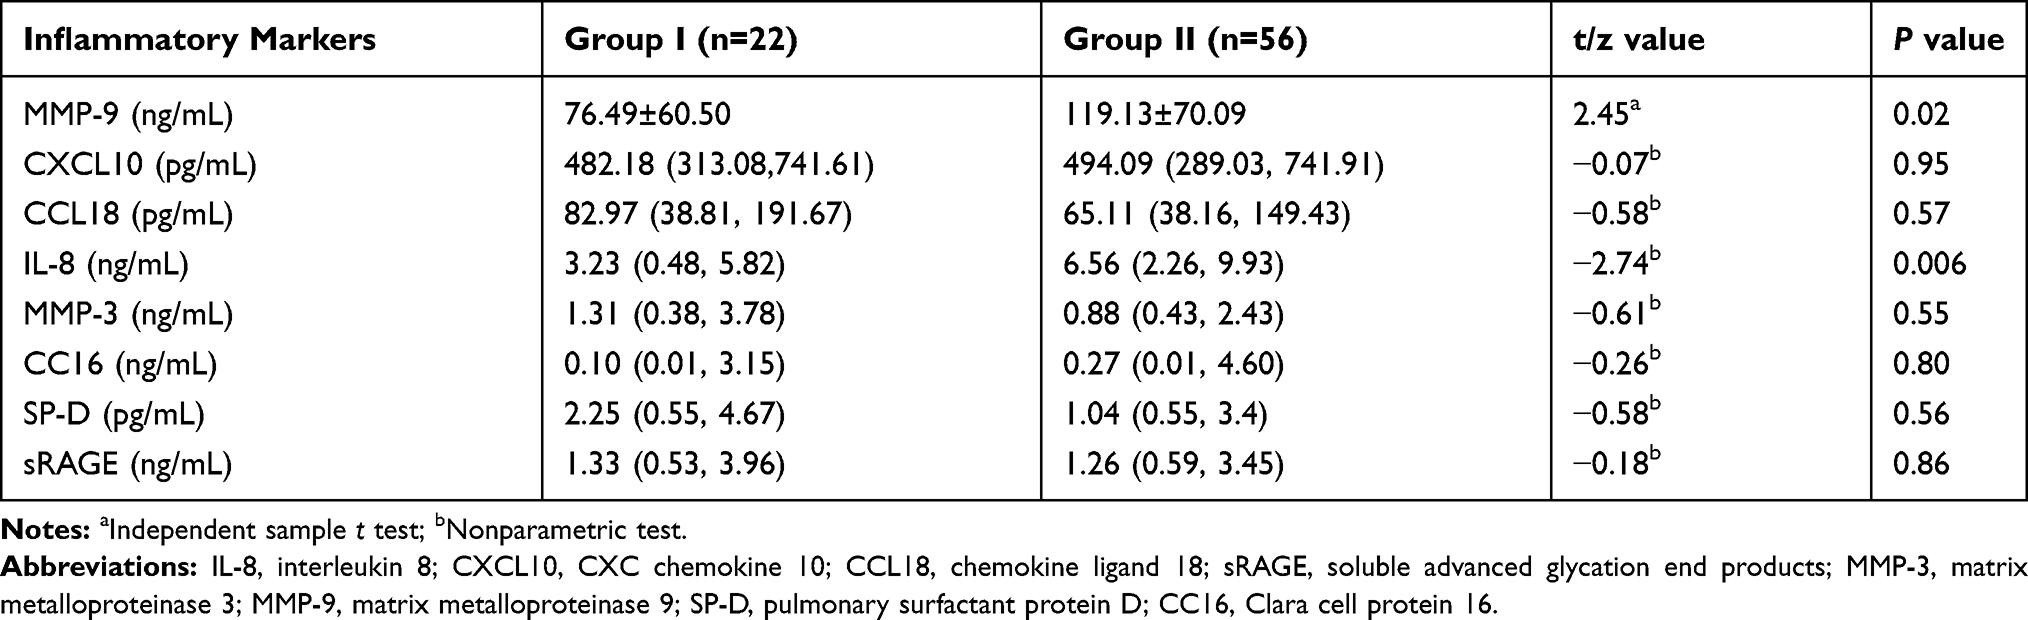 |
Table 3 Sputum Inflammatory Markers in Groups I And II |
Average Level of Exposure to Air Pollution Particles and Components
According to the national control data of the Beijing Olympic sports center, the atmospheric PM2.5, PM10, SO2, NO2 and CO levels were low in summer and autumn (May 2015 to October 2015) and high in winter and spring (November 2014 to April 2015 and November 2015 to December 2015).The O3 level was high in summer and autumn (May 2015 to September 2015) (Figure 1).
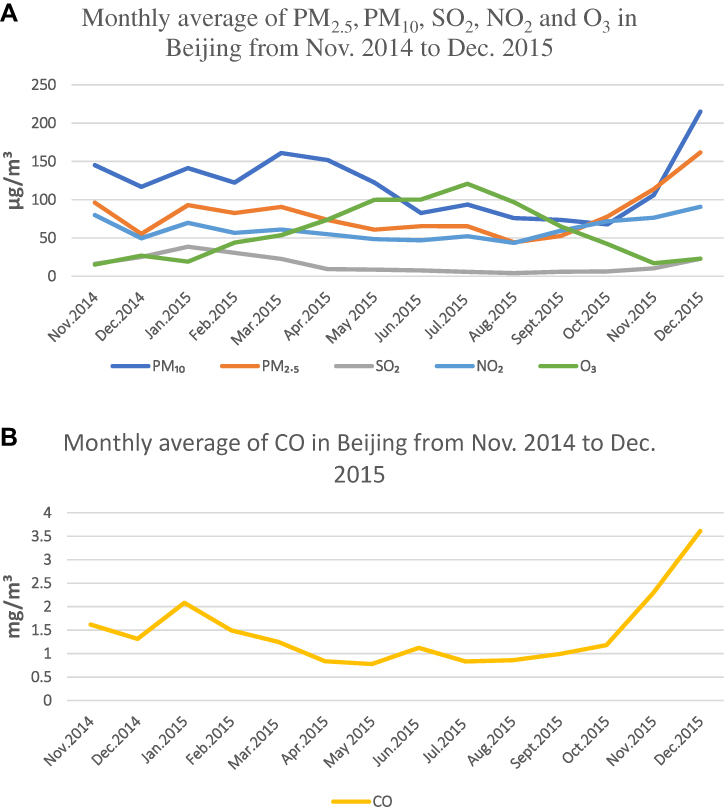 |
Figure 1 (A) The monthly average levels of PM2.5, PM10, SO2, NO2 and O3 in Beijing from Nov. 2014 to Dec. 2015. (B) The monthly average level of CO in Beijing from Nov. 2014 to Dec. 2015. The atmospheric PM2.5, PM10, SO2, NO2 and CO levels were low in summer and autumn (May 2015 to October 2015) and high in winter and spring (November 2014 to April 2015 and November 2015 to December 2015) The O3 level was high in summer and autumn (May 2015 to September 215). |
Correlation of Air Pollution Particle Size and Components with Inflammatory Markers in Induced Sputum
Age, BMI and smoking amount (pack-years) were used as control variables. IL-8, SP-D, CC16, sRAGE, MMP-9, MMP-3, CXCL10, and CCL18 were used as variables to analyze the correlation of different atmospheric pollutants on the day of exposure (lag0) and on days after exposure (lag effect, 1–7 d; lag1–7) with the variables. Among the hysteresis effects, PM2.5 at lag5 showed the strongest correlation with the clinical symptoms of COPD patients.PM2.5, NO2 and CO showed a hysteresis effect on the clinical symptoms of COPD patients; that is, when the hysteresis was 5d (lag5), the correlation coefficient was the largest and then showed a downward trend.PM10 also showed a lag effect on the clinical symptoms of COPD, and the correlation coefficient was the largest when the lag was 3d (lag3). There was no significant correlation between SO2 or O3 and the clinical symptoms of COPD patients.
Regarding the hysteresis effect, PM2.5 showed the strongest correlation with MMP-9 at lag 2 and then showed a decreasing trend;PM2.5 showed the strongest correlation with IL-8 at lag 2 and then showed a decreasing trend, but there was no significant correlation with CXCL10 or CCL18.PM10 and NO2 showed the strongest correlation with MMP-9 and IL-8 at lag 2 and then showed a decreasing trend, but there was no significant correlation with CXCL10 or CCL18.SO2 showed the strongest correlation with CXCL10 and CCL18 at lag 6 but no significant correlation with MMP-9 or IL-8.CO showed the strongest correlation with MMP-9 and IL-8 at lag 4 but showed no correlation with CXCL10 and CCL18 (Table 4 and Figure 2).
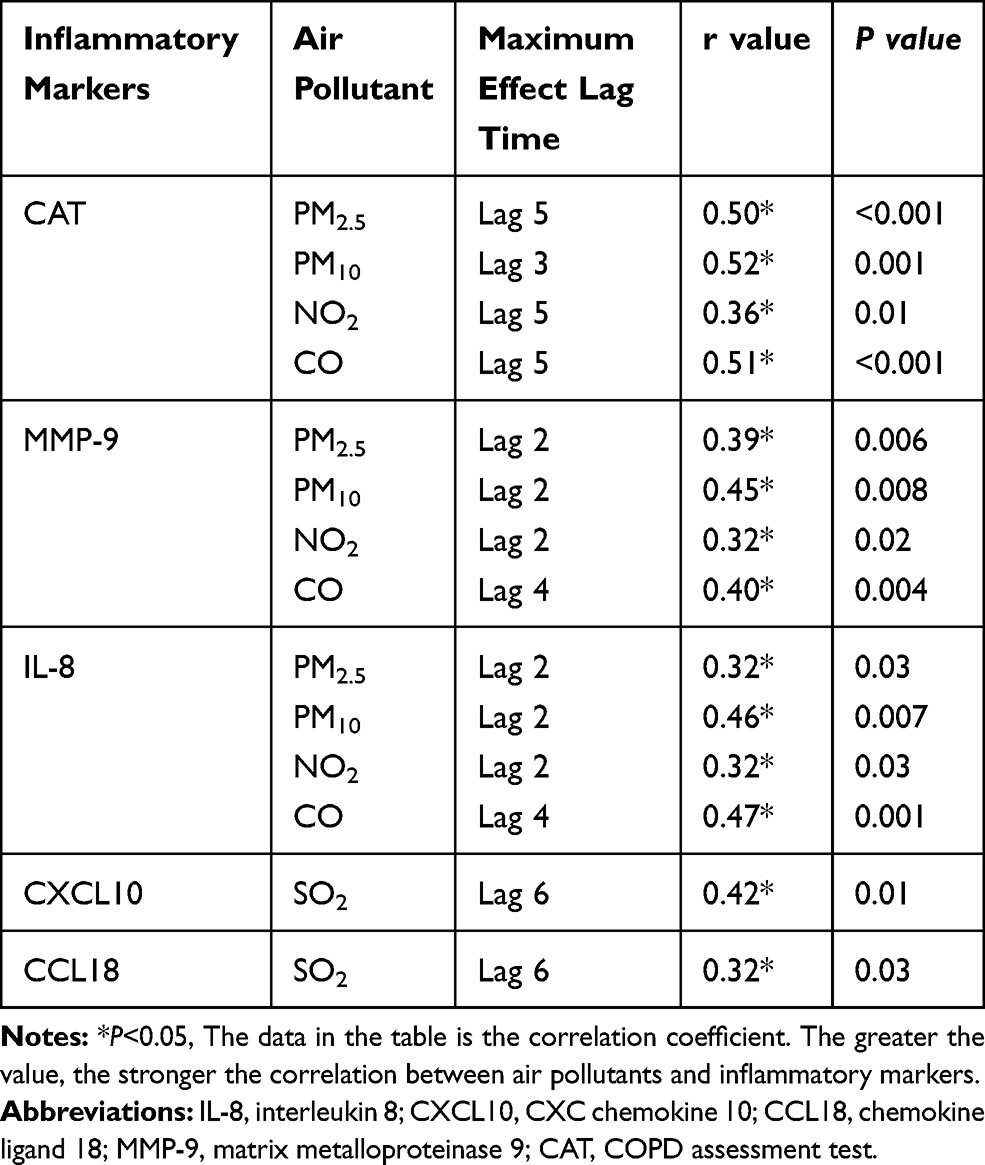 |
Table 4 Correlation of Air Pollutants with Clinical Symptoms and Inflammatory Markers |
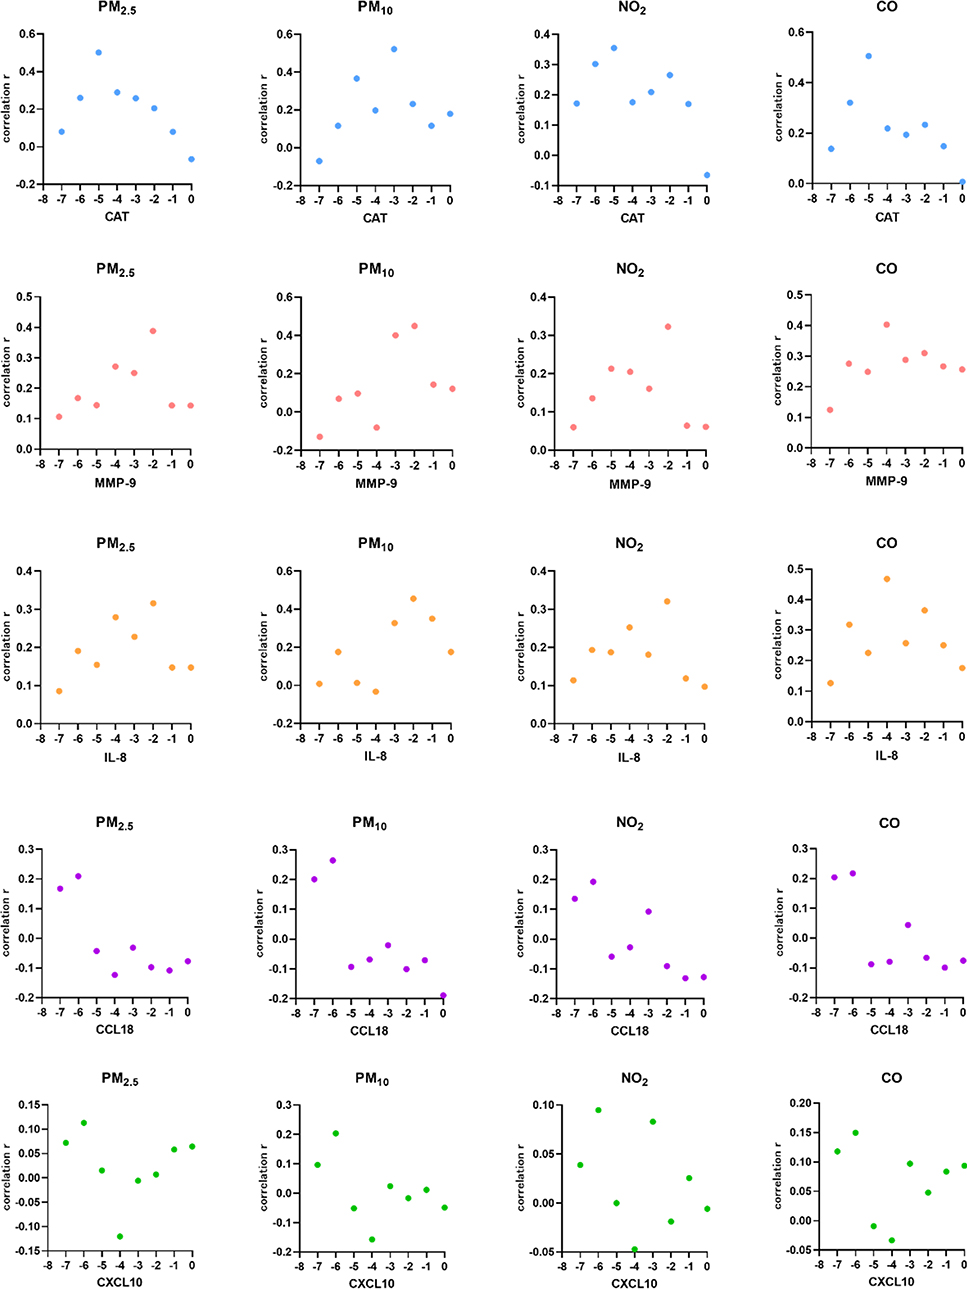 |
Figure 2 Trend graphs of the correlation of the CAT score, IL-8, MMP-9, CXCL10, and CCL18 levels with the PM2.5, PM10, NO2 and CO exposure levels on the day of exposure (lag 0) and 1week before exposure. The larger the correlation coefficient, the stronger the correlation. |
According to the FEV1%pred, the groups were divided into subgroups as follows: group I, FEV1%pred ≥50%; group II, FEV1%pred<50%. The correlations of clinical symptoms and inflammatory markers with air pollutants are shown in Table 5 for the different subgroups. The CAT score showed a stronger correlation with the PM2.5 exposure level in group II (r=0.39, P=0.023) than in group I (r=0.34, P=0.186). Compared with group I, in group II, the MMP-9 level showed a stronger correlation with the CO exposure level (r=0.46, P=0.009), and IL-8 showed a stronger correlation with PM10, NO2 and CO (r=0.42, P=0.046; r=0.35, P=0.047; r=0.45, P=0.010).
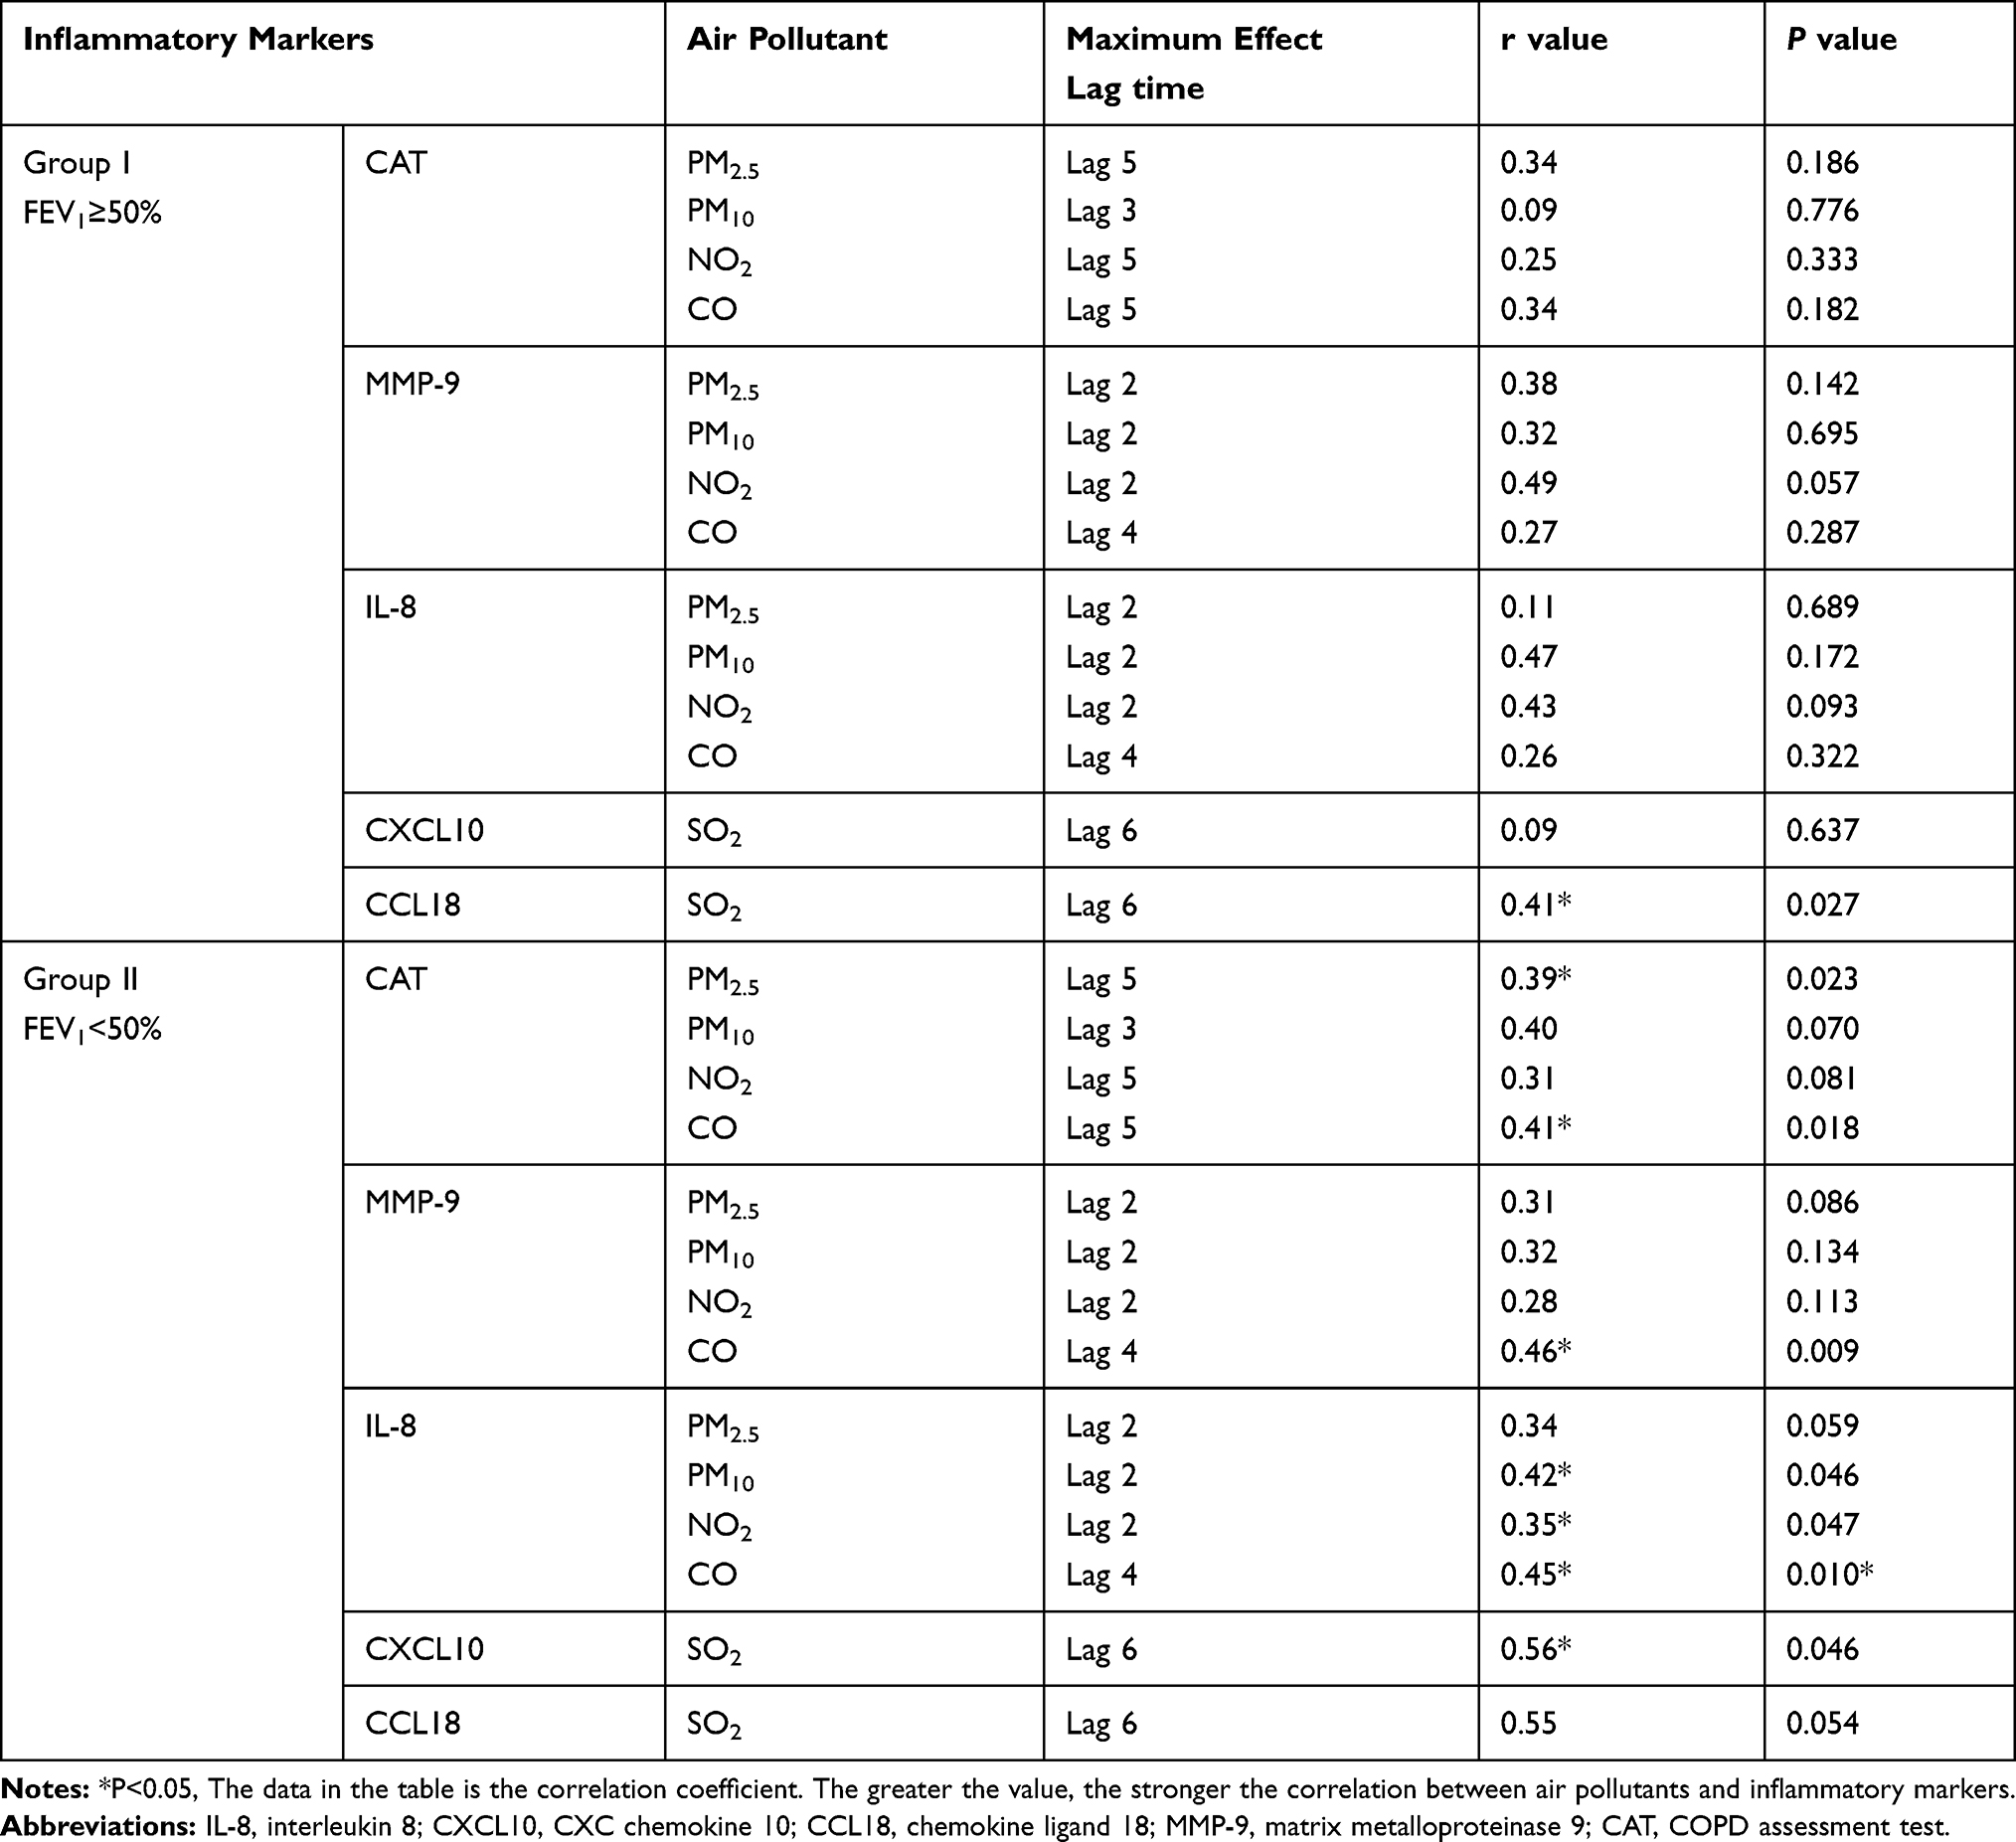 |
Table 5 Correlation of Clinical Symptoms and Inflammatory Markers with Air Pollutants in the Subgroups |
Discussion
This study evaluated the effects of air pollutants on clinical symptoms and airway inflammatory factors in stable COPD patients in Beijing. We found that exposure to PM2.5, PM10, NO2, and CO can cause a neutrophil-mediated airway inflammatory response, followed by increased clinical symptoms.
AECOPD is mainly triggered by viral and bacterial respiratory infections and environmental factors, such as pollution and ambient temperature.7 According to the air pollution data released by the Beijing environmental center in 2016, Lu Ling et al found that PM2.5, NO2 and CO pollution was higher in autumn and winter than in spring and summer, PM10 pollution was higher in spring and autumn than in winter and summer, SO2 pollution was higher in spring and winter than in summer and autumn.8 Short-term exposure to fine particulate matter (eg, PM2.5) is associated with increased rates of hospitalization for AECOPD and COPD-related mortality.9–11 Yinjuan Li found that the number of hospitalized AECOPD patients in Beijing showed obvious seasonality, with the peak in January, February, April and November and the trough in June and July.12 Previous studies have observed a difference in the CAT score of between 4 and 10 points for patients with COPD at different time points during exacerbation.13,14 AECOPD has many causes and is often not a single factor, such as pollution, cold, bacterial or viral infection can be combined together. It is also more complex when studying the inflammation factors in airway because different causes of AECOPD may happen together, which is also the reason of our study on stable period patients. Therefore, to reduce AECOPD, the seasonality of air pollutant exposure and the impact on clinical symptoms and airway inflammation in stable COPD patients were the focus of our study.
PM2.5, PM10, SO2, NO2, CO and O3 are the main components of air pollutants.PM2.5 refers to particulate matter with a diameter ≤2.5 µm, also known as fine particulate matter and particulate matter that can enter the lungs. Due to its small particle size, strong activity, ease of attachment to toxic and harmful substances (eg, heavy metals and microorganisms), long persistence in the atmosphere, and long transport distance, the impact of PM2.5 on human health and atmospheric environmental quality is relatively great. The mutual conversion between PM2.5 and gaseous pollutants is caused by chemical interactions. Precursors of organic gases, such as sulfates and nitrates, are transformed into secondary particles through evolution. Therefore, the PM2.5 level and the concentration of gaseous pollutants in the atmosphere will show interrelated change trends.15 PM10 is inhalable particulate matter with a diameter ≤10 µm that can enter the upper respiratory tract.PM2.5 is a kind of PM10, which generally accounts for approximately 70% of PM10.Although Beijing has adopted clean energy measures, households are still heated with coal. Therefore, SO2 in the atmosphere of Beijing is still mainly derived from emissions due to coal-based heating in winter.16 NO2 and CO mainly come from the incomplete combustion of fuel, automobile tail gas and industrial emissions. O3 is a representative pollutant of photochemical smog, and its precursors are mainly nitrogen oxide and volatile organic pollutants. This study found that the levels of air pollutants (PM2.5, PM10, SO2, NO2 and CO) in Beijing were high in winter and spring (November 2014 to April 2015 and November 2015 to December 2015).Affected by unfavorable atmospheric conditions, such as coal-based heating and continuous temperature inversion in winter, the PM2.5, PM10, SO2, NO2 and CO levels are all highest in winter.PM10 has a peak in spring, and the reason for this phenomenon may be that PM10originates directly from burning coal, motor vehicles and dust, etc. At the same time, it is windy and sandy in spring, and particles carried by the wind and dust on the ground promote the generation of PM10.17 According to the WHO, the PM2.5 standard is < 10 µg/m.3When the annual concentration reaches 35 µg/m,3 the risk of illness and death will be greatly increased. According to China’s standards for environmental and atmospheric quality in 2018, the average daily concentration of PM10 is 50 µg/m3 for the first level and 150 µg/m3 for the second level, and the average daily concentration of PM2.5 is <75 µg/m.3The daily average concentration of CO is 4mg/m3for both the first and second levels. In this study, the average exposure levels of PM2.5 and PM10were 120.00 µg/m3 and 196 µg/m,3 respectively, far higher than the national standard, and the average exposure level of CO was 1.45mg/m3, below the national standard. Air pollution is still a serious problem in our country.
Previous studies have found that air pollutants increase the mortality of COPD patients, especially PM10 and NO2.18 A meta-analysis including 59 studies showed that short-term exposure to all gases and particulate pollutants was significantly correlated with the risk of AECOPD; among them, O3 and NO2 showed the strongest correlations, SO2 and CO showed weak correlations, and PM10 showed a stronger correlation than PM2.5 among types of particulate matter, with the strongest effects on the day of exposure and on lag 3.4 One prospective study showed that PM10 and NO2were associated with the prevalence of chronic bronchitis and cough and sputum symptoms.19 A study in Taiwan showed that with increases in PM2.5, the modified Medical Research Council (mMRC) dyspnea score and the CAT score of COPD patients increased.20 In this study, it was found that among the six air pollutants, PM2.5 had the greatest effect on the clinical symptoms of COPD patients, and the correlation coefficient was the strongest when the lag time was 5 d. In the existing study, the effects air pollutants on COPD patients in terms of clinical symptoms, acute exacerbation and hysteresis effects were inconsistent. Since the changes of inflammatory cells in induced sputum were rough and it was difficult to see the changes in cell functions, we did not analyze the level of inflammatory cells in induced sputum, but selected some biomarkers that have been studied more recently. In this study, the strongest correlation of clinical symptoms in COPD patients with NO2, CO and PM2.5was at lag 5, and that with PM10was found at lag3.MMP-9 showed the strongest correlation with PM2.5, PM10, and NO2 at lag 2 and CO at lag 4.IL-8 showed the strongest correlation with PM2.5 and CO at lag 4 and PM10 and NO2at lag 2.CXCL10 and CCL18 showed the strongest correlation with SO2 at lag 6.Therefore, the effect of air pollutants on COPD patients’ clinical symptoms and airway inflammatory response has a lag time, with the effect on clinical symptoms showing a lag time of 3 d or 5 d and the effect on MMP-9 and IL-8 showing a lag time of 2d or 4d.The lag time of the effect on CXCL10 and CCL18 was 6d, indicating that the increase in CXCL10 and CCL18 in airway inflammation caused by air pollutants required a longer exposure time. When the levels of air pollutants increased, the COPD patients showed airway inflammation, indicated by early increases in the MMP-9 and IL-8 levels, followed by increased CXCL10 and CCL18 levels, and aggravation of the airway inflammation led to subsequent aggravation of the clinical symptoms.MMP-9, IL-8 and CCL18 are all neutrophil-associated inflammatory markers; thus, airway inflammation caused by air pollution is mainly mediated by neutrophils. Previous studies have also shown that patients with COPD residing in highly-polluted urban areas had greater airway inflammation in terms of sputum neutrophils compared to a population with very similar characteristics, living in rural areas with lower outdoor pollution.21 The subgroup analysis showed that with poorer lung function, COPD patients are more likely to have aggravated clinical symptoms and higher inflammatory marker levels when exposed to air pollutants.
As shown in Table 5, for patients with poorer lung function, the appearance of symptoms was related to particle size and component, especially PM2.5 and CO. Changes in levels of airway inflammatory factors were largely related to the components of pollutants, mainly CO and SO2.The above results suggest that COPD patients are more likely to experience AECOPD in winter or during the heating season in Beijing. Therefore, improving heating methods would be an important measure for reducing AECOPD. Increases in the MMP-9 and IL-8 levels in sputum may preempt symptom deterioration, thus making it possible to reduce symptoms or AECOPD.
At the same time, the results of this study suggest that air pollutant exposure has a delayed effect and is associated with neutrophil-mediated airway inflammation. It is suggested that increased exposure levels of PM2.5, PM10, NO2 and CO will cause increased airway inflammation in COPD patients, followed by aggravated respiratory symptoms. Changes in airway inflammatory cytokine levels can occur within 4 d, and symptoms are more pronounced within 5–6 d. Therefore, early anti-inflammatory treatment might be reasonable. Monitoring the level of air pollutants helps us to provide therapeutic drugs or reduce exposure to pollutants as early as possible, which can effectively reduce the clinical symptoms of patients, reduce the level of airway inflammation, and thus potentially reduce the occurrence of acute exacerbation, especially in patients with COPD and poor lung function.
This study is unique because it is the first study focused on the effects of air pollution on COPD-related airway inflammation and symptoms using induced sputum samples. However, there are limitations in this study. First, the age difference between the groups of smokers and COPD patients was relatively large, which may indicate selection bias. Age correction was performed for all correlation analyses in this study to minimize the impact of selection bias. Second, our personal exposure data came from the average level of the monitoring station of the Olympic sports center, rather than the actual exposure level of the individual air pollutants of the subjects, which may have introduced some error. It is best to be able to use a personal contaminant monitor, but a one-year follow-up is unrealistic and expensive. Third, this study is a cross-sectional study, probably the best design would have been a case-control study in which healthy and COPD smoking individuals were matched by age and proximity at the place of residence and period of year.
Conclusion
Our study confirmed that the sputum MMP-9, MMP-3 and SP-D levels were increased in patients with stable COPD compared with the controls and that the MMP-9 level was associated with the occurrence and development of COPD diseases. A variety of air pollutants were positively correlated with the clinical symptoms of COPD patients, reflecting increased airway and systemic inflammatory markers; thus, these findings further suggest that the exposure of patients with COPD to PM2.5, PM10, NO2 and CO can cause airway inflammation, namely, increased levels of MMP-9 and IL-8 as markers of airway inflammation markers, and worse clinical symptoms. Therefore, in the case of the daily monitoring of air pollutants, if the exposure level of air pollutants is increased, it is possible to reduce exposure to air pollutants or increase treatment with drugs in the early stage, which could ease the respiratory symptoms and airway inflammation of COPD patients. In addition, as both MMP-9 and IL-8 are inflammatory markers related to neutrophils, airway inflammation caused by air pollution is mainly mediated by neutrophils. Therefore, developing drugs targeting neutrophil-mediated inflammation would have significance for future treatments.
Abbreviations
COPD, chronic obstructive pulmonary disease; AECOPD, acute exacerbation of COPD; BMI, body mass index; HRCT, high resolution computed tomography; LAA, low attenuation area; GOLD, global Initiative for chronic obstructive lung disease; FEV1, forced expiratory volume in the first second; FEV1/FVC, the ratio of the forced expiratory volume in one second to the forced vital capacity; RV/TLC, the ratio of residual volume to total lung capacity; DLCO%, the diffusing capacity of the lungs for carbon monoxide; CAT, COPD assessment test; WBC, white blood cell; Fib, fibrinogen; CRP, C-reactive protein; IL-8, interleukin 8; CXCL10, CXC chemokine 10; CCL18, chemokine ligand 18; sRAGE, soluble advanced glycation end products; MMP-3, matrix metalloproteinase 3; MMP-9, matrix metalloproteinase 9; SP-D, pulmonary surfactant protein D; CC16, Clara cell protein 16.
Data Sharing Statement
The data used to support the findings of this study are included within the article. No additional data are available.
Ethics Approval and Informed Consent
This study (IRB #00001052-13083) was approved by the ethics committee of Peking University third hospital, andwritten informed consent was acquired from all subjects before enrollment into the study in accordance with the principles of the Declaration of Helsinki. This study was registered at http://www.clinicaltrials.gov(NCT02964117).
Acknowledgments
The present study was funded by the National Natural Science Foundation of China (Grant Nos: 81270097; 81470235; 81670034) and National Key R & D Program of China (2018YFC1311900).Thanks to Yi Zhang from the School Public Health at Peking University for providing the air pollution data.
Author Contributions
C Guo directed the execution of the study, participated in the assaying of the samples, conducted statistical analyses and interpretation and wrote the manuscript; X Sun and W Diao enrolled subjects; B He and N Shen were involved in study design and final approval of the version to be published. All authors made substantial contributions to conception and design, acquisition of data, or analysis and interpretation of data; took part in drafting the article or revising it critically for important intellectual content; gave final approval of the version to be published; and agree to be accountable for all aspects of the work.
Disclosure
The authors report no conflicts of interest in this work.
References
1. Singh D, Agusti A, Anzueto A, et al. Global strategy for the diagnosis, management, and prevention of chronic obstructive lung disease: the GOLD science committee report 2019. Eur Respir J. 2019,53(5):1900164. doi:10.1183/13993003.00164-2019.
2. Higgins BG, Francis HC, Yates CJ, et al. Effects of air pollution on symptoms and peak expiratory flow measurements in subjects with obstructive airways disease. Thorax. 1995;50(2):149–155. doi:10.1136/thx.50.2.149
3. Peacock JL, Anderson HR, Bremner SA, et al. Outdoor air pollution and respiratory health in patients with COPD. Thorax. 2011;66(7):591–596. doi:10.1136/thx.2010.155358
4. Li JH, Sun SZ, Tang R, et al. Major air pollutants and risk of COPD exacerbations: a systematic review and meta-analysis. Int J Chron Obstruct Pulmon Dis. 2016;113079–113091.
5. Hildebrandt K, Ruckerl R, Koenig W, et al. Short-term effects of air pollution: a panel study of blood markers in patients with chronic pulmonary disease. Part Fibre Toxicol. 2009;6:25. doi:25.doi:10.1186/1743-8977-6-25
6. Dadvand P, Nieuwenhuijsen MJ, Agusti A, et al. Air pollution and biomarkers of systemic inflammation and tissue repair in COPD patients. Eur Respir J. 2014;44:603–613. doi:10.1183/09031936.00168813
7. Woodhead M, Blasi F, Ewig S, et al. Guidelines for the management of adult lower respiratory tract infections. Eur Respir J. 2005;26(6):1138–1180. doi:10.1183/09031936.05.00055705
8. Lu L, Zhang AW, Kang XY. Temporal and spatial characteristics of air pollutants in Beijing. Adv Geosci. 2018;8(3):673–682. doi:10.12677/AG.2018.83071
9. Li MH, Fan LC, Mao B, et al. Short-term exposure to ambient fine particulate matter increases hospitalizations and mortality in COPD: a systematic review and meta-analysis. Chest. 2016;149(2):447–458. doi:10.1378/chest.15-0513
10. Liu S, Zhou YM, Liu SX, et al. Association between exposure to ambient particulate matter and chronic obstructive pulmonary disease: results from a cross-sectional study in China. Thorax. 2017;72(9):788–795. doi:10.1136/thoraxjnl-2016-208910
11. Liang L, Cai Y, Barratt B, et al. Associations between daily air quality and hospitalisations for acute exacerbation of chronic obstructive pulmonary disease in Beijing, 2013–17: an ecological analysis. Lancet Planet Health. 2019;3(6):
12. Li YJ, Fang QH. Season distribution and meteorological factors for hospitalized AECOPD patients. Chin Gen Pract. 2015;18(14):1695–1699.
13. Miravitlles M, García-Sidro P, Fernández-Nistal A, et al. Course of COPD assessment test (CAT) and clinical COPD questionnaire (CCQ) scores during recovery from exacerbations of chronic obstructive pulmonary disease. Health Qual Life Outcomes. 2013;11:147. doi:10.1186/1477-7525-11-147
14. Agustí A, Soler JJ, Molina J, et al. Is the CAT questionnaire sensitive to changes in health status in patients with severe COPD exacerbations? COPD. 2012;9(5):492–498. doi:10.3109/15412555.2012.692409
15. Cui SH, Ni YS. The correlation analysis of main gas pollutants and PM2. 5 in an urban city. Forest Eng. 2016;32(2):65–68.
16. Zhu YW, Fu Q, Xie PH, et al. DOAS monitoring and analysis of winter air pollutants in Beijing. Spectrosc Spectral Anal. 2009;(05):1390–1393.
17. Xu WS, Li YT, Sun RW, Dong X, Qiu QH. Characteristic analysis of influence of typical dust return weather process on air quality in Beijing. Acta Sci Circumstantiae. 2014;34(2):297–302.
18. Annunziata F, Massimo S, Giovanna C, Forastiere F. Short-term effects of air pollution in a cohort of patients with chronic obstructive pulmonary disease. Epidemiology. 2012;23:861–869. doi:10.1097/EDE.0b013e31826767c2
19. Hooper LG, Young MT, Keller JP, et al. Ambient air pollution and chronic bronchitis in a Cohort of U.S. women. Environ Health Perspect. 2018:2. doi:10.1289/EHP2199.
20. Chi MC, Guo SE, Hwang SL, Chou CT, Lin CM, Lin YC. Exposure to indoor particulate matter worsens the symptoms and acute exacerbations in chronic obstructive pulmonary disease patients of southwestern taiwan: a pilot study. Int J Environ Res Public Health. 2017;14:4. doi:10.3390/ijerph14010004
21. Dragonieri S, Lacedonia D, Scioscia G, et al. Assessment of induced sputum cellularity in COPD patients belonging to two different classes of air pollution exposure. Arch Bronconeumol. 2019;30:S0300–2896(19)30291–1. doi:10.1016/j.arbres.2019.06.016
 © 2020 The Author(s). This work is published and licensed by Dove Medical Press Limited. The
full terms of this license are available at https://www.dovepress.com/terms
and incorporate the Creative Commons Attribution
- Non Commercial (unported, 3.0) License.
By accessing the work you hereby accept the Terms. Non-commercial uses of the work are permitted
without any further permission from Dove Medical Press Limited, provided the work is properly
attributed. For permission for commercial use of this work, please see paragraphs 4.2 and 5 of our Terms.
© 2020 The Author(s). This work is published and licensed by Dove Medical Press Limited. The
full terms of this license are available at https://www.dovepress.com/terms
and incorporate the Creative Commons Attribution
- Non Commercial (unported, 3.0) License.
By accessing the work you hereby accept the Terms. Non-commercial uses of the work are permitted
without any further permission from Dove Medical Press Limited, provided the work is properly
attributed. For permission for commercial use of this work, please see paragraphs 4.2 and 5 of our Terms.