Back to Journals » International Journal of General Medicine » Volume 17
Correlation of Circulating Complement Levels with Clinical Characteristics of Patients with Diabetic Retinopathy
Received 20 June 2024
Accepted for publication 4 November 2024
Published 26 November 2024 Volume 2024:17 Pages 5581—5591
DOI https://doi.org/10.2147/IJGM.S483571
Checked for plagiarism Yes
Review by Single anonymous peer review
Peer reviewer comments 2
Editor who approved publication: Dr Jacopo Manso
Guangjiang Wang, Yuan Guo
Department of Ophthalmology, The Fourth Hospital of Baotou, Baotou City, Inner Mongolia Autonomous Region, 014030, People’s Republic of China
Correspondence: Yuan Guo, Department of Ophthalmology, The Fourth Hospital of Baotou, No. 1, Aogen Road, Qingshan District, Baotou City, Inner Mongolia Autonomous Region, 014030, People’s Republic of China, Email [email protected]
Background: Type 2 diabetes mellitus (T2DM) is associated with diabetic retinopathy (DR). The complement system maintains the normal physiologic microenvironment of the retina. The relationship between serum complement levels and clinical features of DR remains unclear.
Methods: Clinical characteristics of 252 patients with T2DM including 101 with non-DR (NDR), 79 with nonproliferative DR (NPDR), and 72 with proliferative DR (PDR) were prospectively analyzed. Serum complement levels were compared between NDR and DR patients. The correlation between clinical characteristics and complement levels in DR patients was analyzed. A multifactorial logistic analysis was constructed to predict the risk of developing DR in T2DM.
Results: Serum C4, CFB, CFI, C3 and C5 levels were higher in DR patients than in NDR patients (all P < 0.05). In T2DM patients, C3 and C4 levels were higher in PDR patients than in DR patients (all P < 0.05), and MBL levels were not statistically different between the two cohorts (P > 0.05). These complement components or fragments were positively correlated with the duration of diabetes, glycosylated hemoglobin (HbA1c), and triglycerides (TG) (all P < 0.05). C3, C5, the duration of diabetes, HbA1c, and TG were the independent risk factors for DR in T2DM patients. The ROC model showed good value for predicting the risk of developing DR in T2DM with an area under the curve of 0.887.
Conclusion: Serum complements C3 and C5 are predictive factors for DR in patients with T2DM. The prediction model constructed by the clinical characteristics of patients with T2DM and complement can better distinguish between NDR and DR, and can be used as a potential biomarker for assessing the risk of developing DR.
Keywords: Complement system, diabetic retinopathy, clinical features, complement factors
Introduction
Diabetes mellitus (DM), the prevalence of which is increasing worldwide, is characterized by hyperglycemia and abnormal metabolism of glucose, fats, and proteins due to insufficient insulin secretion and/or resistance.1 DM patients often suffer from systemic and ocular health complications, including diabetic retinopathy and diabetic macular edema.2 It is a common ocular microangiopathy in people with type 2 diabetes mellitus (T2DM), which can result in irreversible blindness.3 The global prevalence of DM among people aged 20–79 years is 536.6 million in 2021, and will rise to 783.2 million in 2045.4
Growing evidence suggests a connection between the complement system and inflammatory states, pinpointing it as a key element in inflammatory disorders.5 Evidently, interactions with complement systems trigger various inflammatory reactions and are initiated via three primary pathways (classical, alternative, and lectin).6 The classical pathway starts with binding between C1q and antibody, followed by cleavage of C2 and C4 by the C1 complex and synthesis of C3 convertase. The alternative pathway, also known as the bypass pathway, which transgresses C1, C4, and C2 and activates C3 directly, with the involvement of different factors to form C3 convertase. The lectin pathway, also known as the mannose-binding lectin (MBL) pathway, is activated by the interaction of MBL with mannose-containing polysaccharides found on the surface of microorganisms to cleave C4 and C4 and synthesize C3 invertase.7 A key step in complement activity is the formation of C3 convertase, which cleaves C3 into C3a and C3b.8,9 This step is the common confluence of the three pathways and initiates the effector function of the complement system. Studies have shown that complement is associated with ocular pathologies, including age-related macular degeneration, uveitis, and glaucoma.10–12 In age-related macular degeneration, inhibition of C3a, C5a, CFB, and MAC or administration of the complement regulatory molecules CD59 and CFH prevents choroidal neovascularization in animal models.13 Complement activator-inhibiting agents to experimental uveitis rats suppresses the expression of ocular swelling inflammatory factors, C3 activators, and adhesion factors, thereby inhibiting experimental uveitis.14 Further, polymorphisms in genes that encode complement, CFB, CFI, and its receptor, as well as C5 have been shown to contribute to the risk of disease.15–17 Complement-mediated molecular processes associated with ocular diseases are likely to be a combination of systemic complement proteins as well as locally synthesized complement proteins.18 Although disorders of complement regulation in ocular diseases continue to attract interest, relatively few studies have been conducted on the role of complement in DR.
Serum samples are relatively easy to obtain in contrast to atrial fluid samples, which require stringent requirements and handling. Complement levels can thus be measured in serum samples, which has the benefit of simplicity, ease of implementation, and greater patient acceptance. This study hypothesized that DR in patients with T2DM is associated with complement and that the severity of DR is driven by the complement system. In addition, the correlation between complement factors or fragments and clinical characteristics of patients was assessed.
Materials and Methods
Patients
From June 2022 to December 2023, 252 patients from The Fourth Hospital of Baotou were enrolled in the study, all of whom had T2DM diagnosed according to the 2010 WHO diagnostic criteria for DM: FPG ≥ 7.0 mmou/l and/or HbA1c ≥ 6.5%.19 The severity of DR was graded according to the International Clinical Diabetic Retinopathy and Diabetic Macular Edema Disease Severity Scales.20 All enrolled patients underwent ophthalmologic examination, including dilated fundus examination and fundus photography or fluorescence angiography. Patients were categorized into 3 subgroups based on clinical findings: 101 patients with non-DR (NDR), 79 patients with nonproliferative DR (NPDR, with mild fundus lesions), and 72 patients with proliferative DR (PDR, with neovascularization).
Inclusion criteria (1) Patients with T2DM between the ages of 30 and 80 years; (2) Retinal punctate and speckled hemorrhages and hard exudates or cotton-wool spots were observed in the non-proliferative phase. Retinal neovascularization in the proliferative phase severely affects vision and quality of life. (3) No history of ocular intervention (eg, laser photocoagulation, vitrectomy, or injection of anti-vascular endothelial growth factor in either eye).
Exclusion criteria: (1) pregnant patients; (2) combination of other severe hepatic or renal dysfunction or disease; (3) patients with infection or recent surgery; (4) severe cardiovascular-related disease; (5) autoimmune disease; (6) glaucoma, vitreomacular disease (vitreous hemorrhage and retinal detachment), or amblyopia. All subjects provided informed consent. The study was approved by the Ethics Committee of The Fourth Hospital of Baotou (No.202102BT06). Patient inclusion is shown in Figure 1.
 |
Figure 1 Data acquisition. |
General Information and Laboratory Data
General information such as age, gender, duration of diabetes (years), body mass index (BMI), diastolic blood pressure (DBP), systolic blood pressure (SBP) were collected.
Venous blood samples were taken in the morning after at least 3-h fasting. Peripheral venous blood (10 mL) was drawn into test tubes without or with anticoagulant. Blood was stored at room temperature for 1 h and then centrifuged for 20 min(1500 g, 4°C) to separate the serum. Blood was centrifuged for 15 min (800 g, 4°C) to separate the plasma. The supernatant was then centrifuged for another 10 min (1600 g, 4°C). All samples were then dispensed into cryovials and stored at −80°C.
Total cholesterol (TC), triglycerides (TG), high-density lipoprotein cholesterol (HDL-C), and low-density lipoprotein cholesterol (LDL-C) were determined using an Olympus AU5400 system (Olympus, Tokyo, Japan). HbA1c was measured using a Bio-RadD10 automated analyzer (Bio-Rad, CA, USA). Urine protein and creatinine in urine were measured using an immunoturbidimetric method using a Hitachi 7600–020 urine biochemistry analyzer (Hitachi, Tokyo, Japan), and their ratio was obtained by automatic calculation.
Human complements (C1q, C2, C3, C3a, C4, C4b, C5, MBL, CFB, CFD, CFI, CFH) were quantified using a Luminex 200 system (Luminex Corporation, TX, USA) in combination with MILLIPLEX MAP Human Complement Magnetic Bead Panel 2-Immunology Multiplex Assay (HCMP2MAG-19K, Merck Millipore, MA, USA). The coefficient of variation was less than 20%. Complement components or fragments that were too low and below the detection range were not included in the analysis.
Statistical Analysis
The sample size of the study was estimated using G*Power software version 3.1.9.2 with a significance level of α = 0.05, power of 1-β = 0.8, effect size of d = 0.5, and two-sided tests. Statistical analyses were performed using SPSS 20.0 software. Enumeration data were expressed as frequencies and ratios, and the person chi-square test was used. The Shapiro–Wilk test was used to determine data normality. All continuous data were expressed as mean ± standard deviation. Student’s t-test and Mann–Whitney U-test were used for between-group comparisons for data on continuous variables in a normal distribution or in a skewed distribution, respectively. Spearman’s bivariate correlation analysis was used, while the results of all multiple tests were corrected using the false discovery rate (FDR). Parameters that were statistically significant (P < 0.05) in the univariate analysis were included in the multivariate logistic regression analysis model. Column-line plots were constructed using the R language. The validity of the model was assessed by analyzing the predictive values of the model based on multifactorial logistic regression using the receiver operating characteristic curve (ROC) and calculating the area under the curve (AUC). Other graphs were plotted using GraphPad Prism 8.
Results
General Characteristics and Biochemical Results
Table 1 shows the general characteristics and biochemical results of patients. There were no significant differences between the three groups in terms of gender, age and BMI (all P > 0.05). The mean duration of disease in the DR group was 12.25 years, which was higher than that in the NDR group. The mean duration of disease in the PDR group was 15.01 years, which was significantly higher than that in the NPDR group (P < 0.05). In terms of biochemical indices, HbA1c, TG, and urine protein/creatinine were higher in DR patients (NPDR and PDR groups) than in the NDR group (all P < 0.05). There were no statistically significant differences in blood pressure levels (SBP and DBP), TC, HDL-C and LDL-C between the groups (all P > 0.05).
 |
Table 1 Clinical Characteristics of Patients with T2DM |
Levels of Serum Complement Components/Fragments
Table 2 shows serum complement components/fragments in patients. C4 was statistically different between patients in the NDR and DR groups, and C4 had a higher level in patients in the DR group (P < 0.05). However, the Lectin pathway-specific component MBL did not differ between the two groups, suggesting that the increase in C4 levels during disease progression mainly resulted from the activation of the classical pathway. The alternative pathway-specific components CFB and CFI differed between the two groups, with higher levels in the patients in the DR group (both P < 0.05). Complement/fragment C3 and C5 shared by the three pathways were statistically different between the two groups, with higher levels in patients in the DR group (both P < 0.05). Further got, CFB, CFI and C5 levels were higher in patients in NPDR and PDR patients than in NDR patients. C4 and C3 levels were significantly different in patients in NPDR and PDR groups, with higher levels in patients in PDR group (all P < 0.05). While CFB, CFI, MBL and C5 were not different in patients of NPDR and PDR groups (all P > 0.05) (Figure 2). These results suggest that activation of the classical pathway of complement may promote NPDR to PDR. In addition, there was no significant difference in C4 levels between the NPDR and PDR groups (P > 0.05).
 |
Table 2 Levels of Serum Complement Components/Fragments in NDR and DR Patients |
 |
Figure 2 Comparison of serum levels of complement components/fragments in patients in the NDR, NPDR and PDR groups. Student’ t test or Mann–Whitney U-test was used to compare the differences between the two groups. * NPDR or PDR vs NDR, P < 0.05, # PDR vs NDR, P < 0.05. |
Correlation of Serum Complement Components/Fragments with Clinical Features in DR Patients
Table 3 shows the correlation between serum complement components/fragments and clinical characteristics in DR patients. C4, CFB, CFI, C3 and C5 showed significant positive correlation with the duration of diabetes in patients (all P < 0.05). Among them, C3 showed a strong correlation with diabetes duration (rs = 0.557). HbA1c and TG also showed positive and statistically significant correlations with the above serum components (all P < 0.05). In addition, C3 and C5 showed a weak positive correlation with urine protein/creatinine (rs = 0.189, rs = 0.175) (both P < 0.05).
 |
Table 3 Correlation Between Serum Complement Components/Fragments and Clinical Characteristics of PDR Patients |
Serum Complement Recognition DR
Multivariate logistic regression analysis was performed on factors with statistical differences in univariate analysis, including duration of diabetes, HbA1c, TG, urine protein/creatinine, and complement factors or fragments. Duration of diabetes, HbA1c, TG, and complement components C3 and C5 were independent risk factors for DR in patients with T2DM (all P < 0.05) (Table 4). Figure 3A shows the independent risk factors in the results of logistic regression analysis. Based on the independent risk factors, a column-line plot of the RMPP model was constructed. The total score is the sum of the scores corresponding to each independent risk factor (Figure 3B). Finally, based on the predicted values of the logistic regression model, ROC curve was plotted. As shown in Figure 3C, the AUC was 0.876, and the sensitivity of the optimal cutoff value for DR prediction was 92.34%, and the specificity was 65.36%.
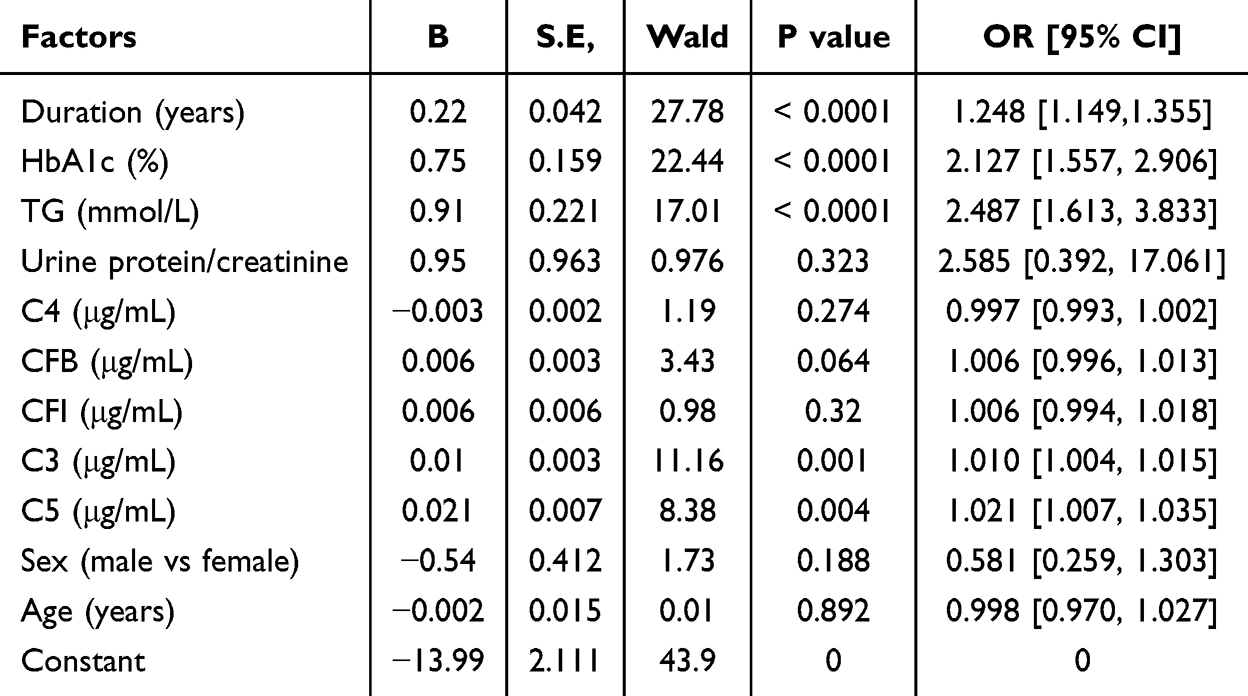 |
Table 4 Multifactorial Logistic Regression Analysis of Independent Correlates of DR in Patients |
 |
Figure 3 Diagram of predictive model and model evaluation. (A) Multifactor logistic regression analysis model diagram (forest plot). (B) Column line plot of predicting the risk of PDR. (C) ROC curve. P < 0.05. |
Discussion
DR is a neurovascular disease whose pathogenesis involves the activation of multiple cellular pathways that are not yet fully understood.21,22 However, it has been generally demonstrated that hyperglycemia is the initiating event of DR, which subsequently leads to local oxidative stress and inflammation.23,24 In diabetic mice, exosomes carrying immunoglobulins in plasma activate the complement system, which promotes intraocular vascular damage and progression, leading to retinopathy.25 However, most studies have reported clinical correlates of early or PDR, and fewer studies have reported the relationship between circulating complement and clinical features in patients with DR. In related literature, it has been showed that the levels of C3 and its activated fragment C3b are significantly elevated in the vitreous of patients with proliferative diabetic retinopathy (PDR), accompanied by an upregulation of complement factor H (CFH) expression. This suggests an association between PDR and the activation of alternative complement pathways. Conversely, in serum samples, only a slight difference was noted in C3 levels between the PDR group and non-diabetic controls, with no statistically significant difference observed. It is important to consider that this lack of significance may be attributed to a limited sample size (PDR, n=38).26 Therefore, this study expanded the sample size, classified patients in the T2DM population, and investigated their clinical data and measured serum complement. Furthmore, established a predictive model for identifying the clinical characteristics of DR and complement in T2DM patients. In this study, the results showed that serum C3, C4, CFB, CFI and C5 had higher levels in patients with DR relative to NDR. C3 and C5 were strongly correlated with clinical characteristics (diabetes duration, HbA1c and TG). The prediction model constructed by these independent factors had a good discriminatory value.
DR is a progressive complication of T2DM, and prolonged hyperglycemia is a major cause of the onset and progression of diabetes-related fundopathy or other microvascular diseases, and these pathologic changes are maintained by persistently high levels of blood glucose.27 Persistent elevated blood glucose and irregular blood flow dynamics result in changes to the integrity of retinal blood vessels, harm to endothelial cells, and breakdown of the blood-retinal barrier, enhancing the permeability of retinal blood vessels and causing retinal leakage.28,29 It is reported that the longer course of diabetes and poor blood glucose control are important risk factors for DR.30,31 Our study also found that elevated TG and urine protein/creatinine ratio are also independent risk factors for DR.
Oxidative stress, a key consequence of hyperglycemia, is recognized as a pathological condition where heightened reactive oxygen species production harms tissues, cells, and large molecules. Heightened retinal metabolic rate makes it particularly vulnerable to oxidative stress.32 Subsequently, chronic oxidative stress leads to alterations in proteins and lipids in the eye; these tissue changes trigger chronic inflammation involving the complement system; the complement system mediates the immune response and inflammatory response mediates invasive immune cells promoting retinal pathology.33 Previous studies have shown that complement is associated with retinopathy. For example, localized inhibition of C3 expression in a rat model of retinopathy suppresses activation and deposition of circulating complement and reduces retinal cell death.34 In addition, intravitreal injection of complement C5 antibody in a glaucoma model rat consistently activates the complement system, inhibits inflammatory response, and reduces retinal loss.35
Notably, the complement system has also been reported to be associated with PDR. It is generally believed that the formation of neovascularization, a hallmark of PDR, is associated with the production of retinal angiogenic factors.36 Complement system activation promotes neovascularization by facilitating the production of growth factors.37 In our study, C4, CFB, CFI, C3, and C5 were higher in patients with DR compared with patients with NDR, and the difference in C4 levels was attributed to patients with PDR. Of interest, MBL did not differ between the two groups; therefore, we believe that the elevated C4 was mainly due to activation of the classical pathway. In addition, we did not observe differences in CFB, CFI, and C5 levels between PDR patients and NPDR patients. These results suggest that the classical and bypass pathways are involved in DR. In addition, the classical pathway is partially involved in the progression of DR to PDR. No relevant studies seem to have found this at present. Subsequently, we focused on the clinical characteristics of DR patients in relation to complement and showed that diabetes duration, HbA1c and TG levels were positively correlated with C4, CFB, CFI, C3 and C5, with the C3 level showing a moderately strong correlation with diabetes duration. Subsequently, we confirmed that diabetes duration, HbA1c, TG, and complement components C3 and C5 were independent risk factors for DR in patients with T2DM. The ROC prediction model constructed with these clinical characteristics and complement was effective in identifying DR patients from T2DM.
Limitations
This study also has some limitations. In the absence of a sufficient number of samples, we were not able to investigate the independent correlates of PDR and determine the independent risk factors for progression from NPDR to PDR. In addition, optical coherence tomography (OCT) can localize lesions deeper into the retina in patients with DR. For DR patients, OCT features are more beneficial in understanding correlations between disease onset and progression characteristics and complement. Finally, this study only supports the correlation of clinical features with complement and the construction of predictive models in patients with T2DM before they receive eye-related therapeutic interventions. In future studies, it is necessary to further investigate the correlation between complement factors with NPDR and PDR.
Conclusion
The present study demonstrated that the classical and bypass pathways of complement play a role in DR and are associated with longer diabetes duration and higher HbA1c and TG levels. The predictive model constructed from the clinical characteristics of T2DM patients and complement can better differentiate between NDR and DR, and may serve as a potential biomarker for assessing the risk of developing DR. In addition, classical pathways may mediate DR progression.
Data Sharing Statement
Data is available from the corresponding author on request.
Ethics Statement
All procedures performed in this study involving human participants were in accordance with the ethical standards of the institutional and/or national research committee and with the 1964 helsinki Declaration and its later amendments or comparable ethical standards. All subjects were approved by The Fourth Hospital of Baotou (No.202102BT06).
Funding
There is no funding to report.
Disclosure
The authors have no conflicts of interest to declare.
References
1. Sun Y, Sun P, Hu Y, et al. Elevated testicular apoptosis is associated with elevated sphingosine driven by gut microbiota in prediabetic sheep. BMC Biol. 2022;20(1):121. doi:10.1186/s12915-022-01326-y
2. Toto L, D’Aloisio R, Quarta A, et al. Intravitreal dexamethasone implant (IDI) alone and combined with navigated 577 nm subthreshold micropulse laser (SML) for diabetic macular oedema. J Clin Med. 2022;11(17):5200. doi:10.3390/jcm11175200
3. Chen X, Zhang X, Gong Z, et al. The link between diabetic retinal and renal microvasculopathy is associated with dyslipidemia and upregulated circulating level of cytokines. Front Public Health. 2022;10:1040319. doi:10.3389/fpubh.2022.1040319
4. Sun H, Saeedi P, Karuranga S, et al. IDF diabetes atlas: global, regional and country-level diabetes prevalence estimates for 2021 and projections for 2045. Diabet Res Clin Pract. 2022;183:109119. doi:10.1016/j.diabres.2021.109119
5. Zhang T, Zeng J, Ye J, et al. Serum complement proteins rather than inflammatory factors is effective in predicting psychosis in individuals at clinical high risk. Transl Psychiatry. 2023;13(1):9. doi:10.1038/s41398-022-02305-1
6. Cho MS, Vasquez HG, Rupaimoole R, et al. Autocrine effects of tumor-derived complement. Cell Rep. 2014;6(6):1085–1095. doi:10.1016/j.celrep.2014.02.014
7. Degn SE, Jensenius JC, Thiel S. Disease-causing mutations in genes of the complement system. Am J Hum Genet. 2011;88(6):689–705. doi:10.1016/j.ajhg.2011.05.011
8. Varghese PM, Kishore U, Rajkumari R. Human C1q regulates influenza a virus infection and inflammatory response via its globular domain. Int J Mol Sci. 2022;23(6):3045. doi:10.3390/ijms23063045
9. Khan MA, Assiri AM, Broering DC. Complement and macrophage crosstalk during process of angiogenesis in tumor progression. J Biomed Sci. 2015;22(1):58. doi:10.1186/s12929-015-0151-1
10. Alexander P, Gibson J, Cree AJ, Ennis S, Lotery AJ. Complement factor I and age-related macular degeneration. Mol Vis. 2014;20:1253–1257.
11. Thompson IA, Liu B, Sen HN, et al. Association of complement factor H tyrosine 402 histidine genotype with posterior involvement in sarcoid-related uveitis. Am J Ophthalmol. 2013;155(6):1068–74e1. doi:10.1016/j.ajo.2013.01.019
12. Reinehr S, Doerner JD, Mueller-Buehl AM, et al. Cytokine and complement response in the glaucomatous betaB1-CTGF mouse model. Front Cell Neurosci. 2021;15:718087. doi:10.3389/fncel.2021.718087
13. Kim SJ, Kim J, Lee J, et al. Intravitreal human complement factor H in a rat model of laser-induced choroidal neovascularisation. Br J Ophthalmol. 2013;97(3):367–370. doi:10.1136/bjophthalmol-2012-302307
14. Manickam B, Jha P, Hepburn NJ, et al. Suppression of complement activation by recombinant Crry inhibits experimental autoimmune anterior uveitis (EAAU). Mol Immunol. 2010;48(1–3):231–239. doi:10.1016/j.molimm.2010.08.006
15. Su Y, Hu Z, Pan T, Chen L, Xie P, Liu Q. Complement factor B gene polymorphisms and risk of age-related macular degeneration: a meta-analysis. Eur J Ophthalmol. 2020;30(4):743–755. doi:10.1177/1120672119840245
16. Sigalingging T, Perdamaian ABI, Romdhoniyyah DF, et al. rs10737680 polymorphism in complement factor H and neovascular age-related macular degeneration in Yogyakarta, Indonesia. Med Hypothesis Discov Innov Ophthalmol. 2022;11(2):71–76. doi:10.51329/mehdiophthal1448
17. Xu D, Yi H, Yu S, Li X, Qiao Y, Deng W. Association of complement C5 gene polymorphisms with proliferative diabetic retinopathy of type 2 diabetes in a Chinese han population. PLoS One. 2016;11(3):e0149704. doi:10.1371/journal.pone.0149704
18. Armento A, Ueffing M, Clark SJ. The complement system in age-related macular degeneration. Cell Mol Life Sci. 2021;78(10):4487–4505. doi:10.1007/s00018-021-03796-9
19. American Diabetes Association. Executive summary: standards of medical care in diabetes--2010. Diabetes Care. 2010;33(Suppl 1):S4–10. doi:10.2337/dc10-S004
20. Wilkinson CP, Ferris FL 3rd, Klein RE, et al. Proposed international clinical diabetic retinopathy and diabetic macular edema disease severity scales. Ophthalmology. 2003;110(9):1677–1682. doi:10.1016/S0161-6420(03)00475-5
21. Oshitari T. The pathogenesis and therapeutic approaches of diabetic neuropathy in the retina. Int J Mol Sci. 2021;22(16):9050. doi:10.3390/ijms22169050
22. Martins T. Diabetic retinopathy: a neuropathy. Einstein. 2020;19:eED6110. doi:10.31744/einstein_journal/2021ED6110
23. Callan A, Jha S, Valdez L, Tsin A. Cellular and molecular mechanisms of neuronal degeneration in early-stage diabetic retinopathy. Curr Vasc Pharmacol. 2024;22(5):301–315. doi:10.2174/0115701611272737240426050930
24. Ucgun NI, Zeki-Fikret C, Yildirim Z. Inflammation and diabetic retinopathy. Mol Vis. 2020;26:718–721.
25. Huang C, Fisher KP, Hammer SS, Navitskaya S, Blanchard GJ, Busik JV. Plasma exosomes contribute to microvascular damage in diabetic retinopathy by activating the classical complement pathway. Diabetes. 2018;67(8):1639–1649. doi:10.2337/db17-1587
26. Zhang H, Wang W. Zhang Huijuan, Wang Wei, Risk factors and adverse pregnancy outcomes in older pregnant women with hypertensive disorders of pregnancy. J Obstet Gynaecol Res. 2022;48(7):1710–1720. doi:10.1111/jog.15295
27. Shivarudrappa AH, Ponesakki G. Lutein reverses hyperglycemia-mediated blockage of Nrf2 translocation by modulating the activation of intracellular protein kinases in retinal pigment epithelial (ARPE-19) cells. J Cell Commun Signal. 2020;14(2):207–221. doi:10.1007/s12079-019-00539-1
28. Qian J, Huang Y. Expression of TNF-alpha and IL-1beta in Peripheral Blood of Patients with T2DM Retinopathy. Comput Math Methods Med. 2022;2022:9073372. doi:10.1155/2022/9073372
29. Hassan H, Cheema A, Tahir MA, Nawaz HN. Comparison of choroidal thickness in eyes of diabetic patients with eyes of healthy individuals using optical coherence tomography in a tertiary care hospital. Pak J Med Sci. 2022;38(1):254–260. doi:10.12669/pjms.38.1.4443
30. Beatriz M, Madania A, Flávio R, et al. Extracellular vesicles and microRNA: putative role in diagnosis and treatment of diabetic retinopathy. Antioxidants. 2020;9(8):705. doi:10.3390/antiox9080705
31. Sunil M, Teresa S, Peter E, et al. Optimizing medical management in patients with sight-threatening diabetic retinopathy. Ophthalmol Ther. 2016;6(1):105–114. doi:10.1007/s40123-016-0069-z
32. Haydinger CD, Oliver GF, Ashander LM, Smith JR. Oxidative stress and its regulation in diabetic retinopathy. Antioxidants. 2023;12(8):1649. doi:10.3390/antiox12081649
33. Pujol-Lereis LM, Schafer N, Kuhn LB, Rohrer B, Pauly D. Interrelation between oxidative stress and complement activation in models of age-related macular degeneration. Adv Exp Med Biol. 2016;854:87–93.
34. Natoli R, Fernando N, Jiao H, et al. Retinal Macrophages synthesize C3 and activate complement in AMD and in models of focal retinal degeneration. Invest Ophthalmol Vis Sci. 2017;58(7):2977–2990. doi:10.1167/iovs.17-21672
35. Reinehr S, Gomes SC, Gassel CJ, et al. Intravitreal therapy against the complement factor C5 prevents retinal degeneration in an experimental autoimmune glaucoma model. Front Pharmacol. 2019;10:1381. doi:10.3389/fphar.2019.01381
36. Singh R, Rajaraman S, Balasubramanian M. A novel nanoparticle mediated selective inner retinal photocoagulation for diseases of the inner retina. IEEE Trans NanoBiosci. 2017;16(7):542–554. doi:10.1109/TNB.2017.2741490
37. Jeon H, Han SR, Lee S, et al. Activation of the complement system in an osteosarcoma cell line promotes angiogenesis through enhanced production of growth factors. Sci Rep. 2018;8(1):5415. doi:10.1038/s41598-018-23851-z
 © 2024 The Author(s). This work is published and licensed by Dove Medical Press Limited. The
full terms of this license are available at https://www.dovepress.com/terms
and incorporate the Creative Commons Attribution
- Non Commercial (unported, 3.0) License.
By accessing the work you hereby accept the Terms. Non-commercial uses of the work are permitted
without any further permission from Dove Medical Press Limited, provided the work is properly
attributed. For permission for commercial use of this work, please see paragraphs 4.2 and 5 of our Terms.
© 2024 The Author(s). This work is published and licensed by Dove Medical Press Limited. The
full terms of this license are available at https://www.dovepress.com/terms
and incorporate the Creative Commons Attribution
- Non Commercial (unported, 3.0) License.
By accessing the work you hereby accept the Terms. Non-commercial uses of the work are permitted
without any further permission from Dove Medical Press Limited, provided the work is properly
attributed. For permission for commercial use of this work, please see paragraphs 4.2 and 5 of our Terms.