Back to Journals » Journal of Pain Research » Volume 11
Correlation of changes in hemodynamic response as measured by cerebral optical spectrometry with subjective pain ratings in volunteers and patients: a prospective cohort study
Authors Eisenried A, Austin N, Cobb B, Akhbardeh A, Carvalho B, Yeomans DC, Tzabazis AZ
Received 17 January 2018
Accepted for publication 24 July 2018
Published 24 September 2018 Volume 2018:11 Pages 1991—1998
DOI https://doi.org/10.2147/JPR.S162839
Checked for plagiarism Yes
Review by Single anonymous peer review
Peer reviewer comments 6
Editor who approved publication: Dr Katherine Hanlon
Andreas Eisenried,1,2 Naola Austin,1 Benjamin Cobb,1 Alireza Akhbardeh,3 Brendan Carvalho,1 David C Yeomans,1 Alexander Z Tzabazis1,4
1Department of Anesthesiology, Perioperative and Pain Medicine, Stanford University School of Medicine, Stanford, CA, USA; 2Department of Anesthesiology, University Hospital Erlangen, Erlangen, Germany; 3ROPAmedics LLC, San Francisco, CA, USA; 4Department of Anesthesiology and Critical Care, University Hospital Schleswig-Holstein, Lübeck, Germany
Purpose: Noninvasive cerebral optical spectrometry is a promising candidate technology for the objective assessment physiological changes during pain perception. This study’s primary objective was to test if there was a significant correlation between the changes in physiological parameters as measured by a cerebral optical spectrometry-based algorithm (real-time objective pain assessment [ROPA]) and subjective pain ratings obtained from volunteers and laboring women. Secondary aims were performance assessment using linear regression and receiver operating curve (ROC) analysis.
Patients and methods: Prospective cohort study performed in Human Pain Laboratory and Labor and Delivery Unit. After institutional review board approval, we evaluated ROPA in volunteers undergoing the cold pressor test and in laboring women before and after epidural or combined spinal epidural placement. Linear regression was performed to measure correlations. ROCs and corresponding areas under the ROCs (AUC), as well as Youden’s indices, as a measure of diagnostic effectiveness, were calculated.
Results: Correlations between numeric rating scale or visual analog scale and ROPA were significant for both volunteers and laboring women. AUCs for both volunteers and laboring women with numeric rating scale and visual analog scale subjective pain ratings as ground truth revealed at least good (AUC: 70%–79%) to excellent (AUC >90%) distinction between clinically meaningful pain severity differentiations (no/mild–moderate–severe).
Conclusion: Cerebral Optical Spectrometry-based ROPA significantly correlated with subjectively reported pain in volunteers and laboring women, and could be a useful monitor for clinical circumstances where direct assessment is not available, or to complement patient-reported pain scores.
Keywords: pain, assessment, objective, subjective, quantification, cerebral optical spectrometry
Introduction
Adequate pain management mandates proper assessment of pain severity.1,2 Unfortunately, the current gold-standard of self-reported pain by means of a numeric rating scale (NRS) or a visual analog scale (VAS) are not ideal measurement tools. The need for patient’s cooperation and communication, potential bias, and lack of reliability and objectivity are some disadvantages of self-reporting pain assessment tools, such as NRS, verbal rating scale, or VAS.1–5 Therefore, it would be highly desirable to have a more objective assessment of pain based upon physiological parameters or changes thereof. Over the years, several candidate technologies have been described. Examples for physiological parameters include heart rate variability-based approaches such as assessment of changes of the low-frequency to high-frequency ratio, the analgesia nociception index, and the cardiorespiratory coherence algorithm.6–9 Other groups have investigated the fluctuations of skin conductance, pupillometry, or the processed electroencephalogram (eg, composite variability index).10–12 Magnetic resonance imaging (MRI) techniques, such as blood oxygenation level-dependent functional MRI or arterial spin labeling, seems to be very promising for assessing pain objectively for clinical research.2,13 However, this technology is not suited to be used in a clinical setting secondary to cost, availability, and size of the required equipment. A relatively new and emerging technology to assess pain objectively, functional near infrared spectroscopy (Optical Spectrometry), has been shown to correlate strongly with functional MRI based approaches.14,15 Advantages of this technology include noninvasiveness, portability, and that the technology is already widely used to assess eg, language and memory capacities or responsiveness to intravenous fluids, but not necessarily painful stimuli, in neonates and children.16,17
The aim of this prospective cohort study was to evaluate an algorithm based on cerebral optical spectrometry technology (developed by ROPAmedics LLC, San Francisco, CA, USA) in volunteers undergoing noxious stimulation and laboring women. The primary objective of the study was to determine whether changes in cerebral hemodynamics using Optical Spectrometry correlate significantly with subjective pain ratings obtained from volunteers and laboring women, respectively. Secondary aims were assessment of algorithm performance using linear regression and receiver operating curve (ROC) analysis.
Materials and methods
Subjects
We conducted a prospective cohort study, with blinding between cerebral optical spectrometry analysis and pain assessments. After institutional review board (Research Compliance Office, Stanford University, Stanford, CA, USA) approved this study and written informed consent was obtained from all participants, we enrolled six volunteers and eight laboring women for this study. Subjects were aged between 18–60 years old. Exclusion criteria for both volunteers and laboring women were allergy to adhesives, chronic pain conditions and/or moderate/severe comorbidities, inability to give informed consent, and use of analgesics 1 week prior to testing. An additional exclusion criterion for volunteers was Raynaud’s syndrome. This study was registered at clincialtrials.gov (NCT02036567).
Cold pressor test
Volunteers went through training for the cold pressor test (CPT) before actual testing. On the study day, they were instructed to remove jewelry from the left hand and forearm at the beginning of the session. After obtaining about 3 minutes of baseline cerebral optical spectrometry readings without pain, participants slowly moved their left hand into an insulated bucket of ice water (4°C–5°C). They were instructed to spread their fingers apart and to accurately adjust painful sensations using the sliding scale potentiometer (see “Subjective pain ratings” section for details). Participants were asked to keep their hand in the ice water as long as possible with a maximum immersion time of 5 minutes, but were permitted to withdraw their hand from the cold water at any time. Once the hand was withdrawn or maximum immersion time was achieved and subjective pain ratings were adjusted down to no pain, an additional 3-minute baseline was obtained before repeating the CPT in identical fashion (second round). Data of both rounds were included for statistical analyses.
Subjective pain ratings
Volunteers were instructed to rate their pain continuously with their right hand using a custom-built Atmel ATmega2560-based sliding VAS linear potentiometer on a scale from 0 being no pain to 1,000 being the worst pain imaginable. Data were captured with a sampling rate of 500 Hz and down sampled at a rate of 1 Hz for further data analysis.
Laboring women were approached for the study on preanesthetic consultation prior to epidural or combined spinal epidural (CSE) placement.
During the course of the study, laboring women received our institutional standard labor analgesia doses: labor epidural: 15 mL of 0.125% bupivacaine with 10 µg sufentanil in three divided doses. Labor CSE: 1 mL of 0.25% bupivacaine with 5 µg sufentanil. Subjective verbal NRS ratings were obtained at multiple time points throughout the study with 0 being no pain and 10 being the worst pain imaginable from initiation of labor analgesia request until adequate analgesia was achieved (NRS ≤3). Laboring women then received a standard patient-controlled epidural analgesia (continuous infusion of 12 mL/h of 0.0625% bupivacaine with 0.4 µg/mL sufentanil with optional boluses).
Optical spectrometry
After prepping the skin on the forehead with an alcohol swab, a commercial OxiMax®, Max-Fast® sensor (Tyco Healthcare, Nellcor, Pleasanton, CA, USA) was applied and secured with the headband included in the package following directions according to manufacture’s instructions. The sensor was then connected to the investigational device.
The real-time objective pain assessment (ROPA, ROPAmedics LLC) is computed using signal processing and predictive model algorithms. The following data processing steps are performed (Figure 1):
- Light source generation and calibration: the ROPA Cerebral Oximetry device has several built-in algorithms to perform the following steps: a) generate light source signal to periodically and sequentially turn on and off light of RED and infrared wavelengths; b) reduce artifacts secondary to ambient light effects; and c) calibration based on subject’s skin tone and ambient light.
- RED/infrared wavelength extraction: this task is performed by use of an algorithm that detects start and end time of each reflection pulse, and the amplitude for each pulse represents the reflection intensity for each pulse of RED and infrared wavelength.
- Signal conditioning and preprocessing: this task is performed to denoise, remove motion artifacts, and correct for sensor displacement effects.
- Predictive model to calculate ROPA index: the ROPA index is based on a predictive model to track changes in hemodynamic response (hemoglobin oxygenation) to painful stimuli.
- Data alignment: volunteers were asked to continuously rate their pain on a sliding scale (VAS, see “Subjective pain ratings” section). To align ROPA and VAS time series before applying correlation analysis, we used a moving, double-sided (±20 seconds) window to calculate the local maximum of the ROPA signal. This approach was chosen to decrease potential lag time/hysteresis between reported pain (VAS) and ROPA time series. For laboring women, we only had spotted pain ratings (NRS, see “Subjective pain ratings” section) and therefore the local maximum in a 1-minute time window before and after the NRS rating was determined (see “Data analysis” section). ROPA was calculated offline after data acquisition and with the investigator that was handling the signal processing (AA) being blinded toward any recorded study events in order to minimize potential bias.
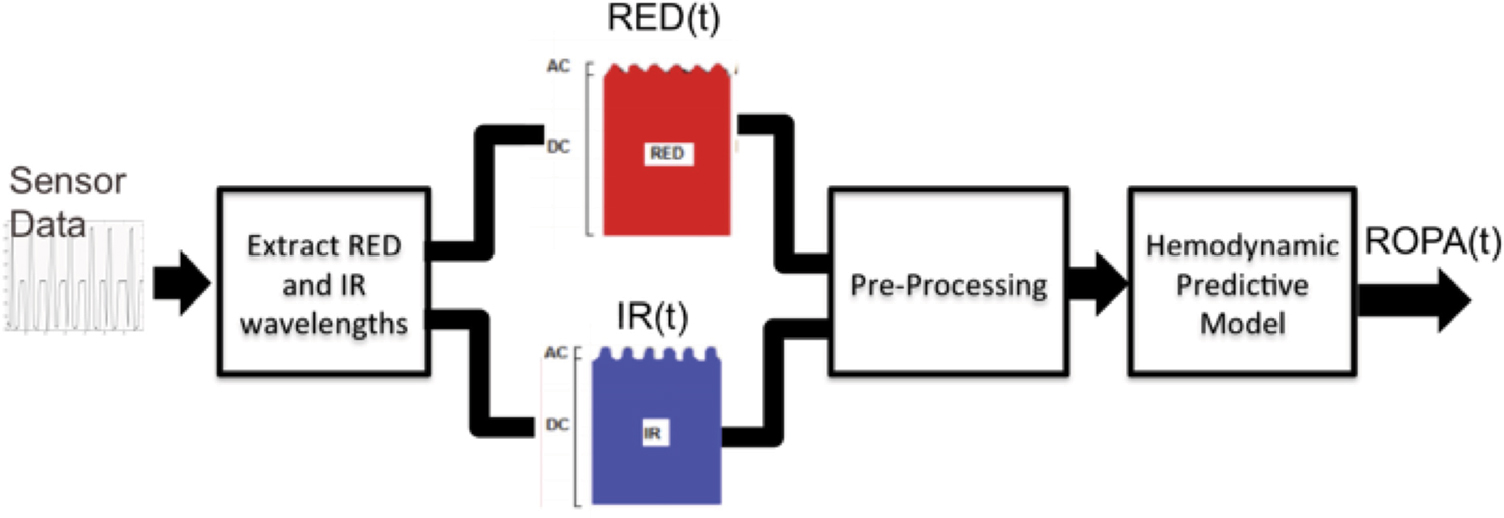 | Figure 1 The pipeline for signal processing applied to calculate ROPA index. Abbreviation: ROPA, real-time objective pain assessment. |
Data analysis
All data are presented as mean ± standard error of the mean unless indicated otherwise. Since severe motion artifacts were expected in the laboring patient population, an investigator blinded to ROPA values and reported NRS pain values reviewed the time course of the ROPA readings (without labeling on the y-axis) in 1-minute windows, 30 seconds prior to 30 seconds after NRS pain rating was obtained, for data quality. If there were concerns regarding data quality secondary to, eg, sensor dislocation, as indicated by gaps of more than 10 seconds within that 1-minute window, the data point was not included for analysis. This approach was also chosen to decrease potential lag time/hysteresis between patient-reported pain and ROPA pain measurements since there was – unlike in the volunteer part of the study – no continuous subjective pain recording.
Power analysis was performed for the patient part of the study. Assuming a correlation of 0.5 with an α of 0.05 and a power of 80%, a sample size of 29 was needed to detect a significant difference. Since we expected to obtain at least six NRS ratings (corresponding to six uterine contractions before onset of analgesic effect secondary to epidural/CSE) per patient with a dropout rate of 25% secondary to movement artifacts, eight laboring women were sufficient to show statistical significance. For the volunteer study, a power analysis was not performed since we were able to obtain one data pair (VAS and corresponding ROPA) every second for an estimated experimental protocol of 20 minutes length, resulting in approximately 1,200 data pairs per volunteer.
All data were tested for normal distribution using the D’Agostino and Pearson omnibus normality test. For both volunteer (both individual and pooled) and laboring patient (pooled only) data, correlations were calculated between subjective pain ratings (ie, VAS or NRS, respectively) and measured ROPA. For normal distributed data Pearson correlation coefficients and for not normally distributed data nonparametric Spearman rank correlations were calculated, respectively.
ROCs and the area under ROC (AUC) were used to determine the performance of the ROPA readings to differentiate between clinically meaningful cut-off values (no/mild–moderate–severe pain) in both volunteers and laboring women:
- No/mild pain vs moderate/severe pain: VAS ≤3 vs VAS >3, or NRS ≤3 vs NRS >3 for laboring women,
- No/mild/moderate pain vs severe pain: VAS ≤6 vs VAS >6, or NRS ≤6 vs NRS >6 for laboring women,
- No/mild pain vs severe pain: VAS ≤3 vs VAS >6 or NRS ≤3 vs NRS >6 for laboring women.
The transformation of NRS/VAS values into three bins (no/mild–moderate–severe) was chosen since it closely corresponds to therapeutic consequences/interventions, ie, administration of analgesics for NRS/VAS values corresponding to moderate pain and (a potentially higher dose of analgesics for) severe pain.
AUCs were classified as follows: good accuracy for AUCs from 70%–79%, very good accuracy for AUCs from 80%–89%, and excellent accuracy for AUCs >90%.
As a measure for overall diagnostic effectiveness, maximum Youden’s index was calculated,
Youden’s index (J) = sensitivity specificity – 1
or,
|

All statistical analyses were done using GraphPad Prism 6 (GraphPad Software, La Jolla, CA, USA) for Mac Computers https://www.graphpad.com/scientific-software/prism/#1. Significance level was set to P<0.05. Power analysis was performed in R (The R Foundation, Vienna, Austria) using the “pwr” package.20
Results
CPT in volunteers
All volunteers completed the CPT. Demographics are shown in Table 1. Mean number of data points obtained per volunteer was 702±123. Maximum VAS ratings during the second round of CPT were not significantly different from the first round (7.62±1.35 vs 7.05±0.97, P=0.08). Spearman rank correlations between cerebral optical spectrometry signal and subjective pain ratings ranged from 0.58 to 0.93 for individual volunteers. For the pooled volunteer data, Spearman rank correlation was 0.88 (95% CI: 0.87–0.89). All correlations were significant at the individual level as well as for the pooled data (P<0.0001 for all). Figure 2 displays the linear regression for the volunteer data (ROPA =0.72× VAS +1.7). ROC analysis for volunteers (Figure 3) displayed excellent accuracies as indicated by AUC values ranging from 91% to 99%.
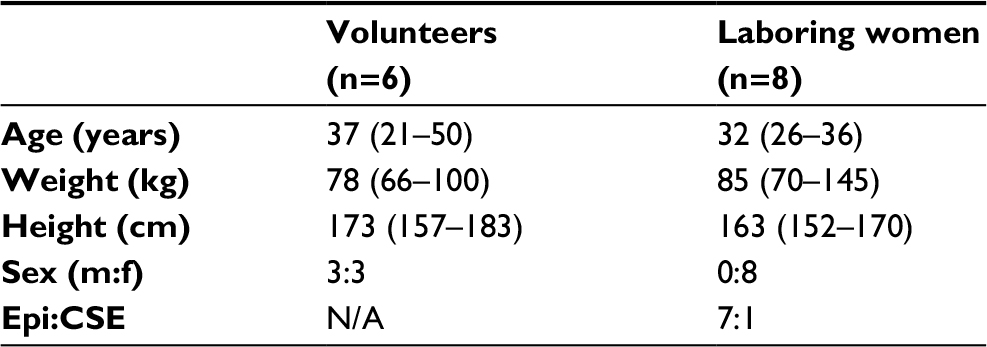 | Table 1 Volunteers’ and laboring women’ demographics Note: Data presented as mean (range). Abbreviations: Epi, epidural; CSE, combined spinal epidural. |
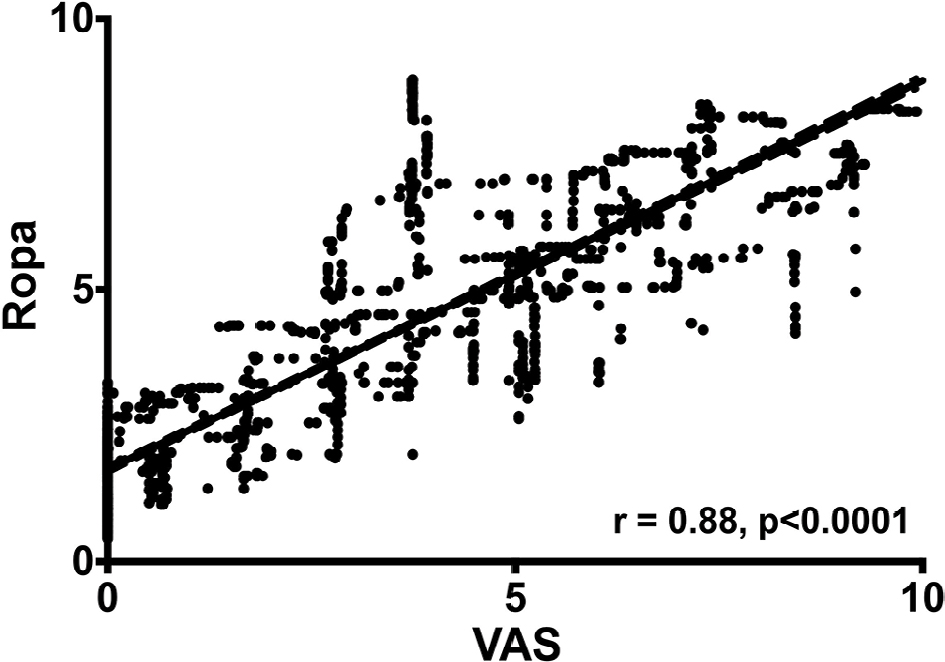 | Figure 2 Linear regression between continuously provided VAS pain ratings (in response to CPT; 0–1,000 with 0= no pain and 1,000 is worse pain imaginable) and objectively measured changes in physiological parameters responding to pain (ROPA) for volunteers. Notes: Correlation (r=0.88, P<0.0001). The (hardly visible) dashed lines indicate the 95% confidence bands. Abbreviations: CPT, cold pressor test; ROPA, real-time objective pain assessment; VAS, visual analog scale. |
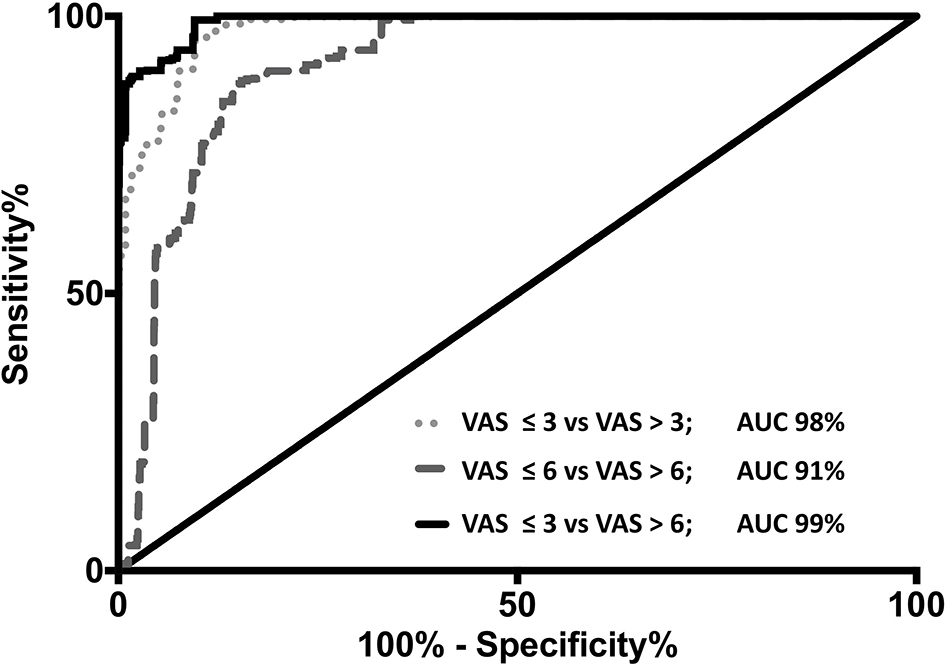 | Figure 3 Cold pressure test in volunteers Notes: ROCs for VAS ≤3 and VAS >3 (dotted, light gray line), VAS ≤6 and VAS >6 (interrupted, dark gray line), and VAS ≤3 and VAS >6 (solid, black line) for the entire time course in volunteers. AUC values, used as a performance indicator, were excellent (AUC >90%). Abbreviations: AUC, area under the ROC curve; ROC, receiver operating characteristic; VAS, visual analog scale. |
Patients
All laboring women completed the study. We obtained 7.6±1.3 NRS pain ratings per patient. Thirty-eight percent (23 of 61) of data points were excluded secondary to (presumably) motion artifacts. Pearson’s correlation coefficient between reported NRS pain ratings and ROPA measurements was 0.44 (95% CI: 0.137–0.665, P=0.006, linear regression: ROPA =0.35× NRS +2.4). Figure 4 displays ROC curves for the laboring women. AUCs were in the good (no/mild pain vs moderate/severe pain), very good (no/mild/moderate pain vs severe pain), or excellent (no/mild pain vs severe pain) and ranged from 72% to 92%.
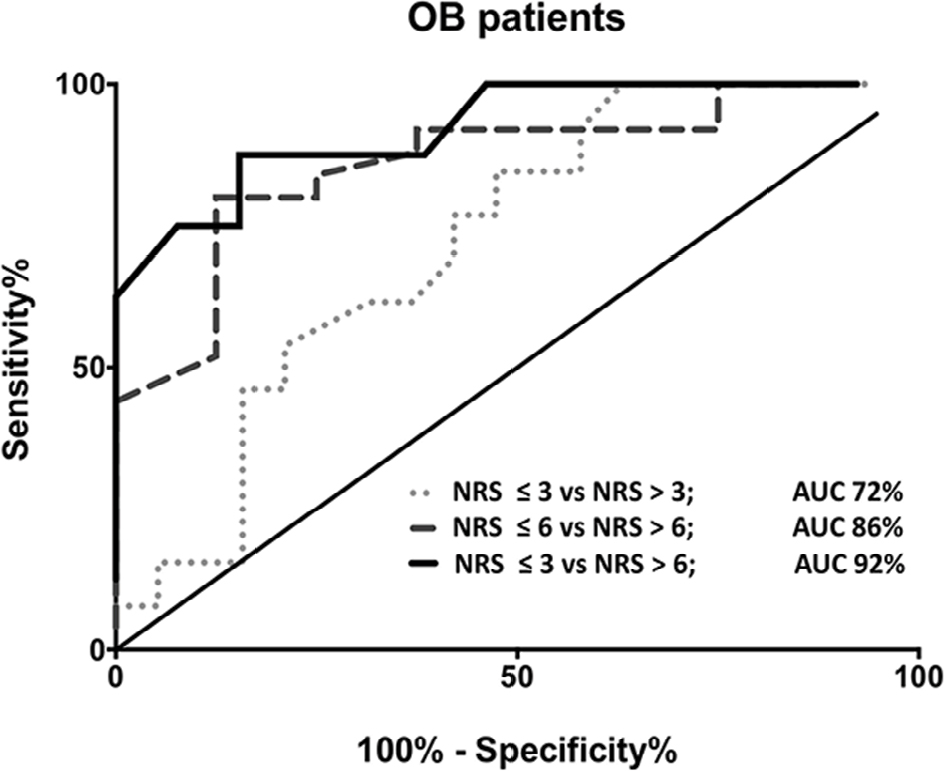 | Figure 4 ROCs for NRS ≤3 and NRS >3 (dotted, light gray line), NRS ≤6 and NRS >6 (interrupted, dark gray line), and NRS ≤3 and NRS >6 (solid, black line) for laboring women. Note: AUC values, used as a performance indicator, were good (AUC 70%–79%), to very good (AUC 80%–89%) ,to excellent (AUC >90%), respectively. Abbreviations: AUC, area under the ROC curve; NRS, numeric rating scale; ROC, receiver operating characteristic. |
Table 2 summarizes maximum sensitivity, maximum specificity, Youden’s indices, and ROPA threshold values for the investigated ROC curves.
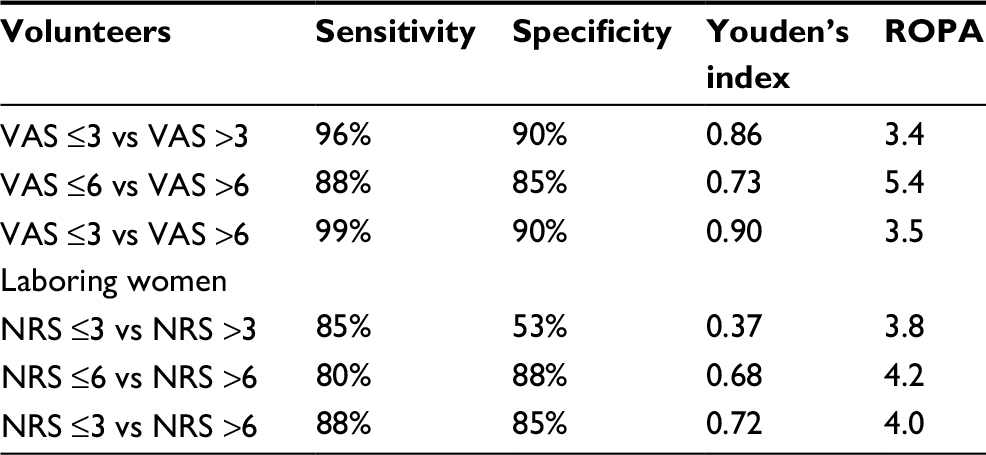 | Table 2 Maximum sensitivity and specificity combinations for volunteers and laboring women, Youden’s index as a measure for diagnostic performance, and ROPA threshold values Notes: Clinically meaningful cut-offs were used: no/mild pain vs moderate/severe pain (VAS ≤3 vs VAS >3 and NRS ≤3 vs NRS >3, respectively), no/mild/moderate pain vs severe pain (VAS ≤6 vs VAS >6 and NRS ≤6 vs NRS >6, respectively), and no/mild pain vs severe pain (VAS ≤3 vs VAS >6 and NRS ≤3 vs NRS >6, respectively). Abbreviations: NRS, numeric rating scale; ROPA, real-time objective pain assessment; VAS, visual analog scale. |
Discussion
This study sought to investigate the correlation between subjectively reported pain and changes in physiological parameters measured with a promising cerebral optical spectrometry technology. Our data indicate significant correlations between VAS pain ratings reported by volunteers undergoing the CPT and the measured pain index ROPA as well as significant correlations between NRS pain ratings obtained from laboring women and the ROPA index. AUC, an indicator for accuracy, were good to excellent in the patient population depending on which distinction was made, ie, for example differentiate between NRS ≤3 vs NRS >3, ie, no/mild pain vs moderate/severe pain. For volunteers, accuracies were excellent regardless of which distinction was investigated.
Pain, the fifth vital sign, is often not adequately evaluated secondary to assessment deficits.21 This lack or inability of accurate assessment of pain potentially leads to mismanagement of pain with a wide variety of possible complication including “chronification” of pain and patient dissatisfaction from inadequate pain management to respiratory depression and constipation from overtreatment of pain. A continuous, easy to interpret, noninvasive device for the assessment of changes in physiological parameters correlating with subjective pain ratings is therefore a highly desirable addition to supplement the intermittent subjective assessments of pain by health care providers. The technology may be particularly valuable when laboring women are confused or unable to communicate (eg, dementia), sedated, or anesthetized (eg, intraoperative or intensive care setting).
Several target technologies have been described for the objective assessment of pain. Heart rate variability-derived indices such as normalized power in the high-frequency band decreasing when a nociceptive stimulus was given under light anesthesia, but remained unchanged when an anesthetized patient received high doses of narcotics.22 A commercially available monitor developed by this group, which calculates the heart rate variability-based “analgesia nociception index” (www.mdoloris.com/en/technologies/ani-analgesia-nociception-index/), was used to predict NRS pain ratings in the immediate postoperative period, ie, upon arrival in the recovery room. Performance of the monitor was good and the AUC was 89% for discriminating between an NRS of <3/10 and >3/10.23 In nonanesthetized volunteers exposed to expected and unexpected painful electrical stimulation however, ANI did not correlate with volunteers’ pain ratings and did not allow for differentiation between painful vs nonpainful stimuli.24
Ledowski et al25 used skin conductance to measure pain objectively in laboring women that had undergone minor elective plastic or orthopedic surgery during their stay in the recovery room. In their study, the AUC using the number of skin fluctuations per second to differentiate between a pain rating of <3/10 and >3/10 was 76%. This is comparable to our results of 72% for laboring women, but substantially lower than the 98% obtained in the volunteer population in our study.
Ben-Israel et al26 also reported ROC and AUC for detecting noxious events using several physiologic variables as well as their proprietary composite algorithm to differentiate between nonpainful and painful stimuli in anesthetized laboring women. AUCs ranged from 56% (skin conductance level only) to 98% for the combined index of stimulus and analgesia (CISA). The CISA used by this group is a reference clinical score that combines stimulus intensity (as rated by anesthesiologists) and narcotic effect site concentration in order to make assumptions for the level of nociception. Their proprietary, multiparameter nociception level (NoL) achieved similar performance to the CISA and outperformed all single physiologic variables included in their study (skin conductance level, number of skin conductance fluctuations, change of heart rate, change in high-frequency band of heart rate variability, photo-plethysmographic waveform amplitude). This group did not include an Optical Spectrometry-based signal. It is interesting to note that the Optical Spectrometry-derived ROPA index used in our study outperformed all of the single physiologic variables studied by Ben-Israel et al.26 However, this group chose to test for differentiation between nonnoxious and noxious stimuli in anesthetized laboring women, whereas we tested for distinction between severities of pain (mild–moderat severe) in awake laboring women and volunteers.
Aasted et al27 recently published a study in which they used Optical Spectrometry to study activation and deactivation in the frontal lobe during noxious stimulation. This group chose the forehead for two reasons: 1) it is easily accessible and allows for probe placement, and 2) functional MRI studies have shown that the frontal lobe is activated during noxious stimulation. Data from seven volunteers undergoing painful electrical stimulation showed that the change in oxygenated hemoglobin concentration over the superior frontal cortices correlates with pain perception. The same group had previously investigated correlations between blood oxygen level-dependent functional MRI signals and Optical Spectrometry signals in volunteers undergoing painful stimulation. Since correlations were high, they concluded that Optical Spectrometry could be capable of identifying pain sensations in (anesthetized) laboring women and provide a useful tool for evaluating the efficacy of analgesics.14
Another Optical Spectrometry approach to assess pain was investigated by Rojas et al28 who used a 24-channel setup to collect data from the primary somatosensory area of 18 subjects after induction of heat and cold pain.28 Obtained data were processed by machine learning techniques. The results of this study demonstrate the possibility to distinguish between different types of pain and their pain intensity. For example, the sensitivity and specificity to detect maximum cold pain were reported as 94.64% and 92.98% in this study.
Overall, an extensive Optical Spectrometry data processing and the use of a predictive model seem to be essential for proper pain assessment. Meyer-Frießem et al29 could not show strong correlation between unprocessed cerebral oxygenation (SctO2) values from the frontal lobe and reported NRS in twenty subjects after application of electrical pain.
Limitations
One limitation of our study was the exclusion of chronic pain laboring women. Therefore, we could not make any assumptions on whether chronic pain states would affect measurements by means of cerebral optical spectrometry. In addition, we have not investigated the performance of ROPA in anesthetized laboring women, and studies to evaluate this population are currently ongoing. Since anesthetized laboring women cannot give feedback, an objective pain assessment would be desirable to guide clinical management. Potential benefits of a bedside real-time objective pain assessment include decreased wake-up times, higher patient satisfaction, and decreased incidence of complication secondary to both under- and overdosing of opioids. However, all these potential benefits are yet to be determined. Similar to the introduction of electroencephalogram monitors to measure level of hypnosis and tailor anesthetic dosing to individual needs, an objective, noninvasive assessment tool for pain may be a useful adjunct to the monitoring to help guide clinicians and clinical researchers.
Conclusion
This study was able to show a good correlation between the Cerebral Optical Spectrometry-based ROPA and pain ratings reported by volunteers and laboring women. Nevertheless, further investigations have to prove if there is a real and robust linkage between both values. Until then, whether ROPA can be speculated as a useful monitor for clinical applications to assess direct pain is not available.
Acknowledgment
This study was supported by the National Science Foundation (31548528) to AA.
Author contributions
AE was involved in study design, data acquisition, data analysis, drafting and revising the manuscript, and final approval. NA assisted in data acquisition, revising the manuscript, and final approval. BCo helped with data acquisition, revising the manuscript, and final approval. AA was involved in study design, data acquisition, data analysis, revising the manuscript, and final approval. BCa assisted in study design, data analysis, revising the manuscript, and final approval. DCY aided in study design, data analysis, revising the manuscript, and final approval. AZT was involved in study design, data acquisition, data analysis, drafting and revising the manuscript, supervision, and final approval. All authors contributed toward data analysis, drafting and critically revising the paper and agree to be accountable for all aspects of the work.
Disclosure
BCa, DCY, and AZT are uncompensated consultants to ROPAmedics LLC. AA is the founder, Chief Technology Officer (CTO), and shareholder of ROPAmedics LLC. The authors report no other conflicts of interest in this work.
References
Breivik H, Borchgrevink PC, Allen SM, et al. Assessment of pain. Br J Anaesth. 2008;101(1):17–24. | ||
Cowen R, Stasiowska MK, Laycock H, Bantel C. Assessing pain objectively: the use of physiological markers. Anaesthesia. 2015;70(7):828–847. | ||
Lichtner V, Dowding D, Allcock N, et al. The assessment and management of pain in patients with dementia in hospital settings: a multi-case exploratory study from a decision making perspective. BMC Health Serv Res. 2016;16(1):427. | ||
Flaherty SA. Pain measurement tools for clinical practice and research. Aana J. 1996;64(2):133–140. | ||
Jensen MP, Chen C, Brugger AM. Postsurgical pain outcome assessment. Pain. 2002;99(1-2):101–109. | ||
Brouse CJ, Karlen W, Dumont GA, et al. Monitoring nociception during general anesthesia with cardiorespiratory coherence. J Clin Monit Comput. 2013;27(5):551–560. | ||
Cain KC, Jarrett ME, Burr RL, Hertig VL, Heitkemper MM. Heart rate variability is related to pain severity and predominant bowel pattern in women with irritable bowel syndrome. Neurogastroenterol Motil. 2007;19(2):110–118. | ||
Sesay M, Robin G, Tauzin-Fin P, et al. Responses of Heart Rate Variability to Acute Pain After Minor Spinal Surgery. J Neurosurg Anesthesiol. 2015;27(2):148–154. | ||
Logier R, Jeanne M, Tavernier B, de Jonckheere J. Pain/analgesia evaluation using heart rate variability analysis. Conf Proc IEEE Eng Med Biol Soc. 2006;1:4303–4306. | ||
Ellerkmann RK, Grass A, Hoeft A, Soehle M. The response of the composite variability index to a standardized noxious stimulus during propofol-remifentanil anesthesia. Anesth Analg. 2013;116(3):580–588. | ||
Aissou M, Snauwaert A, Dupuis C, Atchabahian A, Aubrun F, Beaussier M. Objective assessment of the immediate postoperative analgesia using pupillary reflex measurement: a prospective and observational study. Anesthesiology. 2012;116(5):1006–1012. | ||
Storm H. Changes in skin conductance as a tool to monitor nociceptive stimulation and pain. Curr Opin Anaesthesiol. 2008;21(6):796–804. | ||
Tu Y, Tan A, Bai Y, Hung YS, Zhang Z. Decoding Subjective Intensity of Nociceptive Pain from Pre-stimulus and Post-stimulus Brain Activities. Front Comput Neurosci. 2016;10:32. | ||
Aasted C, Yucel M, Petkov M, Borsook D, Boas D, Becerra L. (322) Detecting brain activity related to pain using near-infrared spectroscopy. J Pain. 2014;15(4):S56. | ||
Strangman G, Culver JP, Thompson JH, Boas DA. A quantitative comparison of simultaneous BOLD fMRI and NIRS recordings during functional brain activation. Neuroimage. 2002;17(2):719–731. | ||
Hartley C, Slater R. Neurophysiological measures of nociceptive brain activity in the newborn infant--the next steps. Acta Paediatr. 2014;103(3):238–242. | ||
Hilly J, Pailleret C, Fromentin M, et al. Use of near-infrared spectroscopy in predicting response to intravenous fluid load in anaesthetized infants. Anaesth Crit Care Pain Med. 2015;34(5):265–270. | ||
Youden WJ. Index for rating diagnostic tests. Cancer. 1950;3(1):32–35. | ||
Šimundić AM. Measures of Diagnostic Accuracy: Basic Definitions. EJIFCC. 2009;19(4):203–211. | ||
R Core Team. R: A Language and Environment for Statistical Computing. Vienna, Austria: R Foundation for Statistical Computing; 2013. | ||
Morone NE, Weiner DK. Pain as the fifth vital sign: exposing the vital need for pain education. Clin Ther. 2013;35(11):1728–1732. | ||
Jeanne M, Logier R, de Jonckheere J, Tavernier B. Heart rate variability during total intravenous anesthesia: effects of nociception and analgesia. Auton Neurosci. 2009;147(1-2):91–96. | ||
Boselli E, Bouvet L, Bégou G, et al. Prediction of immediate postoperative pain using the analgesia/nociception index: a prospective observational study. Br J Anaesth. 2014;112(4):715–721. | ||
Jess G, Pogatzki-Zahn EM, Zahn PK, Meyer-Frießem CH. Monitoring heart rate variability to assess experimentally induced pain using the analgesia nociception index: A randomised volunteer study. Eur J Anaesthesiol. 2016;33(2):118–125. | ||
Ledowski T, Bromilow J, Wu J, Paech MJ, Storm H, Schug SA. The assessment of postoperative pain by monitoring skin conductance: results of a prospective study. Anaesthesia. 2007;62(10):989–993. | ||
Ben-Israel N, Kliger M, Zuckerman G, Katz Y, Edry R. Monitoring the nociception level: a multi-parameter approach. J Clin Monit Comput. 2013;27(6):659–668. | ||
Aasted CM, Yücel MA, Steele SC, et al. Frontal Lobe Hemodynamic Responses to Painful Stimulation: A Potential Brain Marker of Nociception. PLoS One. 2016;11(11):e0165226. | ||
Rojas RF, Huang X, Romero J, Ou KL. fNIRS Approach to Pain Assessment for Non-verbal Patients. Neural Information Processing: 24th International Conference, ICONIP 2017, Guangzhou, China, November 14–18, 2017, Proceedings, Part IV. Liu D, Xie S, Li Y, Zhao D, El-Alfy E-SM, editors. Cham, Switzerland: Springer International Publishing; 2017:778–787. | ||
Meyer-Frießem CH, Jess G, Pogatzki-Zahn EM, Zahn PK. Cerebral oxygenation for pain monitoring in adults is ineffective: A sequence-randomized, sham controlled study in volunteers. Scand J Pain. 2017;16:129–135. |
 © 2018 The Author(s). This work is published and licensed by Dove Medical Press Limited. The
full terms of this license are available at https://www.dovepress.com/terms
and incorporate the Creative Commons Attribution
- Non Commercial (unported, 3.0) License.
By accessing the work you hereby accept the Terms. Non-commercial uses of the work are permitted
without any further permission from Dove Medical Press Limited, provided the work is properly
attributed. For permission for commercial use of this work, please see paragraphs 4.2 and 5 of our Terms.
© 2018 The Author(s). This work is published and licensed by Dove Medical Press Limited. The
full terms of this license are available at https://www.dovepress.com/terms
and incorporate the Creative Commons Attribution
- Non Commercial (unported, 3.0) License.
By accessing the work you hereby accept the Terms. Non-commercial uses of the work are permitted
without any further permission from Dove Medical Press Limited, provided the work is properly
attributed. For permission for commercial use of this work, please see paragraphs 4.2 and 5 of our Terms.