Back to Journals » Cancer Management and Research » Volume 11
Correlation of body composition by computerized tomography and metabolic parameters with survival of nivolumab-treated lung cancer patients
Authors Magri V, Gottfried T, Di Segni M ![]() , Urban D
, Urban D ![]() , Peled M, Daher S, Stoff R, Bar J
, Peled M, Daher S, Stoff R, Bar J ![]() , Onn A
, Onn A ![]()
Received 2 April 2019
Accepted for publication 8 August 2019
Published 5 September 2019 Volume 2019:11 Pages 8201—8207
DOI https://doi.org/10.2147/CMAR.S210958
Checked for plagiarism Yes
Review by Single anonymous peer review
Peer reviewer comments 3
Editor who approved publication: Dr Kenan Onel
Valentina Magri1,*, Teodor Gottfried2,*, Mattia Di Segni3,4, Damien Urban2, Michael Peled5, Sameh Daher2, Ronen Stoff2, Jair Bar2,6,*, Amir Onn5,6,*
1Dipartimento di Scienze Radiologiche, Oncologiche ed Anatomo-Patologiche, Umberto I, Policlinico di Roma, Sapienza, - Università di Roma, Rome, Italy; 2Thoracic Oncology Unit, Institute of Oncology, Sheba Medical Center, Ramat Gan 5262000, Israel; 3Dipartimento di Scienze Radiologiche, Oncologiche ed Anatomo-Patologiche, Sapienza, Umberto I, Policlinico di Roma - Università di Roma, Rome, Italy; 4U.O.C. Diagnostica per Immagini, Presidio Ospedaliero San Paolo, Rome, Italy; 5Institute of Pulmonology, Sheba Medical Center, Ramat Gan 5262000, Israel; 6Sackler Faculty of Medicine, Tel Aviv University, Tel Aviv 69978, Israel
*These authors contributed equally to this work
Correspondence: Michael Peled
Institute of Pulmonology, Sheba Medical Center, HaShomer, Ramat Gan 5262000, Israel
Tel +972 3 530 8420
Fax +972 3 530 8420
Email [email protected]
Purpose: Weight loss is a well-recognized prognostic parameter for survival of lung cancer patients. Computerized-tomography (CT)-based analysis of body composition and blood-based metabolic evaluation are promising prognostic tools. We aimed to assess the correlation between albumin, body mass index (BMI), skeletal muscle mass index (SMI), fat-free mass index (FFMI), fat mass index (FMI) and weight change, as well as their correlation with survival of lung cancer patients on nivolumab treatment.
Methods: Data were retrospectively collected. Weight was measured at a diagnosis of stage 4 disease and before start of nivolumab. Albumin levels were measured before starting nivolumab. BMI, SMI, FFMI, and FMI were evaluated from CT scans performed at start of nivolumab. Overall survival (OS) was from starting of nivolumab to death or censured at last follow-up. Statistical analysis was done to identify correlation between the various factors and between those factors and survival.
Results: Forty-six patients with advanced non-small cell lung cancer (NSCLC) were included. Median follow-up was 22 months. Pathology was Adenocarcinoma/Squamous/non-other specified in 25/15/6 respectively. All patients received nivolumab as an advanced-line treatment for stage IV NSCLC. We observed a significant correlation of weight loss (P=0.01, HR=2.85) and albumin (P=0.043, HR=0.34) with OS in multivariate analysis. A significant correlation was found between BMI to SMI, FFMI, FMI, and weight change.
Conclusion: Weight loss and low albumin levels are significant negative prognostic factors for NSCLC patients on immunotherapy. CT-based parameters of body composition remain to be proven as more reliable than standard clinical parameters.
Keywords: BMI, albumin, immunotherapy, weight, prognosis
Introduction
Both a common para-neoplastic syndrome as well as an important prognostic biomarker for all cancer types is weight loss, or cachexia. An international consensus published by Fearon et al1,2 has classified cachexia as a syndrome with three stages depending on patients’ weight loss, body mass index (BMI), and muscle loss as measured by skeletal muscle index (sarcopenia). Recent studies showed that quantified muscle mass loss indexes (sarcopenia markers) such as fat-free mass index (FFMI), fat mass index (FMI), and skeletal mass index (SMI), calculated using computerized tomography (CT), might serve as prognostic factors for cancer patients. Specific populations studies include early stage non-small cell lung cancer (NSCLC) patients,3 small cell lung cancer (SCLC) patients,4 and esophageal cancer patients.5 Some data suggest sarcopenia to be a predictor of significant treatment toxicity,6 including a report of overweight sarcopenia association with early limiting toxicity from immunotherapy in melanoma patients.7
Lung cancer is one of the leading causes of death worldwide with approximately 1.9 million patients diagnosed in 2012 and an estimated 1.6 million deaths.8 In the United States, approximately 225,000 new cases of lung cancer and over 160,000 deaths occur annually.9 NSCLC accounts for about 80% of all lung cancer cases.
In recent years, immunotherapy has been recognized as a new pillar in cancer treatment. The major tool of this class is immune checkpoint inhibitor, mostly anti-PD-1 or anti-PD-L1 antibodies. These drugs remove the inhibition of T cells and unleash their potential for cancer cell eradication.10 For NSCLC, immunotherapy with PD-1 antibodies has become the optimal first-line treatment for patients whose tissue samples demonstrate a high level of programmed death ligand 1 (PD-L1) expression.11 NSCLC patients whose tumors express lower levels of PD-L1 expression are treated with immunotherapy at a more advanced line (second or later lines).12–14 Although a very promising tool, the majority of lung cancer patients do not respond to these drugs. Thus, combinatorial treatments are being tested in clinical trials. Indeed, a combination of chemotherapy with immunotherapy given as first line to non-squamous NSCLC might become the next standard of care.15
Aiming to optimize treatments for this deadly disease, attempts are ongoing to find predictive markers for response to immunotherapy among NSCLC patients. The most studied marker thus far is the expression of PD-L1 in the tumor cells,12,13 with some studies incorporating also PD-L1 expression in the immune infiltrating cells.14 Tumor mutation burden is a promising tool to predict responses to immunotherapy16 and trials are ongoing to test this tool in a prospective manner. Additional approaches include analysis of gene expression patterns,17,18 serum proteomics,19 and the gut microbiome composition.20
We wanted to evaluate the correlation of CT-based sarcopenia parameters with simpler tools such as weight loss, BMI, and serum albumin levels. The goal of this study is to assess the correlation between the various parameters of cachexia (quantified by CT, BMI, or serum albumin), and to evaluate their prognostic value in advanced NSCLC patients receiving immunotherapy.
Materials and methods
Patients and clinical data
Patients with NSCLC treated with nivolumab immunotherapy in the Sheba Medical Center during the years 2015–2016 were retrospectively identified. Included patients received nivolumab as advanced-line treatment, starting between 1st January 2015 and 31st December 2016. Nivolumab was administered as part of an Extended Access Program (EAP). Sex, histology, smoking status, performance status (PS), weight, and blood test results were retrieved retrospectively from patient’s medical charts. PS was graded by the Eastern Cooperative Oncology Group Scale (0–3).21 Pathology was recorded as adenocarcinoma, NSCLC favor adenocarcinoma (categorized together as adenocarcinoma for statistical analysis), squamous cell carcinoma, NSCLC favor squamous cell carcinoma (categorized together as squamous cell carcinoma in the final analysis), NSCLC, large cell undifferentiated, and large cell neuroendocrine (NE). All cases not categorized as adenocarcinoma or squamous cell carcinoma were categorized as NSCLC-non-other specified (NOS) in the final statistical analysis. Smoking status was categorized to never smoking (or not more than 100 cigarettes in life), stopped smoking more than 10 years ago, stopped smoking from 1 year to 10 years, or smoking now (or stopped less than 1 year).
Image analysis
All patients underwent a baseline computerized tomography (CT) or positron-emission-tomography (PET)-CT imaging close to the initiation of nivolumab immunotherapy. Baseline scan was defined as performed either prior to starting immunotherapy and not earlier than 10 weeks before first nivolumab treatment, with no intervening treatment administered between the baseline scan and first nivolumab treatment, or within 2 months after initiating nivolumab immunotherapy. For calculation of sarcopenia markers, a single slice on the level of L3 vertebrae with both transverse processes visible was selected. Specific tissue demarcation was performed on the image of this slice using the following Hounsfield units (HU) thresholds: −29 to +150 (skeletal muscle excluding visceral organs); −190 to −30 (subcutaneous and intramuscular adipose tissue); and −150 to −50 (visceral adipose tissue). The cross-sectional area of total skeletal muscle (TMA) and total fat tissue (subcutaneous and visceral adipose tissue) were assessed. Most of the patients included in the study were assessed independently by a second reader. Total fat-free mass (FFM) and fat mass (FM) were calculated as follows:

Both parameters were then corrected to individual patients’ height using the following calculations:
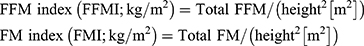
For the assessment of sarcopenia, we calculated the skeletal muscle index (SMI) by dividing TMA at L3 with the height squared, similarly to the calculations for FFM and FM: 
Metabolic parameters
Serum albumin levels were retrieved from clinical charts. Baseline parameters were defined as results closest to, preferably prior to, starting nivolumab immunotherapy. Baseline was further defined as not more than 5 weeks before starting treatment and no later than 2 weeks after initiating nivolumab treatment. Weight change from prior to any therapy given for advanced disease to the weight before receiving first nivolumab was evaluated. Weight change was calculated as percentage from the weight prior to any therapy for advanced disease.
Statistical analysis
OS was defined from the start of nivolumab immunotherapy until death or censured at last follow-up. All variables are depicted as median and a 95% confidence interval (CI) or median and range as appropriate. Correlation between metabolic parameters was assessed by Pearson chi-square tests as continuous values. Survival curves were constructed for each factor of interest by Kaplan–Meier method. Cox proportional hazards regression model was performed for each of the factors of interest as univariate analysis, followed by a model combining all factors of interest. Hazard ratios (HRs) with 95% CIs are reported. Statistical analysis was performed by SPSS version 25.
Ethics
This study was approved by the Institute Medical Ethics Committee of the Sheba Medical Center and was conducted in accordance with the ethical principles of the Declaration of Helsinki. The requirement for informed consent was waived by the Institute Medical Ethics Committee because of the retrospective nature of this study, but patient confidentiality was protected.
Results
Data were retrospectively collected regarding 46 advanced NSCLC patients that have received nivolumab immunotherapy for their disease (Table 1). All of the patients received previous systemic non-immunotherapy regimens. Median overall survival from immunotherapy start was 6.89 months (95% CI 5.08–8.70). At data cut off, 15 patients (32.61%) were still alive.
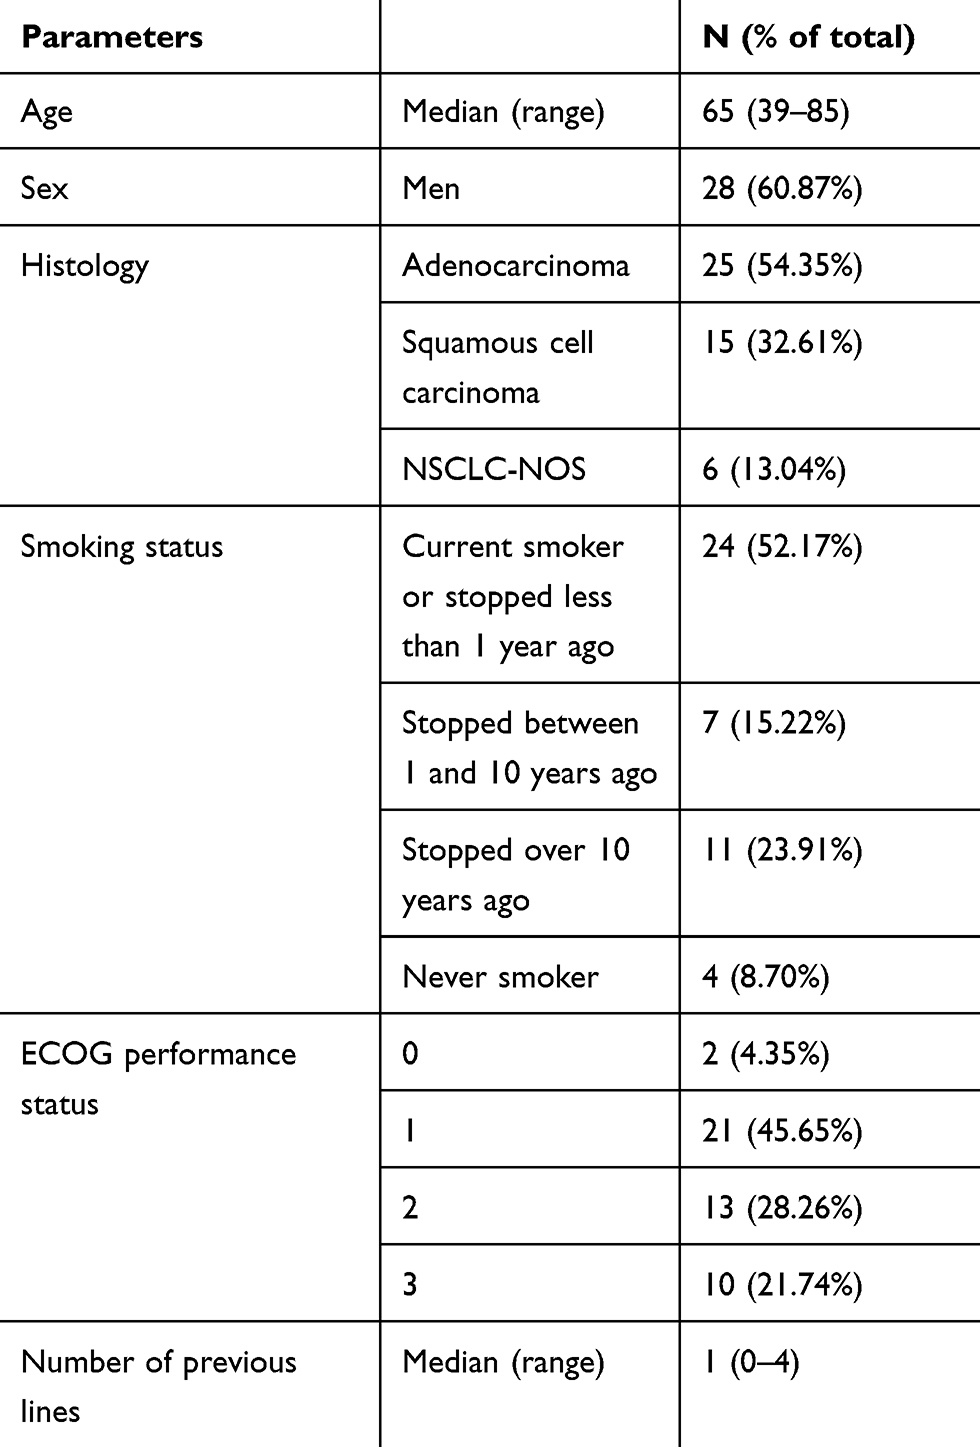 |
Table 1 Patients’ clinical characteristics |
Metabolic parameters derived from the CT scans and blood test results are presented in Table 2 along with BMI and weight change. Inter-observer agreement for the CT-based parameters was assessed for a subset of patients (N=30) whose scans were analyzed independently by two readers. R-squared for SMI, FFMI, and FMI was 0.88, 0.88, and 0.99, respectively (data not shown).
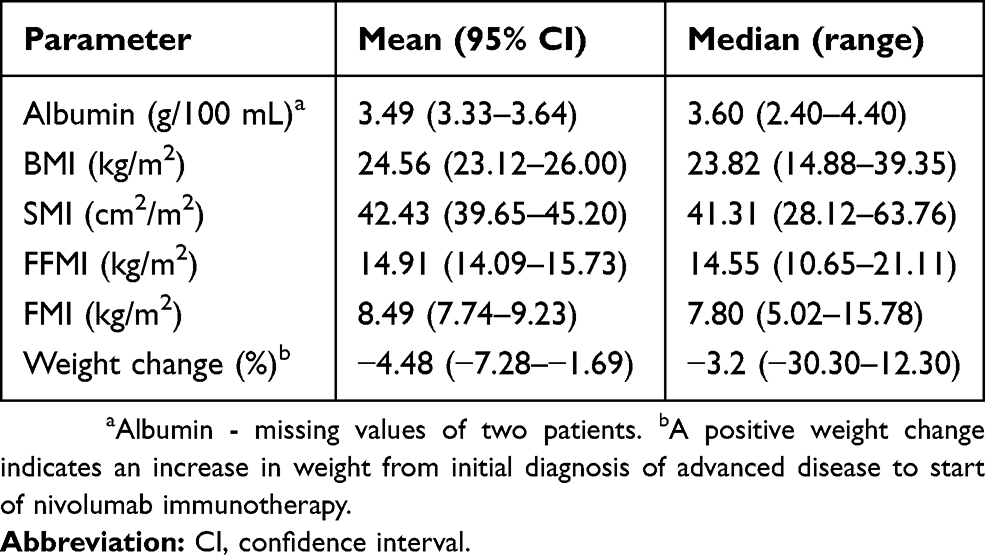 |
Table 2 Metabolic parameters |
We wanted to assess whether the CT-based parameters of sarcopenia reflect the commonly used and easier-to-produce albumin serum levels and BMI. The correlation between baseline serum albumin and BMI to SMI, FFMI, and FMI was evaluated. Parameters as continuous values were utilized for this analysis. Pearson analysis (Table 3) shows statistically significant correlation (defined as P-value less than 0.05, 2-tailed) between BMI to SMI, FFMI, FMI, and weight change. In addition, a strong correlation was found between SMI and FFMI. The strongest correlation seen was between BMI and FMI. No significant correlation was found between albumin levels and other metabolic parameters.
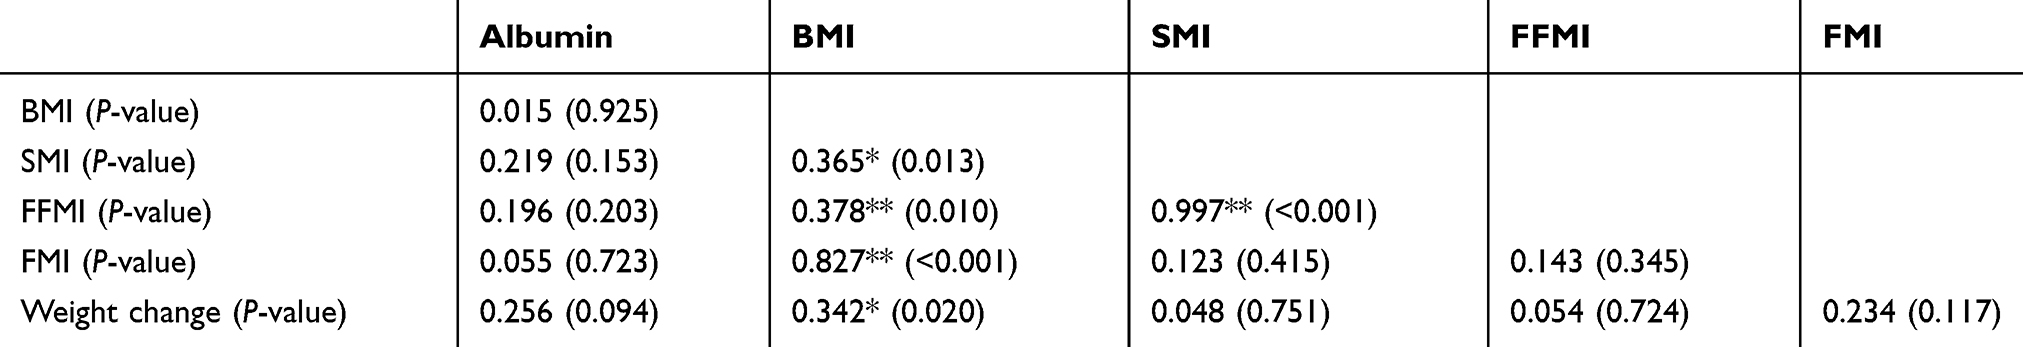 |
Table 3 Correlations between metabolic parameters (Pearson correlation coefficient) |
Cox regression analysis was performed for each of the six metabolic parameters as well as age, sex, PS, number of previous treatment lines, smoking status, and histology. In univariate analysis, only PS, albumin, and weight change were found to be statistically significantly correlated with OS (Table S1, Figures 1, 2, and S1). Including all these parameters in a multivariate cox regression model, only weight change (P=0.001, HR=0.35 (0.12–0.97)) and albumin (P=0.04, HR=0.35 (0.18–0.66)) retained a significant correlation with OS (Table 4), while only weight change retained a significant correlation with OS if the parameters were analyzed according to the cutoffs used in the Kaplan–Meier curves (Table S2). All other metabolic parameters were not significantly correlated with OS in this multivariate analysis.
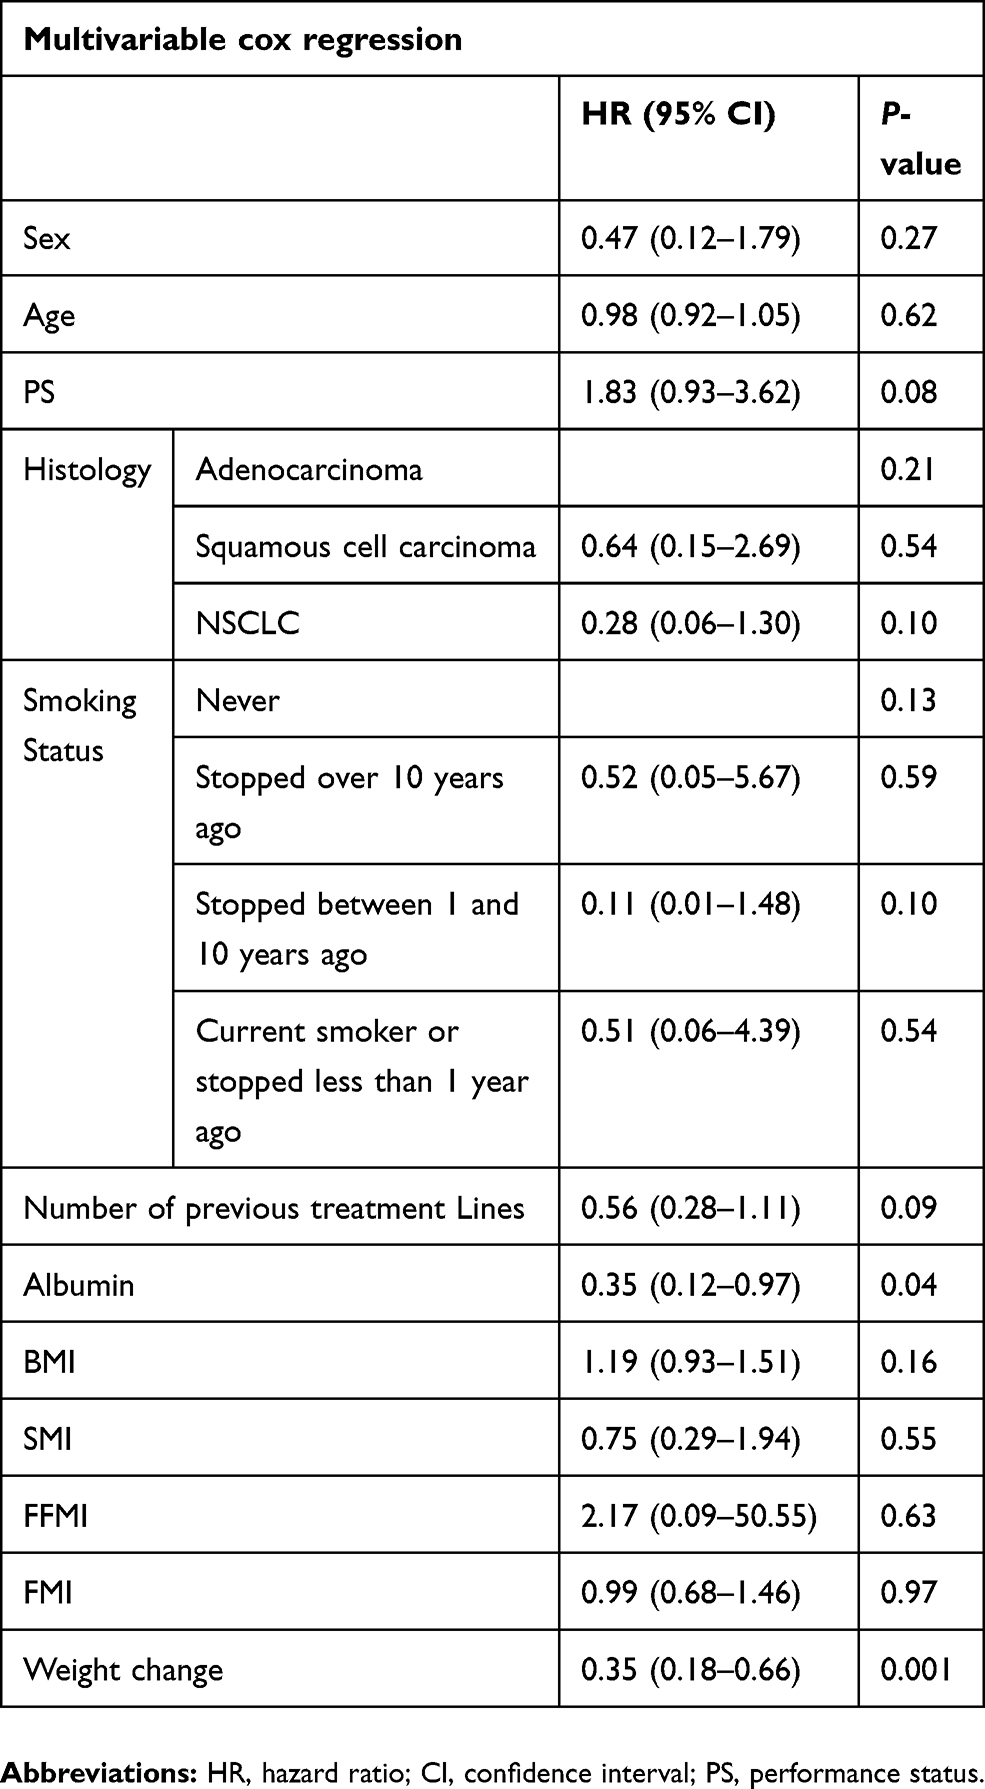 |
Table 4 Multivariate analysis of parameters |
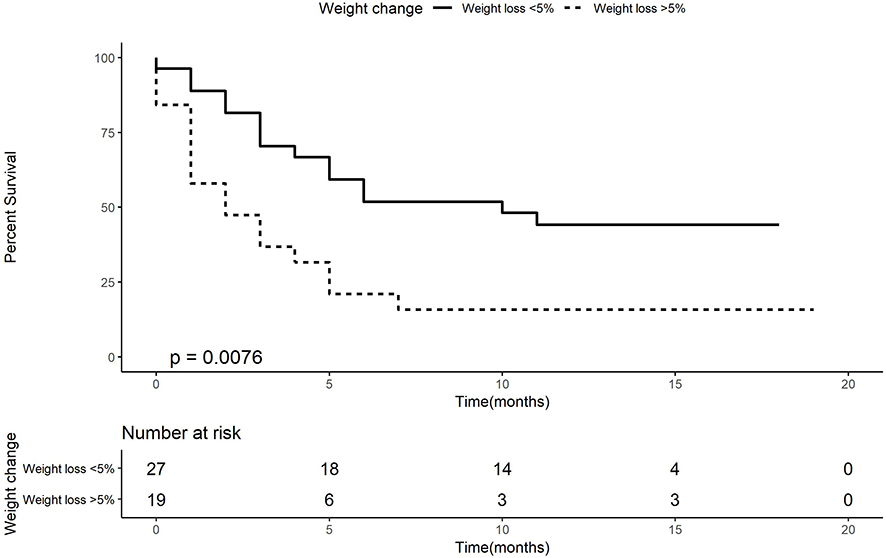 |
Figure 1 Kaplan–Meier curve for overall survival according to weight change. |
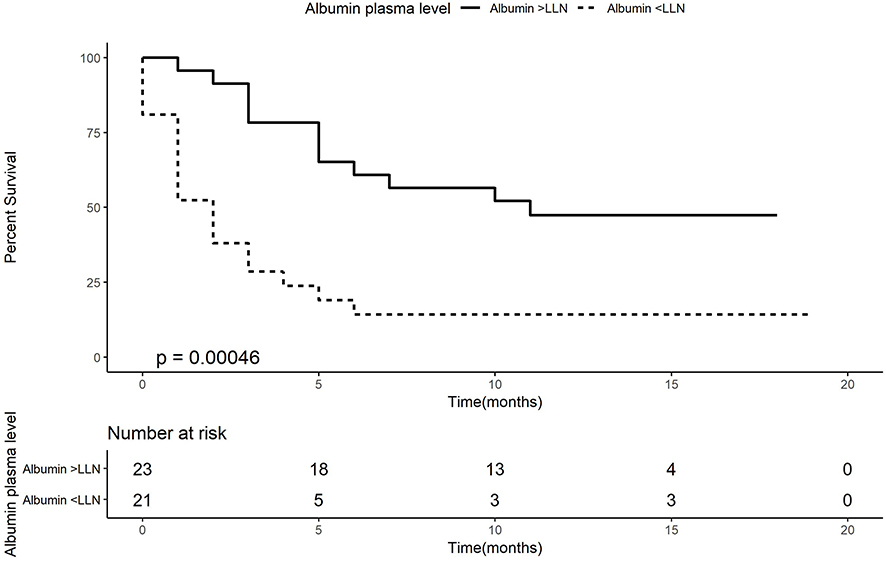 |
Figure 2 Kaplan–Meier curve of overall survival according to albumin plasma levels. Abbreviation: LLN, lower limit of the norm. |
Kaplan–Meier analysis demonstrates that patients with weight loss of more than 5% had a worse OS (median OS of 2 months, 95% CI 0–4.13, log-rank P-value=0.008) than patients who lost less than 5% or with weight gain (median OS of 10 months, 95% CI 2.52–17.48, HR of 2.45, Figure 1). Kaplan–Meier analysis for albumin (Figure 2) demonstrates that patients with an albumin levels below the lower limit of the norm had a worse OS (median OS of 2 months, 95% CI 1.03–2.97, log-rank, P-value=0.013) than patients with an albumin level higher than the lower limit of the norm (median OS of 11 months, 95% CI could not be estimated as there were not enough events to calculate standard error, HR of 3.33, Figure 2).
Discussion
Weight loss has been recognized as a robust prognostic factor for cancer patients in general22 and particularly for lung cancer. Albumin serum levels are also well validated as prognostic for a variety of conditions including lung cancer.23 In this study, we compared these simple parameters with more complex, and presumably more accurate, measures of sarcopenia, namely CT-derived measurements of muscle mass and fat mass. Surprisingly, the only parameters found to correlate with OS in multivariate analysis were weight loss and albumin levels. CT-derived parameters were found to correlate partly with BMI, but not with albumin, nor with weight loss. Our results suggest CT-based parameters to be less clinically relevant than simple, medical history-based assessment of weight loss, and a simple blood test for albumin levels. Conversely, Shiroyama et al24 showed better response rate and improved PFS in patients with no sarcopenia at CT. However, both the employed end-points and the parameters used to calculate the lean mass are different: Shiroyama et al assessed PFS and response rate, whereas we assessed OS; for lean mass assessment, Shiroyama et al used Psoas Muscle Index, whereas we used the Total Fat Free Mass Index - estimated not only with Psoas Muscle Area. Of note, at the moment, there is no consensus about the best CT parameter for the assessment of lean mass.
Weight loss as a prognostic parameter has been mostly regarded at the time point of diagnosis, referring to the weight change during the period of several months prior to diagnosis. Since our cohort included almost entirely 2nd or higher line treated patients, we utilized weight change between initial diagnosis of advanced disease to the start of nivolumab immunotherapy as the relevant change, in most cases covering the period of first-line therapy for advanced disease. To the best of our knowledge, our study is the first to regard weight change during the first (or more) and to find it harbors prognostic value for patients starting second or higher treatment line. Of note, treatment line did not significantly impact weight change or OS. Not commonly utilized in clinical trials of patients’ treatment in advanced lines, our study suggests that weight loss during previous treatment line should be regarded as an important clinical prognostic tool.
Considering the study population, our study has important potential implications for patients on immunotherapy. Weight loss and albumin were found to be prognostic, while PS and BMI did not prove to be valuable in this small cohort. Immunotherapy trials usually define inclusion criteria based on PS, sometimes by BMI measures, but do not include weight change during previous treatment lines. Activation of the immune system against the cancer cells might depend on a good nutritional status among other biological parameters. Additional and larger studies should investigate the role of nutritional status, and specifically previous weight change, on responsiveness to immunotherapy.
Our study has several obvious limitations. Most significant of those is the small cohort included. However, this is a relatively uniform group of patients in term of diagnosis (NSCLC), stage (4), and treatment (nivolumab immunotherapy). Despite the small sample size, weight loss and albumin levels were found to correlate significantly with survival, while CT-based parameters did not correlate with OS. Another limitation of the study is its retrospective nature. While all parameters included in the study were based on clear clinical record documentation, potential biases in data recording cannot be excluded. However, despite these limitations, this study demonstrates potentially important results, pointing to weight change during previous treatment lines, as well as serum albumin, as prognostic, possibly more so regarding immunotherapy treatment.
Acknowledgment
The work of AO was supported by the Center of Excellence Grant from the Flight Attendant Medical Research Institute (FAMRI).
Disclosure
DU reports personal fees from Bristol Myers Squibb and Roche outside the submitted work. JB reports grants, serves on advisory board, received honoraria from MSD, other BMS, Roche, AstraZeneca, Pfizer, Abbvie, Takeda, and VBL outside the submitted work. DO reports personal fees from BMS, MSD, BI and AstraZeneca, outside the submitted work. All other authors report no conflicts of interest in this work.
References
1. Fearon K, Strasser F, Anker SD, et al. Definition and classification of cancer cachexia: an international consensus. Lancet Oncol. 2011;12(5):489–495. doi:10.1016/S1470-2045(10)70218-7
2. Fearon KC, Glass DJ, Guttridge DC. Cancer cachexia: mediators, signaling, and metabolic pathways. Cell Metab. 2012;16(2):153–166. doi:10.1016/j.cmet.2012.06.011
3. Suzuki Y, Okamoto T, Fujishita T, et al. Clinical implications of sarcopenia in patients undergoing complete resection for early non-small cell lung cancer. Lung Cancer. 2016;101:92–97. doi:10.1016/j.lungcan.2016.08.007
4. Kim EY, Kim YS, Park I, Ahn HK, Cho EK, Jeong YM. Prognostic significance of CT-determined sarcopenia in patients with small-cell lung cancer. J Thorac Oncol. 2015;10(12):1795–1799. doi:10.1097/JTO.0000000000000690
5. Ida S, Watanabe M, Yoshida N, et al. Sarcopenia is a predictor of postoperative respiratory complications in patients with esophageal cancer. Ann Surg Oncol. 2015;22(13):4432–4437. doi:10.1245/s10434-015-4559-3
6. Antoun S, Baracos VE, Birdsell L, Escudier B, Sawyer MB. Low body mass index and sarcopenia associated with dose-limiting toxicity of sorafenib in patients with renal cell carcinoma. Ann Oncol. 2010;21(8):1594–1598. doi:10.1093/annonc/mdp605
7. Heidelberger V, Goldwasser F, Kramkimel N, et al. Sarcopenic overweight is associated with early acute limiting toxicity of anti-PD1 checkpoint inhibitors in melanoma patients. Invest New Drugs. 2017;35(4):436–441. doi:10.1007/s10637-017-0464-x
8. Torre LA, Bray F, Siegel RL, Ferlay J, Lortet-Tieulent J, Jemal A. Global cancer statistics, 2012. CA Cancer J Clin. 2015;65(2):87–108. doi:10.3322/caac.21262
9. Siegel RL, Miller KD, Jemal A. Cancer statistics, 2016. CA Cancer J Clin. 2016;66(1):7–30. doi:10.3322/caac.21332
10. Chen DS, Mellman I. Elements of cancer immunity and the cancer-immune set point. Nature. 2017;541(7637):321–330. doi:10.1038/nature21349
11. Reck M, Rodriguez-Abreu D, Robinson AG, et al. Pembrolizumab versus chemotherapy for PD-L1-positive non-small-cell lung cancer. N Engl J Med. 2016;375(19):1823–1833. doi:10.1056/NEJMoa1606774
12. Borghaei H, Paz-Ares L, Horn L, et al. Nivolumab versus docetaxel in advanced nonsquamous non-small-cell lung cancer. N Engl J Med. 2015;373(17):1627–1639. doi:10.1056/NEJMoa1507643
13. Herbst RS, Baas P, Kim DW, et al. Pembrolizumab versus docetaxel for previously treated, PD-L1-positive, advanced non-small-cell lung cancer (KEYNOTE-010): a randomised controlled trial. Lancet. 2016;387(10027):1540–1550. doi:10.1016/S0140-6736(15)01281-7
14. Rittmeyer A, Barlesi F, Waterkamp D, et al. Atezolizumab versus docetaxel in patients with previously treated non-small-cell lung cancer (OAK): a phase 3, open-label, multicentre randomised controlled trial. Lancet. 2017;389(10066):255–265. doi:10.1016/S0140-6736(16)32517-X
15. Gandhi L, Rodriguez-Abreu D, Gadgeel S, et al. Pembrolizumab plus chemotherapy in metastatic non-small-cell lung cancer. N Engl J Med. 2018;378(22):2078–2092. doi:10.1056/NEJMoa1801005
16. Yarchoan M, Hopkins A, Jaffee EM. Tumor mutational burden and response rate to PD-1 Inhibition. N Engl J Med. 2017;377(25):2500–2501. doi:10.1056/NEJMc1713444
17. Charoentong P, Finotello F, Angelova M, et al. Pan-cancer Immunogenomic analyses reveal genotype-immunophenotype relationships and predictors of response to checkpoint blockade. Cell Rep. 2017;18(1):248–262. doi:10.1016/j.celrep.2016.12.019
18. Hugo W, Zaretsky JM, Sun L, et al. Genomic and transcriptomic features of response to anti-PD-1 therapy in metastatic melanoma. Cell. 2016;165(1):35–44. doi:10.1016/j.cell.2016.02.065
19. Weber JS, Sznol M, Sullivan RJ, et al. A serum protein signature associated with outcome after anti-PD-1 therapy in metastatic melanoma. Cancer Immunol Res. 2018;6(1):79–86. doi:10.1158/2326-6066.CIR-17-0412
20. Matson V, Fessler J, Bao R, et al. The commensal microbiome is associated with anti-PD-1 efficacy in metastatic melanoma patients. Science. 2018;359(6371):104–108. doi:10.1126/science.aao3290
21. Buccheri G, Ferrigno D, Tamburini M. Karnofsky and ECOG performance status scoring in lung cancer: a prospective, longitudinal study of 536 patients from a single institution. Eur J Cancer. 1996;32A(7):1135–1141. doi:10.1016/0959-8049(95)00664-8
22. Dewys WD, Begg C, Lavin PT, et al. Prognostic effect of weight loss prior to chemotherapy in cancer patients. Eastern cooperative oncology group. Am J Med. 1980;69(4):491–497. doi:10.1016/s0149-2918(05)80001-3
23. Scott HR, McMillan DC, Forrest LM, Brown DJ, McArdle CS, Milroy R. The systemic inflammatory response, weight loss, performance status and survival in patients with inoperable non-small cell lung cancer. Br J Cancer. 2002;87(3):264–267. doi:10.1038/sj.bjc.6600466
24. Shiroyama T, Nagatomo I, Koyama S, et al. Impact of sarcopenia in patients with advanced non-small cell lung cancer treated with PD-1 inhibitors: a preliminary retrospective study. Sci Rep. 2019;9(1):2447. doi:10.1038/s41598-019-39120-6
 © 2019 The Author(s). This work is published and licensed by Dove Medical Press Limited. The
full terms of this license are available at https://www.dovepress.com/terms
and incorporate the Creative Commons Attribution
- Non Commercial (unported, 3.0) License.
By accessing the work you hereby accept the Terms. Non-commercial uses of the work are permitted
without any further permission from Dove Medical Press Limited, provided the work is properly
attributed. For permission for commercial use of this work, please see paragraphs 4.2 and 5 of our Terms.
© 2019 The Author(s). This work is published and licensed by Dove Medical Press Limited. The
full terms of this license are available at https://www.dovepress.com/terms
and incorporate the Creative Commons Attribution
- Non Commercial (unported, 3.0) License.
By accessing the work you hereby accept the Terms. Non-commercial uses of the work are permitted
without any further permission from Dove Medical Press Limited, provided the work is properly
attributed. For permission for commercial use of this work, please see paragraphs 4.2 and 5 of our Terms.