Back to Journals » Diabetes, Metabolic Syndrome and Obesity » Volume 18
Correlation Between the Levels of Fasting and Postprandial ApoB48 with Metabolic Syndrome: A Cross-Sectional Study
Authors Tang Y, Zeng S, Hou X, Tian P, Ren L, Song G
Received 13 August 2025
Accepted for publication 3 December 2025
Published 17 December 2025 Volume 2025:18 Pages 4631—4643
DOI https://doi.org/10.2147/DMSO.S560290
Checked for plagiarism Yes
Review by Single anonymous peer review
Peer reviewer comments 2
Editor who approved publication: Professor Jae Woong Sull
Yale Tang,1,2 Shaojing Zeng,2 Xiaoyu Hou,2 Peipei Tian,1,2 Luping Ren,1– 3 Guangyao Song1– 3
1Department of Internal Medicine, Hebei Medical University, Shijiazhuang, Hebei, 050017, People’s Republic of China; 2Department of Endocrinology, Hebei General Hospital, Shijiazhuang, Hebei, 050051, People’s Republic of China; 3Hebei Key Laboratory of Metabolic Diseases, Hebei General Hospital, Shijiazhuang, Hebei, 050051, People’s Republic of China
Correspondence: Guangyao Song, Email [email protected]
Purpose: This study aims to determine apolipoprotein B-48 (ApoB48) levels before and after a high-fat diet in individuals with metabolic syndrome (MetS), and to explore its relationship with MetS. It provides new risk markers for exploring the mechanism of MetS and offers important theoretical basis and candidate targets for subsequent research.
Patients and Methods: A total of 192 adult Chinese volunteers were enrolled in this cross-sectional study. Participants were divided into control and MetS groups according to the NCEP ATP III diagnostic criteria for MetS. All participants underwent oral fat tolerance testing (OFTT). Serum concentrations of fasting and postprandial ApoB48 were measured, and their relationships with each MetS component were analyzed.
Results: Among 192 participants, 81 were diagnosed with MetS. Both fasting and postprandial ApoB48 concentrations were higher in the MetS group than in the control group (P < 0.05). The incidence of MetS increased with rising ApoB48 levels. In both groups, ApoB48 concentrations initially increased and then decreased after OFTT, peaking at 4 h postprandially, with higher peak values observed in the MetS group. Fasting and 2-h postprandial ApoB48 levels had the strongest correlations with MetS.
Conclusion: Higher ApoB48 levels before and after OFTT were positively correlated with an increased risk of MetS and were higher than those in the healthy population. Fasting ApoB48 and 2-h postprandial ApoB48 levels after a high-fat meal may be potential markers of MetS.
Keywords: high-fat diet, oral fat tolerance testing, intestinal chylomicrons, triglycerides
Introduction
Metabolic syndrome (MetS) is a group of clinical syndromes mainly characterized by obesity, hyperglycemia (impaired glucose regulation or diabetes), hypertension, and dyslipidemia. These disorders are intrinsically connected. The prevalence of MetS is increasing annually, and approximately 34.7% of American adults suffer from MetS.1 Globally, as of 2020, approximately 60 million children and adolescents are affected.2 MetS is associated with various diseases,3–5 especially cardiovascular disease (CVD), and is a typical risk factor for its development.6 It increases the relative risk of CVD by 1.53–2.18%, the all-cause mortality rate by 1.27–1.60%, and the risk of type 2 diabetes mellitus (T2DM) by fivefold.7 It also reduces the quality of life of patients and, in severe cases, may significantly shorten life expectancy.8 Therefore, it is important to identify relevant risk factors for MetS.
Apolipoproteins are important factors associated with metabolic disorders. Our previous research demonstrated the role of apolipoprotein CIII (ApoCIII) in lipid metabolism and emphasized its association with MetS.9 Apolipoprotein B (ApoB) is a common apolipoprotein, and apolipoprotein B-48 (ApoB48), a subtype of the ApoB family, is synthesized in the intestine. It participates in CM assembly and secretion and transports triglycerides (TG) from food sources into the blood. When these lipoproteins and residual lipoprotein particles (rlp) accumulate, it can lead to insulin resistance, metabolic disorders and abnormal lipids, increasing the risk of metabolic diseases.10–12
In recent years, an increasing number of studies have begun to focus on the association between ApoB48 levels and MetS. Multiple cross-sectional studies have shown that compared with healthy individuals, patients with MetS exhibit significantly elevated ApoB48 levels, and these levels are positively correlated with hypertriglyceridemia and insulin resistance.13–15 Wu et al discovered that in obese individuals, fasting ApoB48 was approximately 50% higher, while in non-fasting states, the level of ApoB48 was even twice that of people with healthy weight, and it was positively correlated with TG. They also found that an increase of 1mg/mL in APOB48 predicted that the thickness of carotid artery plaques might increase by 0.75mm.16 However, the existing research still has some limitations. Firstly, the sample size of most studies is limited. Secondly, most articles only observed the fasting state. However, in the fasting state, the concentration of ApoB48 in the blood circulation is usually low, which may make the test results less sensitive. Moreover, people spend most of their day in the postprandial state. Therefore, the changes in lipid metabolism after meals cannot be ignored. To address this issue, OFTT can be used as a functional detection method. By consuming high-fat meals, it dynamically simulates postprandial lipid metabolism changes, thereby conducting association analysis between postprandial ApoB48 dynamics (such as peak time). Thirdly, the current research is still insufficient in analyzing specific components (such as hypertension, etc).
Therefore, this study aimed to analyze the metabolic changes in ApoB48 under fasting and postprandial conditions using a high-fat meal test in a larger sample cohort, and quantify its correlation with each component of MetS, with the aim of providing more accurate experimental evidence for the early identification and risk stratification of MetS.
Materials and Methods
Participants
From January to June 2020, volunteers were randomly recruited from the Endocrinology Department of Hebei General Hospital. This study adhered to the principles of the Declaration of Helsinki and was approved by Hebei General Hospital (Registration Number: hiCTR1800019514. Ethical approval number: 2020-KY-27). All participants provided written informed consent.
Exclusion Criteria
Exclusion criteria were as follows: malignant tumors, vegetarians, heart disease, digestive system diseases, thyroid dysfunction, history of severe diabetes, infectious diseases, kidney diseases, blood system diseases, mental disorders, pregnancy, and use of drugs related to lipid metabolism (such as hormones, beta-blockers, contraceptives, or diuretics). Participants with a history of stroke, trauma, surgery, weight change of more than 3 kg, or severe infection within the past 3 months were also excluded.
All participants underwent an oral glucose tolerance test (OGTT) before the trial. According to the 1999 WHO diagnostic criteria for T2DM (fasting blood glucose ≥ 7.0 mmol/L and/or OGTT 2-h blood glucose ≥ 11.1 mmol/L), those with abnormal blood glucose were excluded.
Oral Fat Tolerance Testing (OFTT)
Participants were required to follow a normal diet for one week before oral fat tolerance testing (OFTT). They fasted from 10 pm the night before the OFTT. Fasting blood samples were collected at 8 am the following day. Each participant consumed a high-fat meal containing 1500 kcal of calories (20% from protein, 20% from carbohydrates, and 60% from fat) within 10 min. The levels of total cholesterol (TC), TG, high-density lipoprotein cholesterol (HDL-C), low-density lipoprotein cholesterol (LDL-C), and ApoB48 were measured 2, 4, 6, and 8 h postprandially. Food intake was prohibited during the test; however, drinking water was allowed.17
Collection of General Characteristics and Detection of Biochemical Indicators
General features included weight, height, and waist circumference (WC). Body mass index (BMI) was calculated as weight (kg) divided by height squared (m2). Systolic blood pressure (SBP) and diastolic blood pressure (DBP) were measured automatically using an electronic blood pressure monitor. After three consecutive automatic repeated measurements, the average value was considered the participant’s blood pressure. Fasting concentrations of TC, TG, HDL-C, LDL-C, ApoB48, and fasting blood glucose (FBG) were determined using the Hitachi 7600 fully automatic biochemical analyzer (Hitachi Instruments Ltd., Tokyo, Japan). Triglyceride-rich lipoprotein residue (TRLR) and non-high-density lipoprotein cholesterol (non-HDL-C) were calculated using the following formulas: TRLR = TC – HDL-C – LDL-C and non-HDL-C = TC – HDL-C, respectively. We also calculated the area under the ApoB48 curve (AUCApoB48) within 8 h using the trapezoidal method. Fasting insulin (FINS) concentration and 2-h postprandial insulin (2-h PINS) levels were determined using chemiluminescence. The homeostasis model assessment of insulin resistance (HOMA-IR) was performed using fasting insulin (mIU/L) and fasting glucose (mmol/L): HOMA-IR = FBG (mmol/L) × FINS (mIU/L)/22.5.18
Diagnostic Criteria and Grouping
Based on the National Cholesterol Education Program Adult Treatment Panel III (NCEP ATP III), the diagnostic criteria for MetS are three or more of the following: (1) abdominal obesity: WC ≥ 102 cm for men, WC ≥ 88 cm for women; (2) fasting TG ≥ 1.7 mmol/L (150 mg/dL) or receiving TG-lowering treatment; (3) fasting HDL-C: male < 1.0 mmol/L (40 mg/dL), female < 1.3 mmol/L (50 mg/dL), or receiving treatment for elevated HDL-C; (4) blood pressure: SBP ≥ 130 mmHg or DBP ≥ 85 mmHg or receiving antihypertensive treatment; (5) FBG: ≥ 5.6 mmol/L (100 mg/dL) or receiving hypoglycemic treatment.19 Participants were divided into two groups: MetS and control.
Statistical Analysis
The Shapiro–Wilk method is used to determine the normality of data. Data following a normal distribution were expressed as mean ± standard deviation; otherwise, the interquartile range was used. Data from both groups were compared using t-tests for normal distribution and non-parametric test (Mann–Whitney U-test) for skewed distribution. Pearson correlation analysis was used for the correlation analysis of the two variables if they conformed to a normal distribution and had uniform variances; otherwise, Spearman’s analysis was used. A correlation study between MetS and its risk factors was conducted using univariate and multivariate binary logistic regression analyses. The power calculation was carried out using the software G.power.3.1.9.7 (Effect size at 0.5. αerr prob = 0.05. Two tails. The power (1 - βerr prob) = 0.8). All figures were generated using GraphPad Prism 8.0 (version 9.0, San Diego, CA, USA). Statistical analyses were conducted using IBM SPSS Statistics for Windows (version 26.0; IBM Corp., Armonk, NY, USA). Statistical significance was set at P < 0.05.
Results
Comparison of General Information Between the Two Groups
Clinical data were collected from 192 volunteers, including 97 women and 95 men, aged 22–67 years, with BMI values ranging from 18.2 kg/m2 to 35.2 kg/m2. Some patients were overweight. The mean fasting ApoB48 level for all volunteers was 5.14 ± 1.65 mg/L (Table 1).
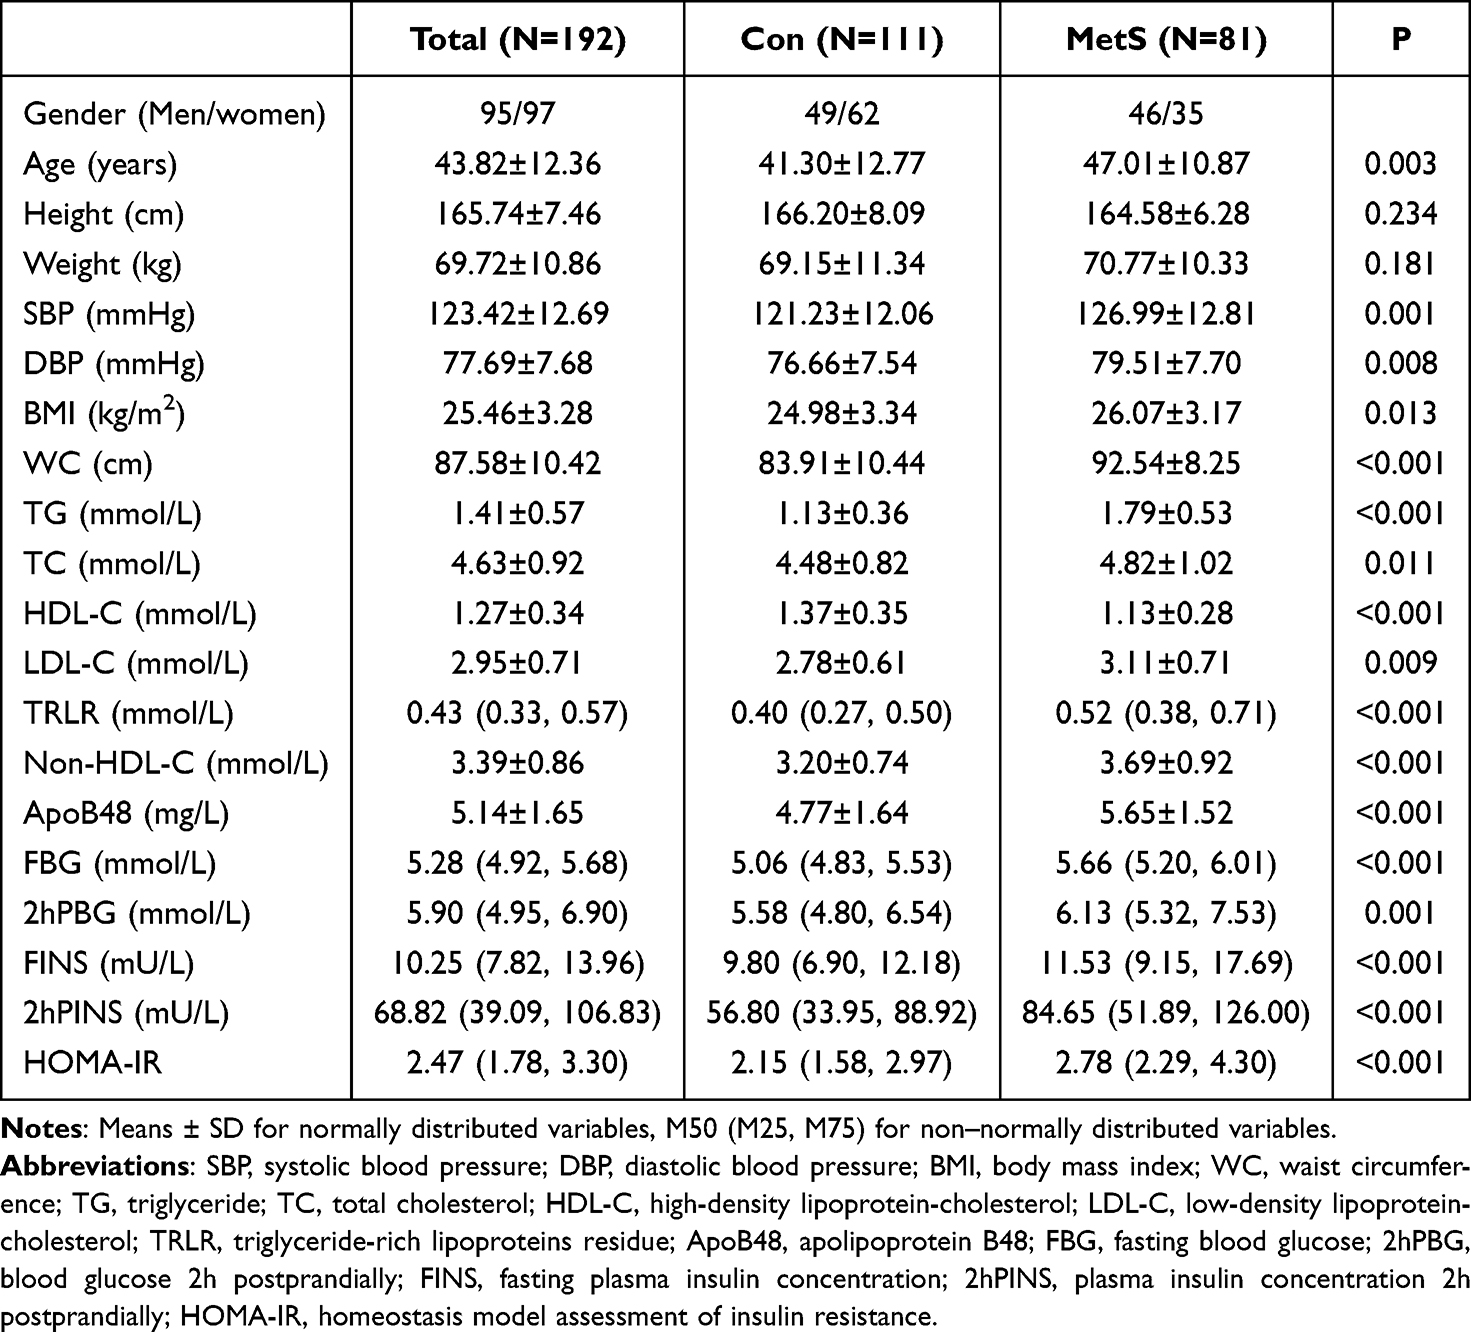 |
Table 1 Anthropometric and Biochemical Characteristics of All Chinese Study Subjects |
Participants were divided into two groups according to the NCEP ATP III diagnostic criteria. Compared with the control group, the MetS group had significantly higher values for age, SBP, DBP, BMI, WC, TG, TC, LDL-C, TRLR, non-HDL-C, ApoB48, FBG, 2-h postprandial blood glucose (2-h PBG), FINS, 2-h PINS, and HOMA-IR (P < 0.05), while HDL-C levels were lower (P < 0.05) (Table 1).
We further compared differences according to sex. The control group comprised 49 men and 62 women, while the MetS group comprised 46 men and 35 women. Among men, height, SBP, BMI, WC, TG, TC, LDL-C, TRLR, non-HDL-C, ApoB48, FBG, 2-h PBG, FINS, and HOMA-IR were all higher in the MetS group than in the control group (P < 0.05). Among women, age, weight, SBP, DBP, BMI, WC, TG, TC, LDL-C, TRLR, non-HDL-C, ApoB48, FBG, 2-h PBG, FINS, 2-h PINS, and HOMA-IR were higher in the MetS group than in the control group (P < 0.05). In both sexes, HDL-C levels were lower in the MetS group than in the control group (P < 0.05) (Table 2).
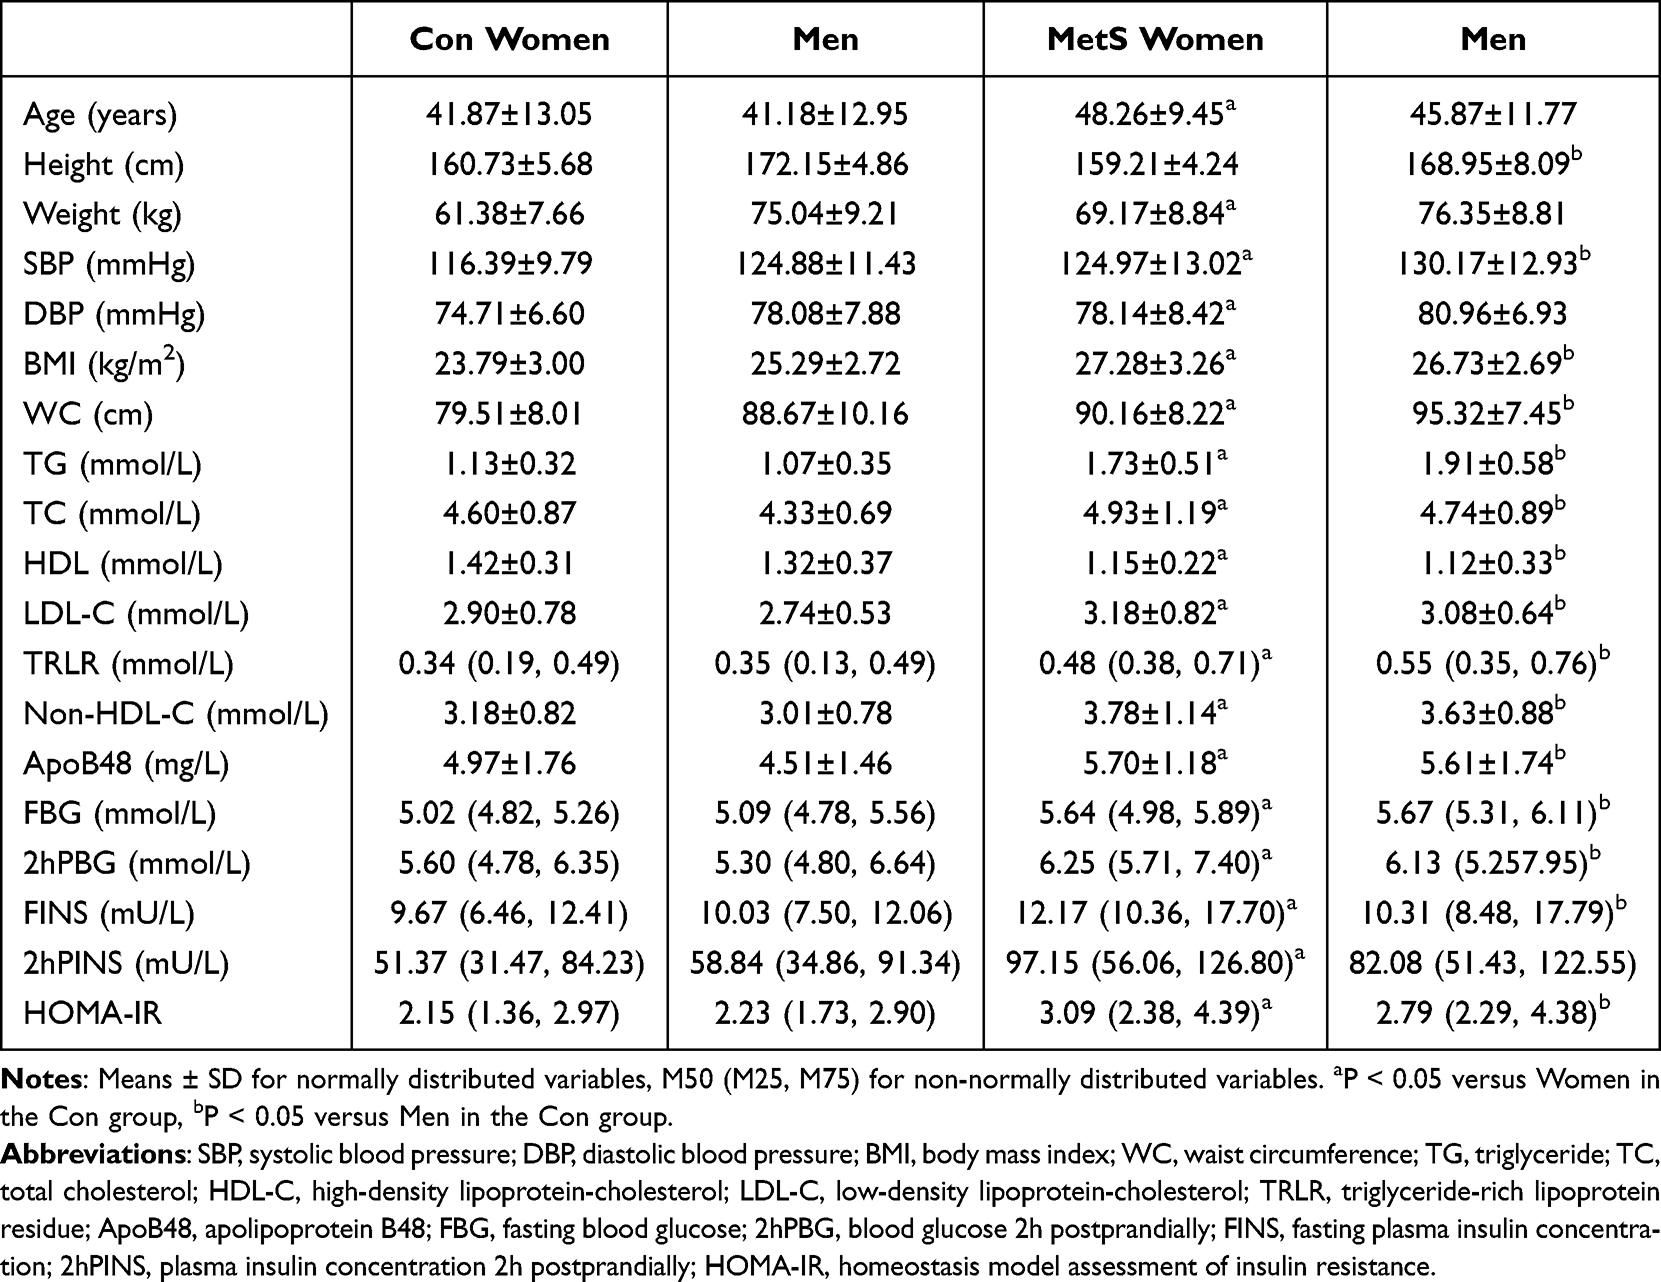 |
Table 2 Comparison of Anthropometric, Clinical and Fasting Metabolic Parameters in Participants of Each Sex |
Comparison of Hepatic Function
This study compared the liver enzymatic indicators of the two groups of subjects. The levels of ALT and AST in the MetS group were significantly higher than those in the control group both fasting and postprandial, and the difference was statistically significant (P < 0.05) (Figure 1). It is suggested that patients with metsd have more significant hepatocyte inflammation or metabolic liver damage.
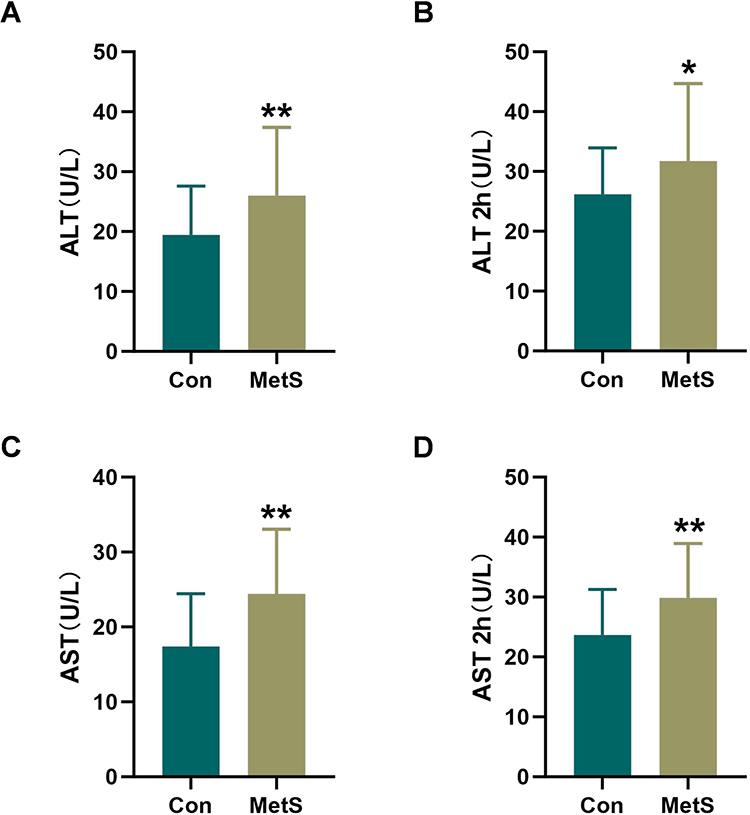 |
Figure 1 Comparison of the hepatic function. (A) The level of fasting ALT. (B) The ALT level 2 hours after a high-fat meal. (C) The level of fasting AST. (D) The AST level 2 hours after a high-fat meal. Notes: *P < 0.05 versus Con group, **P < 0.001 versus Con group. |
Comparison of Blood Lipids After OFTT
OFTT was conducted on all participants. At each time point, TG, TC, LDL-C, non-HDL-C, and TRLR levels were higher in the MetS group than in the control group (P < 0.05), while HDL-C levels were lower (P < 0.05) (Table 3).
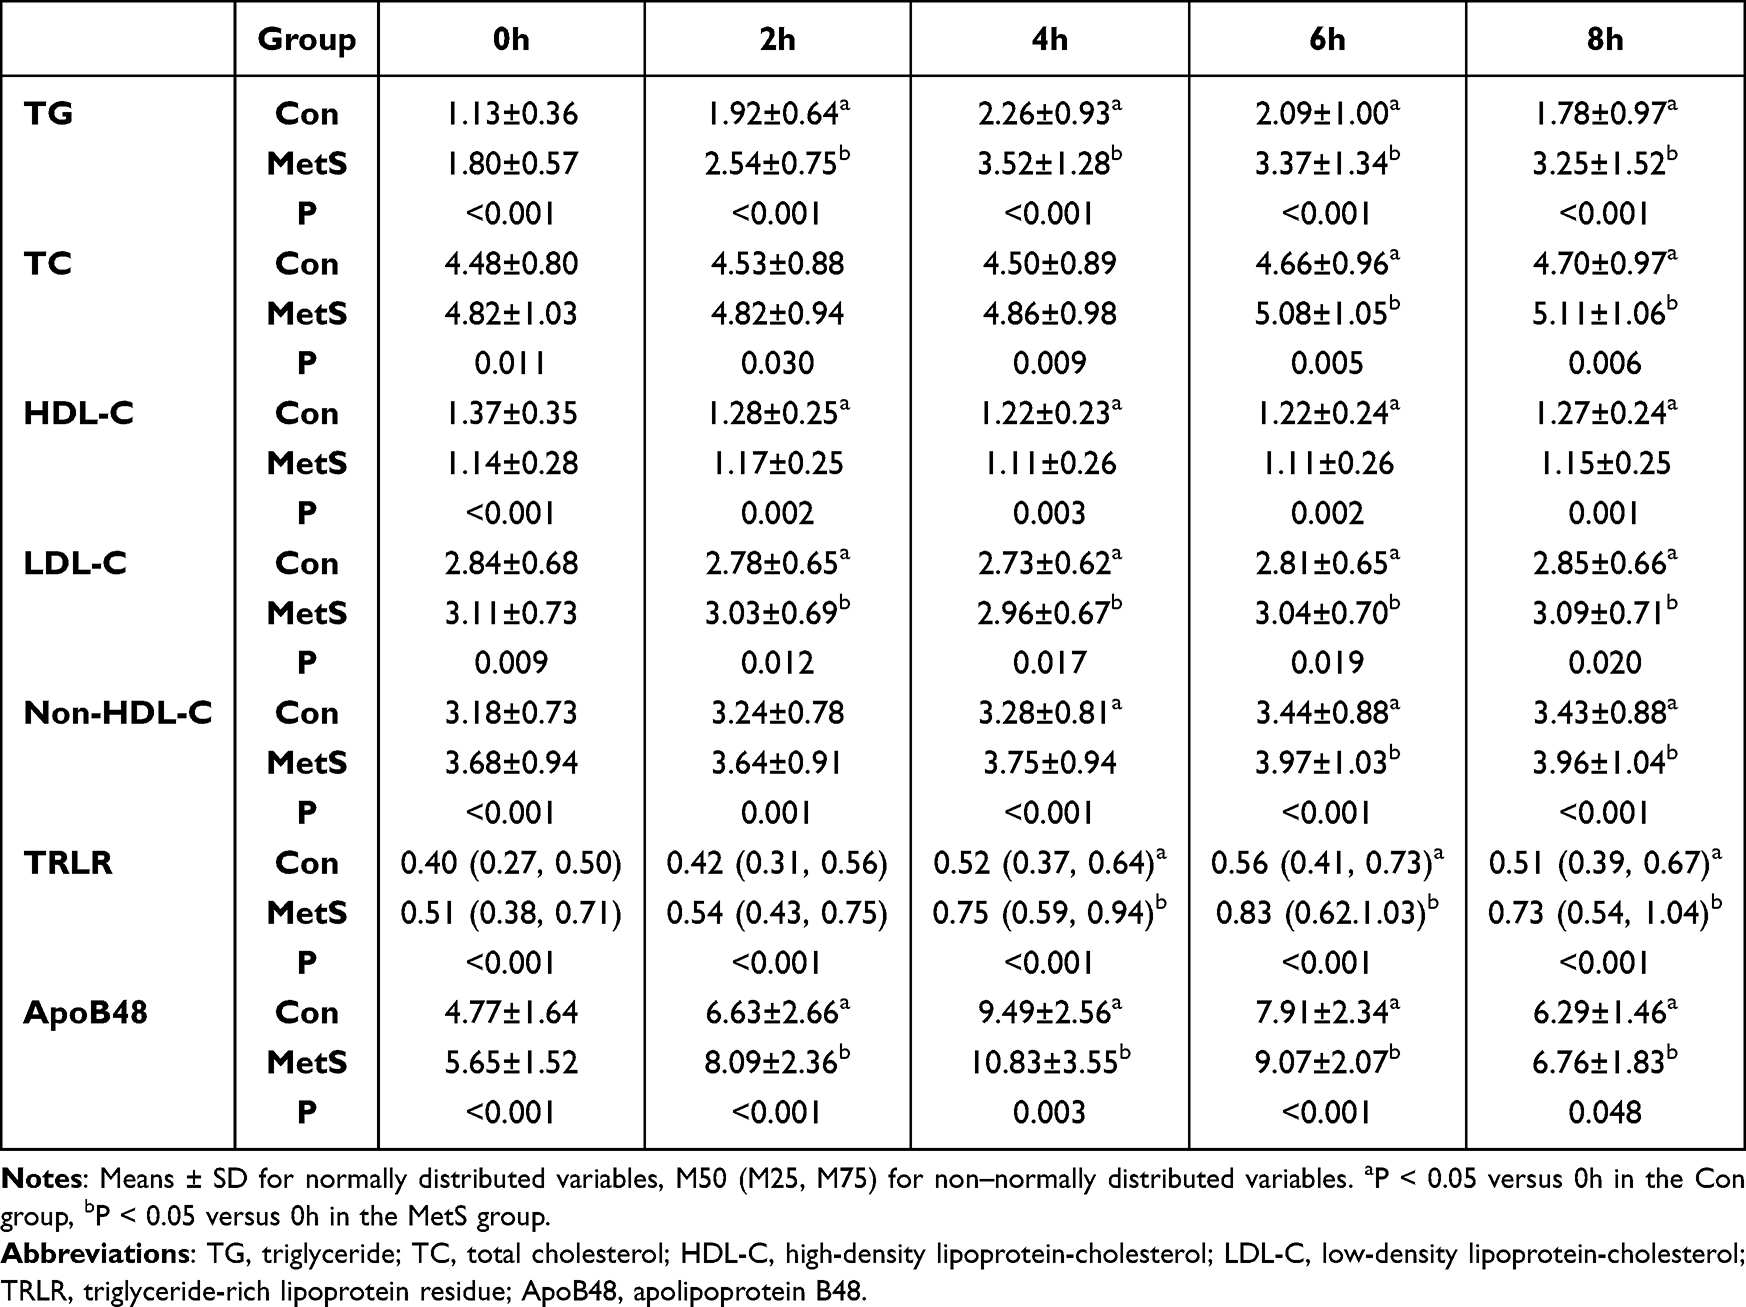 |
Table 3 Changes of Lipids Factors During OFTT in Two Groups |
There were differences in lipoprotein levels between the two groups before and after a high-fat meal. ApoB48 levels first increased and then decreased in both groups. At each time point, ApoB48 levels in the MetS group were higher than those in the control group (P < 0.05), significantly increasing at 2 h and peaking at 4 h with a concentration 1.14 times that of the control group (Figure 2A). Compared with the baseline level (0 h) in the same group, ApoB48 concentrations at 2, 4, 6, and 8 h were significantly increased (P < 0.05). The area under the curve (AUC) for ApoB48 over 8 h was also significantly higher in the MetS group than in the control group (P < 0.05) (Figure 2B).
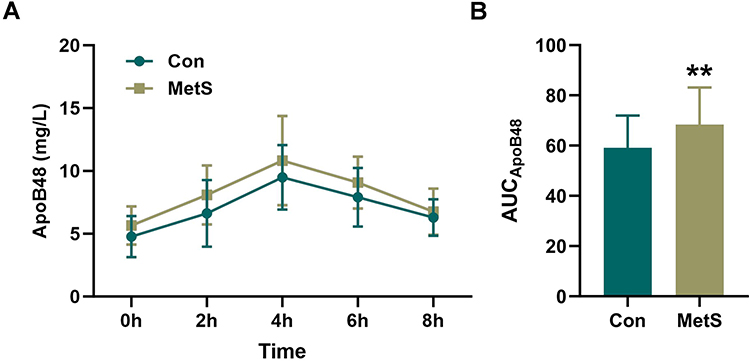 |
Figure 2 Comparison of the ApoB48 after OFTT. (A) ApoB48 concentrations at different time points during OFTT in two groups. (B) The area under the curve. Notes: **P < 0.001 versus Con group. |
Trend in MetS Prevalence Based on ApoB48 Levels
Participants were divided into four groups from lowest to highest, based on the interquartile range of fasting ApoB48 levels: Group A (ApoB48 < 3.8500 mg/L), Group B (3.8500 mg/L ≤ ApoB48 < 5.2700 mg/L), Group C (5.2700 mg/L ≤ ApoB48 < 6.3275 mg/L), and Group D (ApoB48 ≥ 6.3275 mg/L). The numbers of patients without and with MetS in each group were as follows: Group A (36 and 12), Group B (32 and 16), Group C (21 and 27), and Group D (22 and 26). The incidence of MetS has significantly increased, ranging from 25–35% to 50–60%. When the number of MetS components (according to the MetS diagnostic criteria) was reassessed, it was found that higher ApoB48 levels were associated with a higher number of components. Therefore, the incidence of MetS tended to increase with increasing ApoB48 levels (Figure 3).
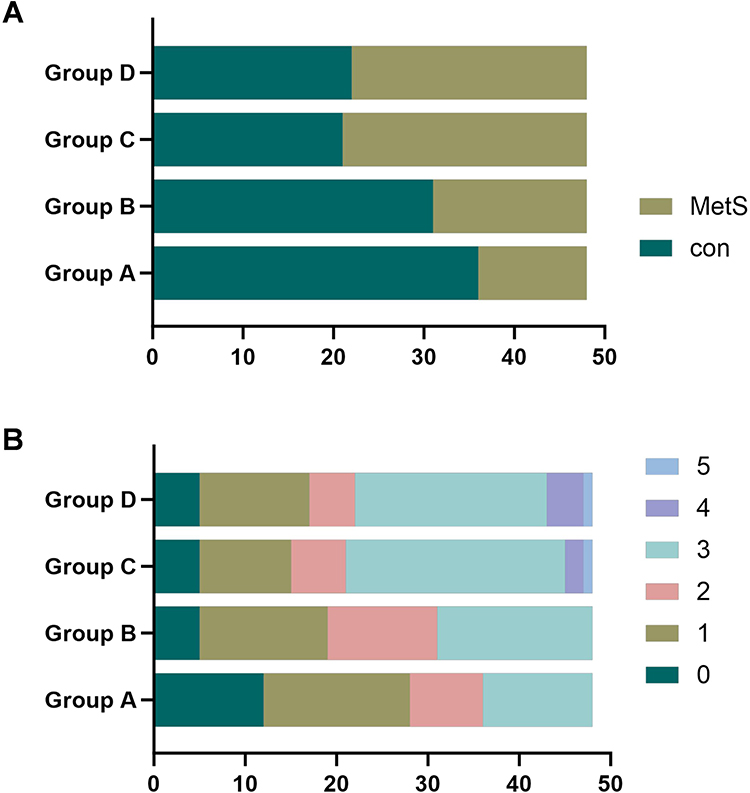 |
Figure 3 Comparison of the number of MetS in the subgroups. (A) The number of MetS in each subgroup. (B) The number of components of MetS in each subgroup. The numbers represent the number of components containing the diagnostic criteria for MetS. |
Correlation Analysis of ApoB48 and MetS Components Before and After OFTT
ApoB48 concentrations at fasting and 2, 4, 6, and 8 h after OFTT were correlated with each MetS component. Fasting ApoB48 was positively correlated with DBP, WC, FBG, and TG (P < 0.05) and negatively correlated with HDL-C, with the strongest correlation observed for HDL-C (r = −0.290, P < 0.001). 2-h ApoB48 was positively correlated with SBP, DBP, WC, FBG, and TG (P < 0.05) and negatively correlated with HDL-C (r = −0.261, P < 0.001). 4-h ApoB48 was positively correlated with WC and FBG levels (P < 0.05) and negatively correlated with HDL-C levels (r = −0.241, P = 0.001). 6-h ApoB48 was positively correlated with WC, FBG, and TG levels (P < 0.05). 8-h ApoB48 was positively correlated with FBG (r =- 0.151, P < 0.05). Overall, ApoB48 most strongly correlated with MetS at 0 and 2 h after a high-fat meal (Table 4).
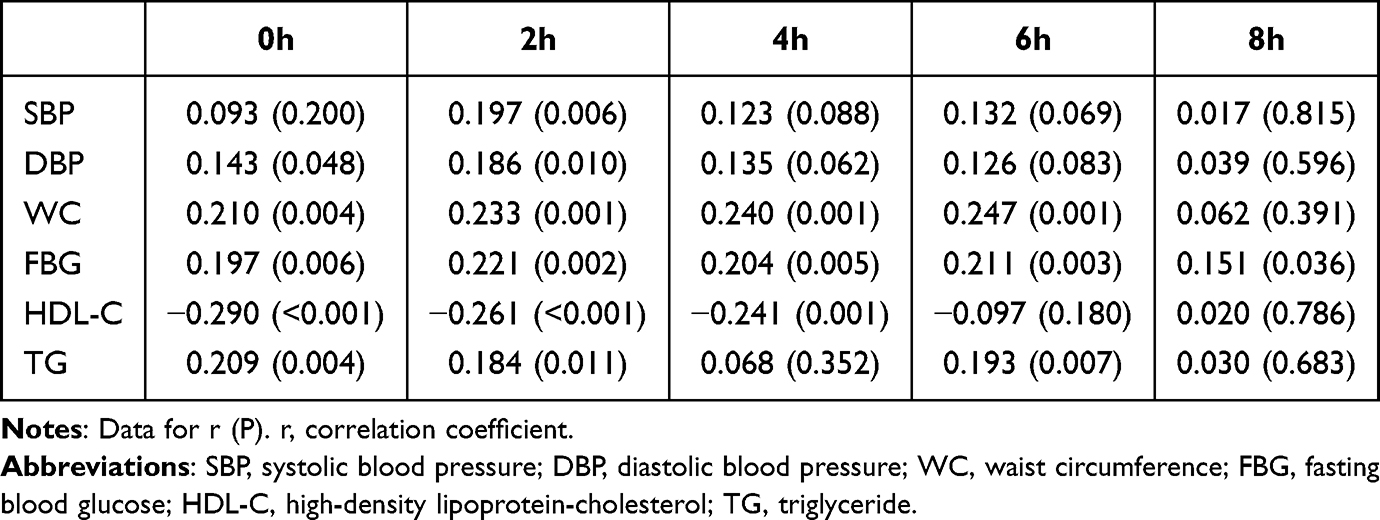 |
Table 4 Relationship Between Fasting and Postprandial ApoB48 with MetS Components |
Binary Logistic Regression Analysis of MetS
Using MetS as the dependent variable, binary logistic regression was used to analyze the relationship between ApoB48 and MetS. Independent variables were screened successively, revealing that independent variables related to MetS were age, SBP, DBP, BMI, TC, TG, HDL-C, LDL-C, 0-h ApoB48, 2-h ApoB48, 4-h ApoB48, 6-h ApoB48, and HOMA-IR.
The relationship between ApoB48 levels and MetS was analyzed after adjusting for age and sex. We found that 0-h, 2-h, 4-h, and 6-h ApoB48 levels were positively correlated with MetS. Candidate variables (P < 0.01), such as SBP, TG, HDL-C, and HOMA-IR, were included in the multivariate binary logistic regression equation. After readjustment, fasting and 2-h ApoB48 remained independent risk factors for MetS (odds ratio [OR] = 1.335, P = 0.042; OR = 1.196; P = 0.045, respectively). For each unit increase in fasting ApoB48 levels, the probability of developing MetS increased by 33.5%, and for each unit increase in 2-h ApoB48 levels, the probability of developing MetS increased by 19.6% (Table 5).
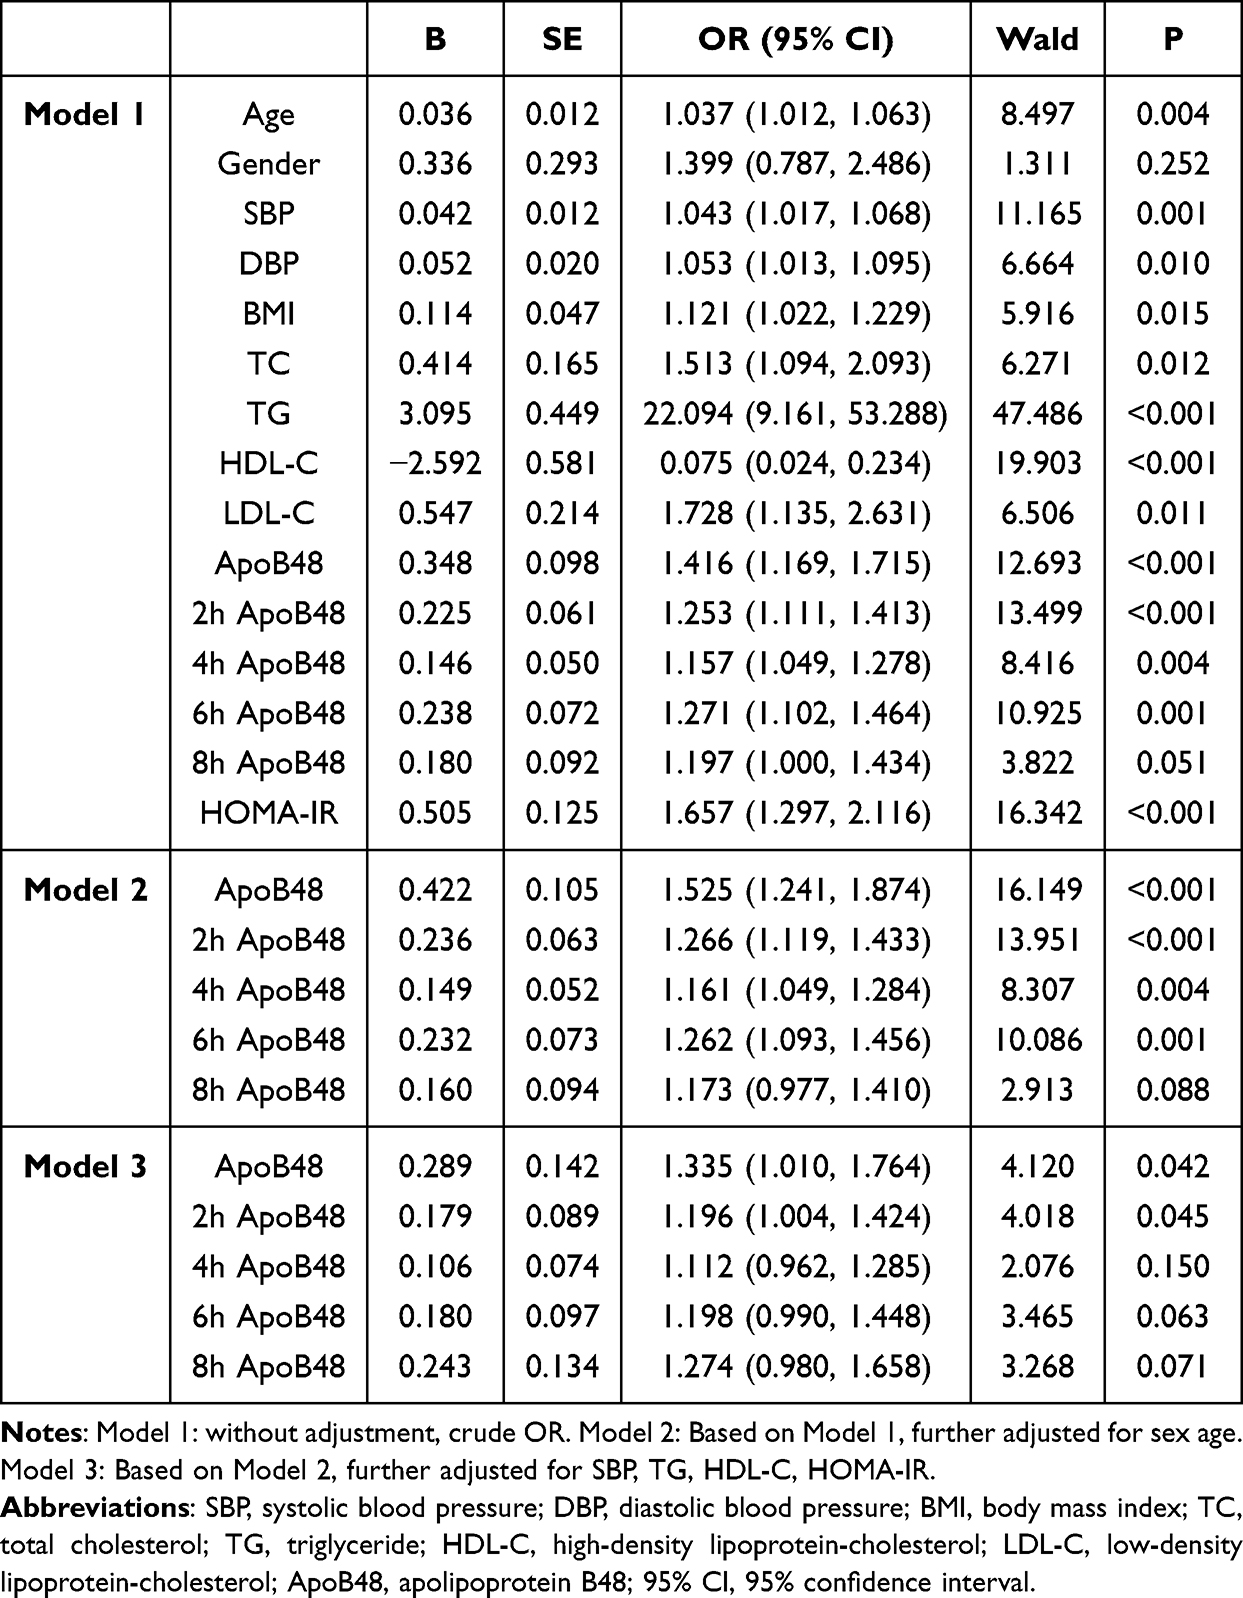 |
Table 5 Binary Logistic Regression Analysis to Assess the MetS |
Discussion
ApoB48 is an apolipoprotein component of CM and is present in CM-Rs derived from CM fat breakdown.20 Each lipoprotein particle of CM and CM-R contains one ApoB48 molecule; therefore, ApoB48 levels reflect the quantity of ApoB48-containing lipoproteins. Direct measurement of serum ApoB48 can more accurately assess lipoprotein content.
Although the role of LDL-C in metabolic diseases is well known,21 the “ApoB principle” has been proposed in recent years. Multiple studies have shown that ApoB100 and ApoB48 are involved in the development of metabolic diseases such as diabetes,22 atherosclerotic cardiovascular disease,23–26 and non-alcoholic fatty liver disease (NAFLD).17 Therefore, residual lipoproteins may be key factors leading to metabolic diseases. Our previous research found that ApoB concentrations vary among populations and are correlated with glycolipid metabolism.27,28 In this study, participants were divided into MetS and control groups to compare differences in ApoB48, with the aim of exploring the relationship between ApoB48 and MetS. To date, only a few studies have been conducted on ApoB48 and MetS,13 focusing on the concentration of fasting ApoB48. Because fasting levels mainly refer to liver-derived lipoproteins, due to the delayed decomposition of liver fat,29 and may not promptly reflect current abnormalities, hidden metabolic dysfunctions may be missed. Moreover, individuals spend most of the day in a postprandial state,24 during which residual lipoproteins continuously produced after each meal act as additional risk factors. Therefore, changes in lipoprotein levels after meals should also be analyzed.30,31 Postprandial hypertriglyceridemia (PHTG), characterized by the postprandial accumulation of enterogenous CM and CM-R, is an independent risk factor for metabolic diseases.32
Recently, a proteomic analysis study confirmed that CM-Rs have atherosclerotic characteristics through ultracentrifugation and immunoprecipitation using an ApoB48-specific antibody.14 Similarly, ApoB48 was detected in atherosclerotic plaques in a clinical study.33 Therefore, ApoB48 levels are strongly correlated with MetS. Jin et al showed that fasting ApoB48 levels may help predict CVD.34 During the follow-up period of a clinical study, Szili-Torok et al found that cardiovascular events and total mortality were significantly associated with baseline ApoB48 levels (hazard ratio [HR] = 1.05, OR = 1.13).35 In addition, several studies have investigated postprandial ApoB48. Lim et al found that patients with T2DM showed an increase in ApoB48 AUC after a high-fat meal.36 Riitta et al reported similar findings. By analyzing 11 patients with diabetes who consumed a fat-rich diet containing 927 kcal, they found no significant difference in fasting lipid profiles, whereas postprandial ApoB48 and residue levels increased twofold.15 These differences are mainly attributed to the excessive intestinal secretion of ApoB48-containing lipoproteins into CMs and the low fat decomposition rate of CMs. Overall, previous studies have demonstrated that both fasting and postprandial ApoB48 levels have a certain degree of predictive value when assessing the risk of MetS and cardiovascular and cerebrovascular diseases.37 In the current study, ApoB48 levels were higher in the MetS group than in the control group both before and after a high-fat meal. Therefore, changes in ApoB48 levels are crucial risk markers for MetS.
In this study, the basic characteristics of the two groups were first analyzed, including BMI, WC, TG, TC, LDL-C, and HOMA-IR, all of which were significantly higher in the MetS group than in the control group. The 2022 report from the US Centers for Disease Control and Prevention also indicated that obese adults were 4.74 times more likely to develop MetS,3 consistent with a previous study.38 We further found positive correlations among BMI, WC, and MetS. Considering potential sex differences in lipid metabolism, baseline values were compared within each sex group. MetS participants had higher values than the sex-matched control group. However, contrary to previous research conclusions,13,39 we found no significant sex difference in fasting ApoB48 concentration. This discrepancy may be affected by racial differences, as previous studies were based on Australian youths and Japanese adults, while this study focused solely on local Chinese adults, resulting in certain differences in measured values. We also found both ALT and AST are liver-specific indicators. Their elevation usually directly reflects the degree of steatosis and inflammation of liver cells, that is, non-alcoholic fatty liver disease (NAFLD), and NAFLD is closely related to insulin resistance and MetS. The steatosis environment of the liver may have an intrinsic connection with the clearance disorder of chylomicrons from the intestine (rich in ApoB48), which provides new and direct evidence for the study of the mechanism.
We observed that ApoB48 concentration peaked 4 h after consumption of a high-fat meal containing 100 g of fat. Taskinen et al reached the same conclusion when they fed participants a high-fat meal containing 68 g of fat to study the secretion and clearance of TG lipoproteins.15 Although there were slight differences in fat load, the changing trends in ApoB48 were similar.
Correlation analysis showed that fasting and 2-h postprandial ApoB48 were significantly associated with all MetS components, whereas 4-h and 6-h ApoB48 levels were associated with two MetS components, and 8-h ApoB48 with only one component. These associations were verified using multivariate logistic regression analysis. Similar to previous studies,40 we also found that insulin resistance is a central link in MetS. However, fasting and 2-h ApoB48 levels after a high-fat meal remained correlated with MetS after adjusting for sex, age, SBP, TG, HDL-C, and HOMA-IR, supporting the reliability of our findings. In addition, this study revealed that as the concentration of ApoB48 increased, the incidence of MetS increased gradually.
Currently, no reference range exists for fasting ApoB48 levels in Chinese adults or adolescents. A study involving a large number of adolescents (n = 1045) reported an average fasting ApoB48 level of 13.93 mg/L,13 while a study on healthy adult men in Japan suggested a reference upper limit of 5.7 mg/L,32 which was different from the fasting baseline value of 5.14 ± 1.65 mg/L in our study. Changes in leptin, adiponectin, and other factors affecting insulin sensitivity at different growth stages may contribute to these different concentrations of ApoB48. Future studies with a larger number of participants will be needed to formulate corresponding reference ranges for different demographic groups.
Study Strengths and Limitations
This study used the OFTT to observe the changes in ApoB48 levels under fasting and postprandial conditions, which have not been previously reported. Stratified analyses revealed that higher ApoB48 concentrations were associated with increased prevalence of MetS. Correlation and regression analyses also revealed that baseline fasting ApoB48 levels and postprandial 2-h ApoB48 levels were significantly increased in the MetS group, emphasizing the importance of considering intestinal lipoprotein metabolism in MetS.
However, this study has some limitations. First, the sample size is small and limited to a local population, which may affect the generalizability of the results. Second, as a cross-sectional study, causality between ApoB48 and MetS could not be determined. Multicenter prospective studies are needed to confirm our findings and to explore the specific mechanism behind the observed associations. Third, the detection of ApoB48 may be influenced by hyperlipidemia, interactions with other lipoproteins, and detection methods. The roles of several lipoproteins, such as ApoB, ApoB48, and ApoB100, in MetS should be further explored. Fourth, despite adjusting for key demographic and clinical variables (gender, age, blood pressure, HOMA-IR) in the logistic regression analysis model, residual confounding, including those that may be caused by lifestyle and dietary habits, nutritional status, racial differences in the population, socioeconomic status and other factors, cannot be completely ruled out, as we were limited by data availability and the observational nature of our study design. Controlling for these factors may enhance or weaken the observed associations. Future research needs to obtain more comprehensive datasets to explain these important confounding factors. The proportion of high-fat meals may also cause variations in ApoB48 levels. Future exploratory studies should be conducted using standardized fat-rich meals.
Regarding the clinical implications of our findings, the identified association suggests that ApoB48 is a modest, independent risk marker for MetS. This knowledge could be valuable for refining risk stratification models in clinical practice. For example, patients with elevated levels of ApoB48 might be prioritized for more intensive screening or preventive interventions. Furthermore, this association generates a hypothesis for future interventional studies to determine whether modifying ApoB48 can lead to a reduction in the incidence of MetS. It is crucial to emphasize that our results are preliminarily highlight a potential pathway for risk mitigation.
Conclusion
In summary, we found that fasting ApoB48 and 2-h ApoB48 levels after a high-fat meal were significantly and positively correlated with MetS. These findings suggest that ApoB48 may be a potential marker for MetS, providing a fundamental basis for identifying at-risk patients through residual lipoprotein levels and reducing the prevalence of MetS by reducing intestinal lipid absorption. This could provide relevant guidance for clinical application.
Abbreviations
MetS, metabolic syndrome; OFTT, oral fat tolerance test; SBP, systolic blood pressure; DBP diastolic blood pressure; BMI, body mass index; WC, waist circumference; TC, total cholesterol; TG, triglyceride; HDL-C, low-density lipoprotein; LDL-C, low-density lipoprotein cholesterol; TRLR, triglyceride-rich lipoprotein residue; non-HDL-C, non-high-density lipoprotein cholesterol; ApoB48, apolipoprotein B 48; FBG, fasting blood glucose; FINS, fasting insulin; HOMA-IR homeostasis model assessment of insulin resistance.
Data Sharing Statement
The original contributions presented in the study are included in the article. Further inquiries can be directed to the corresponding author.
Ethics Approval and Informed Consent
The studies involving humans were approved by Hebei General Hospital Ethics Committee. The studies were conducted in accordance with the local legislation and institutional requirements. The participants provided their written informed consent to participate in this study.
Acknowledgments
We deeply appreciate the instructors at the Clinical Medical Research Centre of Hebei General Hospital for their help with this study. We appreciate Editage (www.editage.cn) for English language editing.
Author Contributions
YT: Data curation, Methodology, Writing - original draft, Investigation, Validation; SZ, XH and PT: Formal analysis, Conceptualization, Methodology, Supervision; LR: Conceptualization, Project administration, Writing - review & editing; GS: Conceptualization, Methodology, Supervision, Project administration, Writing-Reviewing and Editing. All authors gave final approval of the version to be published; have agreed on the journal to which the article has been submitted; and agreed to be accountable for all aspects of the work.
Funding
This work was supported by the National Natural Science Foundation of China (82170878).
Disclosure
The authors declare that the research was conducted in the absence of any commercial or financial relationships that could be construed as a potential conflict of interest. The authors have no relevant financial or non-financial interests to disclose.
References
1. Hirode G, Wong RJ. Trends in the prevalence of metabolic syndrome in the United States, 2011–2016. JAMA. 2020;323(24):2526–2528. doi:10.1001/jama.2020.4501
2. Noubiap JJ, Nansseu JR, Lontchi-Yimagou E, et al. Global, regional, and country estimates of metabolic syndrome burden in children and adolescents in 2020: a systematic review and modelling analysis. Lancet Child Adolesc Health. 2022;6(3):158–170. doi:10.1016/S2352-4642(21)00374-6
3. Krishnamoorthy Y, Rajaa S, Murali S, Sahoo J, Kar SS. Association between anthropometric risk factors and metabolic syndrome among adults in India: a systematic review and meta-analysis of observational studies. Prev Chronic Dis. 2022;19:E24. doi:10.5888/pcd19.210231
4. Li S, Zhang TJ, Yang HH, et al. Metabolic syndrome, genetic susceptibility, and risk of chronic obstructive pulmonary disease: the UK Biobank Study. Diabetes Obes Metab. 2023;26(2):482–494. doi:10.1111/dom.15334
5. Shang Y, Grip ET, Modica A, et al. Metabolic syndrome traits increase the risk of major adverse liver outcomes in type 2 diabetes. Diabetes Care. 2024;47(6):978–985. doi:10.2337/dc23-1937
6. Rus M, Crisan S, Andronie-Cioara FL, et al. Prevalence and risk factors of metabolic syndrome: a prospective study on cardiovascular health. Medicina. 2023;59(10):1711. doi:10.3390/medicina59101711
7. Zupkauskiene J, Lauceviciene I, Navickas P, et al. Changes in health-related quality of life, motivation for physical activity, and the levels of anxiety and depression after individualized aerobic training in subjects with metabolic syndrome. Hellenic J Cardiol. 2022;66:41–51. doi:10.1016/j.hjc.2022.04.003
8. Li D, Wang L, Zhou Z, et al. Lifetime risk of cardiovascular disease and life expectancy with and without cardiovascular disease according to changes in metabolic syndrome status. Nutr Metab Cardiovasc Dis. 2022;32(2):373–381. doi:10.1016/j.numecd.2021.10.014
9. Guan YP, Hou XY, Tian PP, et al. Elevated levels of apolipoprotein CIII increase the risk of postprandial hypertriglyceridemia. Front Endocrinol. 2021;12:646185. doi:10.3389/fendo.2021.646185
10. AbdElneam AI, Al-Dhubaibi MS, Bahaj SS, et al. Apo B-48 gene expression and low-density lipoprotein as a factor for increased insulin resistance and severity of acne. GENE. 2023;885:147703. doi:10.1016/j.gene.2023.147703
11. Rodríguez-Mortera R, Caccavello R, Garay-Sevilla ME, et al. Higher ANGPTL3, apoC-III, and apoB48 dyslipidemia, and lower lipoprotein lipase concentrations are associated with dysfunctional visceral fat in adolescents with obesity. Clin Chim Acta. 2020;508:61–68. doi:10.1016/j.cca.2020.05.014
12. Kong X, Cai Y, Li Y, Wang P. Causal relationship between apolipoprotein B and risk of atherosclerotic cardiovascular disease: a mendelian randomization analysis. Health Inf Sci Syst. 2025;13(1):13. doi:10.1007/s13755-024-00323-5
13. Krysa JA, Vine DF, Beilin LJ, et al. ApoB48- remnant lipoproteins are associated with increased cardiometabolic risk in adolescents. Atherosclerosis. 2020;302:20–26. doi:10.1016/j.atherosclerosis.2020.04.021
14. Masuda D, Okada T, Sairyou M, et al. Proteomic analysis of human chylomicron remnants isolated by apolipoprotein B-48 immunoprecipitation. J Atheroscler Thromb. 2025;32(2):226–238. doi:10.5551/jat.64920
15. Taskinen MR, Matikainen N, Björnson E, et al. Contribution of intestinal triglyceride-rich lipoproteins to residual atherosclerotic cardiovascular disease risk in individuals with type 2 diabetes on statin therapy. Diabetologia. 2023;66(12):2307–2319. doi:10.1007/s00125-023-06008-0
16. Wu X, Wilke M, Batara J, et al. Atherogenic ApoB-dyslipidemia, atherosclerotic cardiovascular disease, cardiac dysfunction and remodeling in high-risk young women with and without polycystic ovary syndrome: a pilot study. Front Endocrinol. 2025;16:1520922. doi:10.3389/fendo.2025.1520922
17. Hou XY, Guan YP, Tang Y, et al. A correlation study of the relationships between nonalcoholic fatty liver disease and serum triglyceride concentration after an oral fat tolerance test. Lipids Health Dis. 2021;20(1):54. doi:10.1186/s12944-021-01483-z
18. Quon MJ. Limitations of the fasting glucose to insulin ratio as an index of insulin sensitivity. J Clin Endocrinol Metab. 2001;86(10):4615–4617. doi:10.1210/jcem.86.10.7952
19. Expert Panel on Detection, Evaluation, and Treatment of High Blood Cholesterol in Adults. Executive summary of the third report of The National Cholesterol Education Program (NCEP) expert panel on detection, evaluation, and treatment of high blood cholesterol in adults (Adult Treatment Panel III). JAMA. 2001;285(19):2486–2497. doi:10.1001/jama.285.19.2486
20. Phillips ML, Pullinger C, Kroes I, et al. A single copy of apolipoprotein B-48 is present on the human chylomicron remnant. J Lipid Res. 1997;38:1170–1177. doi:10.1016/S0022-2275(20)37199-6
21. Colivicchi F, Fabbri G, Oliva F, et al. LDL-cholesterol levels and lipid lowering therapy in secondary prevention. Baseline data from the BRING-UP prospective registry. Int J Cardiol. 2025;433:133290. doi:10.1016/j.ijcard.2025.133290
22. Zaiou M. CircRNAs signature as potential diagnostic and prognostic biomarker for diabetes melitus and related cardiovascular complications. Cells. 2020;9(3):2–19. doi:10.3390/cells9030659
23. Thanassoulis G, Welsh RC, Hegele RA. What guidelines say about risk reduction: major data on the link between lipid lowering and outcomes. Can J Cardiol. 2024;40(8S):S13–S19. doi:10.1016/j.cjca.2024.04.023
24. Gugliucci A. The chylomicron saga: time to focus on postprandial metabolism. Front Endocrinol. 2024;14:1322869. doi:10.3389/fendo.2023.1322869
25. Baratta F, Cocomello N, Coronati M, et al. Cholesterol remnants, triglyceride-rich lipoproteins and cardiovascular risk. Int J Mol Sci. 2023;24(5):4268. doi:10.3390/ijms24054268
26. Yang L, Zhang J, Han J, Jiang X. Relationship between lipoprotein B and the severity of coronary microvascular dysfunction. Clin Exp Hypertens. 2025;47(1):2477651. doi:10.1080/10641963.2025.2477651
27. Zhang TX, Hou YL, Liu M, et al. Correlation between the levels of ANGPTL3, ANGPTL4, ANGPTL8 and postprandial Triglyceride-Rich Lipoprotein (TRL). Diabetes Metab Syndr Obes. 2023;16:3979–3993. doi:10.2147/DMSO.S438757
28. Zheng KJ, Li XL, Rong YH, et al. Serum gamma glutamyltransferase: a biomarker for identifying postprandial hypertriglyceridemia. Diabetes Metab Syndr Obes. 2024;17:2273–2281. doi:10.2147/DMSO.S461876
29. Taskinen MR, Boren J. New insights into the pathophysiology of dyslipidemia in type 2 diabetes. Atherosclerosis. 2015;239(2):483–495. doi:10.1016/j.atherosclerosis.2015.01.039
30. Hirata A, Okamura T, Sugiyama D, et al; NIPPON DATA90 Research Group. The relationship between very high levels of serum high-density lipoprotein cholesterol and cause-specific mortality in a 20-year follow-up study of Japanese general population. J Atheroscler Thromb. 2016;23(7):800–809. doi:10.5551/jat.33449
31. Murad MH, Hazem A, Coto-Yglesias F, et al. The association of hypertriglyceridemia with cardiovascular events and pancreatitis: a systematic review and meta-analysis. BMC Endocr Disord. 2012;12:2. doi:10.1186/1472-6823-12-2
32. Masuda D, Nishida M, Arai T, et al. Reference interval for the apolipoprotein B-48 concentration in healthy Japanese individuals. J Atheroscler Thromb. 2014;21:618–627. doi:10.5551/jat.22558
33. Nakano T, Nakajima K, Niimi M, et al. Detection of apolipoproteins B-48 and B-100 carrying particles in lipoprotein fractions extracted from human aortic atherosclerotic plaques in sudden cardiac death cases. Clin Chim Acta. 2008;390:38–43. doi:10.1016/j.cca.2007.12.012
34. Tian J, Chen H, Liu P, Wang C, Chen Y. Fasting apolipoprotein B48 is associated with large artery atherosclerotic stroke: a case-control study. Sci Rep. 2019;9(1):3729. doi:10.1038/s41598-019-40385-0
35. Szili-Torok T, de Borst MH, Soteriou A, Post L, Bakker SJL, Tietge UJF. Apolipoprotein B-48 and late graft failure in kidney transplant recipients. Clin Kidney J. 2024;17(10):sfae289. doi:10.1093/ckj/sfae289
36. Lim S, Kim YJ, Khang AR, Eckel RH. Postprandial dyslipidemia after a standardized high-fat meal in BMI-matched healthy individuals, and in subjects with prediabetes or type 2 diabetes. Clin Nutr. 2021;40(11):5538–5546. doi:10.1016/j.clnu.2021.09.004
37. Vergès B. Intestinal lipid absorption and transport in type 2 diabetes. Diabetologia. 2022;65(10):1587–1600. doi:10.1007/s00125-022-05765-8
38. Ankush G, Nilesh S, Vrutti M. Visceral fat thickness and abdominal girth as an independent determinant of metabolic syndrome: a cross sectional, single-centre study. Int J Radiol Imaging Technol. 2024;10(1):124. doi:10.23937/2572-3235.1510124
39. Masuda D, Sugimoto T, Tsujii K, et al. Correlation of fasting serum apolipoprotein B-48 with coronary artery disease prevalence. Eur J Clin Invest. 2012;42(9):992–999. doi:10.1111/j.1365-2362.2012.02687.x
40. Liu KH, Chan YL, Chan WB, Chan JC, Chu CW. Mesenteric fat thickness is an independent determinant of metabolic syndrome and identifies subjects with increased carotid intima-media thickness. Diabetes Care. 2006;29(2):379–384. doi:10.2337/diacare.29.02.06.dc05-1578
 © 2025 The Author(s). This work is published and licensed by Dove Medical Press Limited. The
full terms of this license are available at https://www.dovepress.com/terms
and incorporate the Creative Commons Attribution
- Non Commercial (unported, 4.0) License.
By accessing the work you hereby accept the Terms. Non-commercial uses of the work are permitted
without any further permission from Dove Medical Press Limited, provided the work is properly
attributed. For permission for commercial use of this work, please see paragraphs 4.2 and 5 of our Terms.
© 2025 The Author(s). This work is published and licensed by Dove Medical Press Limited. The
full terms of this license are available at https://www.dovepress.com/terms
and incorporate the Creative Commons Attribution
- Non Commercial (unported, 4.0) License.
By accessing the work you hereby accept the Terms. Non-commercial uses of the work are permitted
without any further permission from Dove Medical Press Limited, provided the work is properly
attributed. For permission for commercial use of this work, please see paragraphs 4.2 and 5 of our Terms.