Back to Journals » Clinical Ophthalmology » Volume 10
Correlation between short-term and long-term intraocular pressure fluctuation in glaucoma patients
Authors Tojo N, Abe S, Miyakoshi M, Hayashi A ![]()
Received 9 July 2016
Accepted for publication 2 August 2016
Published 2 September 2016 Volume 2016:10 Pages 1713—1717
DOI https://doi.org/10.2147/OPTH.S116859
Checked for plagiarism Yes
Review by Single anonymous peer review
Peer reviewer comments 2
Editor who approved publication: Dr Scott Fraser
Naoki Tojo, Shinya Abe, Mari Miyakoshi, Atsushi Hayashi
Department of Ophthalmology, Graduate School of Medicine and Pharmaceutical Sciences, University of Toyama, Toyama, Japan
Purpose: We investigated correlations between short-term and long-term intraocular pressure (IOP) fluctuations.
Methods: We examined 50 eyes of glaucoma patients who were followed for >2 years. We measured short-term IOP fluctuation using a Triggerfish® contact lens sensor (CLS). The short-term IOP fluctuation (mVeq) was defined as the difference between the maximum value and the minimum value measured during the 24-hour course with CLS. The long-term IOP fluctuation was defined by four parameters: 1) the mean IOP (mmHg) determined during follow-up; 2) the IOP difference, which was defined as the difference between the maximum IOP and the minimum IOP; 3) the standard deviation of IOP; and 4) the peak IOP, which was defined as the maximum IOP. Correlations between these parameters and the short-term IOP fluctuation were examined.
Results: The mean follow-up period was 5.4 years. The average IOP was 15.0±4.0 mmHg. The range of short-term IOP fluctuation identified with CLS was significantly correlated with all the four long-term IOP fluctuation parameters.
Conclusion: Short-term IOP fluctuations were found to be associated with long-term IOP fluctuations. Examination of 24-hour IOP fluctuations with the CLS might be useful for predicting the long-term IOP fluctuation.
Keywords: intraocular pressure, contact lens sensor, Triggerfish®, fluctuation
Introduction
Glaucoma is a leading cause of blindness worldwide.1 Despite the growing understanding of its pathophysiology and advances in its treatment, challenges remain regarding how to predict and stop its progression. The treatment plan for glaucoma depends on its progression rate. In practice, most ophthalmologists determine the glaucoma progression rate based on the results of examinations of the patient’s visual field (VF). It is difficult to predict the rate of glaucoma progression.2 Many studies on the progression of glaucoma have been reported. Candidate factors associated with glaucoma progression include increased baseline intraocular pressure (IOP), increased mean IOP, increased peak IOP, and greater IOP fluctuation.3–8 De Moraes et al reported that the peak IOP is a better predictor of VF deterioration compared to the mean IOP.9 The study is supported by an investigation of an animal model of glaucoma which demonstrated a more predictive role of the maximum IOP in structural change, compared to the mean IOP.10 It is difficult to identify the peak IOP because it might occur while the patient is asleep. If the peak IOP is to be determined using Goldmann applanation tonometry (GAT), the IOP must be measured many times.
The IOP is known to fluctuate, and IOP fluctuation might be a better predictor of the progression of glaucoma than the mean IOP.6,8,11 The existing studies on IOP fluctuation can be divided into short-term (throughout the day) and long-term (several years) studies. The relationship between short-term and long-term IOP fluctuations has not been clear. Long-term IOP fluctuation is measured by reviewing a patient’s medical record. Since an assessment of short-term IOP fluctuation requires that the IOP be measured at night, it burdens both the patient and his or her examiner(s).
Short-term (24-hour) IOP fluctuation can be measured using a contact lens sensor (CLS). The CLS was developed to continuously monitor habitual IOP fluctuations over a 24-hour period by measuring changes in the eye’s circumference in the area of the corneoscleral junction.12,13 Once a CLS is placed on an eye, the IOP fluctuation can be measured automatically without interference with the subject’s sleep. The measurement obtained with a CLS has been shown to be accurate and reproducible.14 In the present study, we investigated the relationship between short-term and long-term IOP fluctuations.
Materials and methods
Subjects
This was a retrospective study. Fifty adult glaucoma patients (25 men, 25 women) were enrolled. All 50 patients underwent a comprehensive ophthalmic examination, including test of refraction and visual acuity, Goldmann gonioscopy, GAT, a fundus examination, and automated perimetry (Humphrey Field Analyzer; Carl Zeiss Meditec AG, Jena, Germany). The study and the research protocol were approved by the Institutional Review Board of the University of Toyama (approval no 23-100), and the procedures used conformed to the tenets of the Declaration of Helsinki. After the nature and possible consequences of the study were explained to the subjects, written informed consent was obtained from each subject.
Inclusion and exclusion criteria
The diagnosis of glaucoma was made if both of the following criteria were satisfied: 1) the presence of glaucomatous optic disk neuropathy (a cup/disk ratio of ≥0.7 or the presence of notching) accompanied by corresponding VF defects, and 2) a threshold SITA 30-2 examination showing a glaucoma hemifield test result “outside normal limits”, and a cluster of three contiguous points on the pattern deviation plot depressed at the P<0.05 level (occurring in age-matched normal subjects) not crossing the horizontal meridian which are compatible with glaucoma.
The inclusion criteria for the subjects were as follows: 1) The subject had best-corrected visual acuity ≥0.2. 2) The subject had spherical equivalent <+6 or >−6 D. In this study, we included patients who had undergone a previous cataract surgery at least 2 years prior to the enrollment in the study. Eyes with myopia over −6 D or hyperopia over +6 D before cataract surgery were excluded. 3) The subject had been followed up for glaucoma for >2 years.
We defined the start of the follow-up period when the patients were diagnosed with glaucoma. For the patients who had underwent a cataract surgery during the follow-up period, we excluded the IOP data obtained before cataract surgery, and used the IOP data obtained after the cataract surgery. We included patients who met the requirement of >2-year follow-up period after the cataract surgery. For the patients who had underwent selective laser trabeculoplasty, we used the IOP data in the same way. We also included the cases in whom the glaucoma medications were changed or added during the follow-up period.
The exclusion criteria were 1) history of glaucoma operation, 2) history of ocular trauma, 3) retinal diseases, and 4) ocular inflammatory diseases.
Measurement of short-term IOP fluctuation with the CLS
Physicians who had been trained in CLS measurement conducted the placement and removal of CLS in each subject in a hospital setting. One eye of each subject was monitored. If both eyes had glaucoma, we measured the eye with the worse VF which also met the inclusion criteria.
The 24-hour IOP was monitored with a Triggerfish® CLS (Sensimed, Lausanne, Switzerland). The CLS consists of a highly oxygen-permeable soft contact lens, the key elements of which are two sensing-resistive strain gauges that are capable of recording circumferential changes in the area of the corneoscleral junction. This device is based on a novel approach to IOP monitoring in which changes in corneal curvature and circumference are assumed to correspond to changes in the IOP. The unit of measurement used for the monitoring of IOP fluctuation with the CLS is not mmHg but mVeq, which is unique to the CLS. The median IOP values were obtained every 5 minutes, providing 288 points over the 24-hour period.
The range of IOP fluctuations, which was defined as the difference between the maximum value (mVeq) and the minimum value measured during the 24-hour course, was calculated from the IOP fluctuation data. The CLS measurements were begun at ~10 am. No restrictions on the subject’s posture during the measurement were imposed. Patients who were taking glaucoma medication continued to take the medication during the measurement period. We defined the number of glaucoma drops as the number of drops prescribed when the subject’s IOP was measured by CLS. We counted a combined eye drop as two medications.
Measurement of long-term IOP fluctuation
The eligible follow-up IOP values that we adopted were measured using GAT. All long-term IOP values were measured within office hours. The long-term IOP fluctuation was defined by four parameters: 1) the mean of the eligible IOP (mmHg) determined during the follow-up; 2) the IOP difference (mmHg), which we defined as the difference between the maximum IOP and the minimum IOP; 3) the standard deviation of IOP (SD-IOP, mmHg) which was calculated from all eligible IOP values; and 4) the peak IOP (mmHg), which was defined as the maximum IOP.
Statistical analyses
All statistical analyses were performed using the JMP 10 software program (SAS Institute Inc., Cary, NC, USA). P-values of <0.05 were considered significant. We used the Spearman rank correlation coefficient for determining the correlation of the long-term IOP fluctuation index and short-term IOP fluctuation.
Results
Ophthalmic data of the patients
We included 50 Japanese patients who had been diagnosed with glaucoma. The ophthalmic data of the patients are shown in Table 1. We classified the subtypes of glaucoma as primary open-angle glaucoma (30 eyes including 15 normal-tension glaucoma eyes), primary angle-closure glaucoma (one eye), and pseudo-exfoliation glaucoma (19 eyes). We defined normal-tension glaucoma as untreated IOP that had never been >21 mmHg among the primary open-angle glaucoma eyes. There was no case of aphakia.
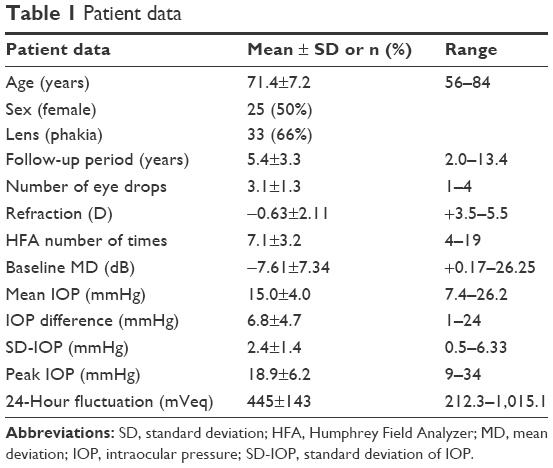 | Table 1 Patient data |
Short-term IOP fluctuations
We were able to successfully measure the 24-hour IOP with the CLS in all of the subjects. The wearing of the CLS resulted in no serious complications related to the CLS. Some subjects had minor complications: conjunctivitis, slight hyperemia, or peripheral corneal edema. These healed within a few days without any additional eye drops.
Correlation of long-term and short-term IOP fluctuations
As shown in Figure 1 and Table 2, the short-term IOP fluctuation was significantly correlated with the mean IOP (P=0.001), the IOP difference (P=0.0207), the SD-IOP (P=0.0061), and the peak IOP (P=0.0017). The short-term and the long-term IOP fluctuations were moderately but significantly correlated.
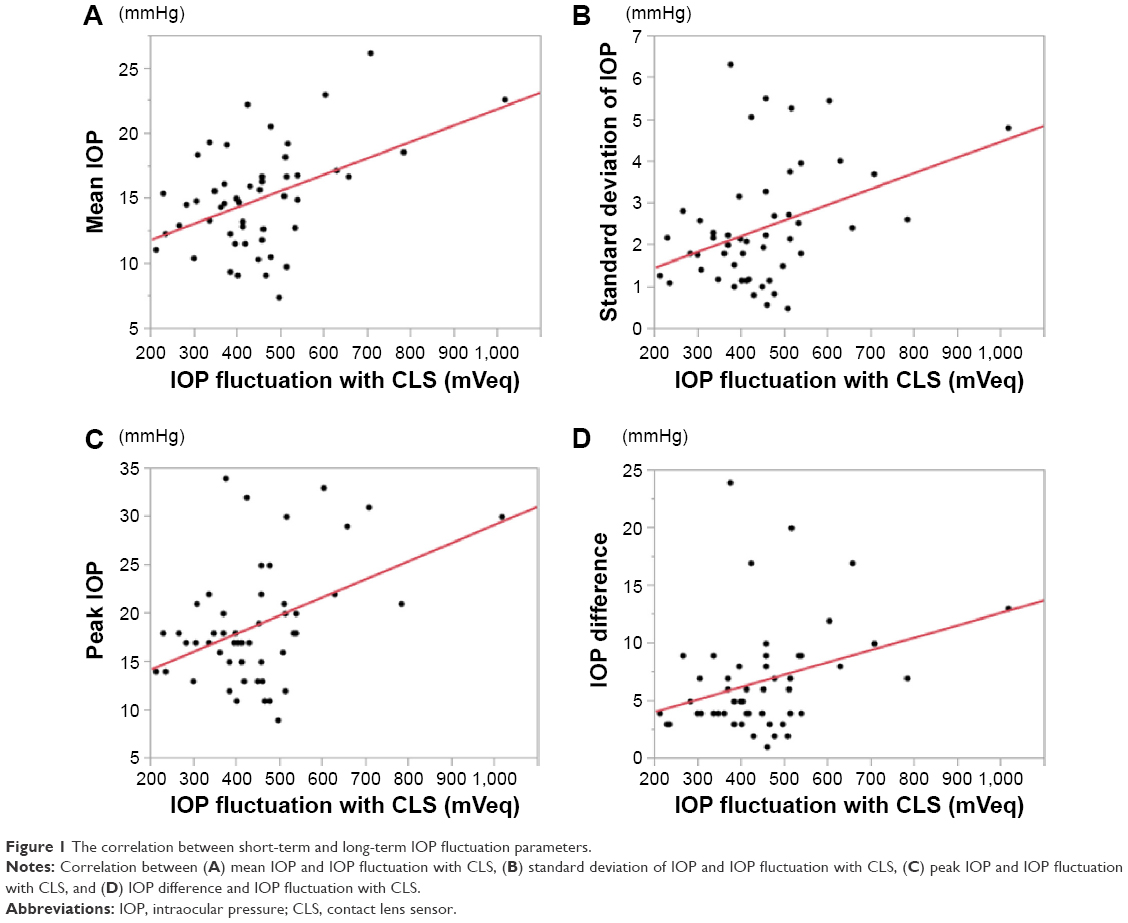 | Figure 1 The correlation between short-term and long-term IOP fluctuation parameters. |
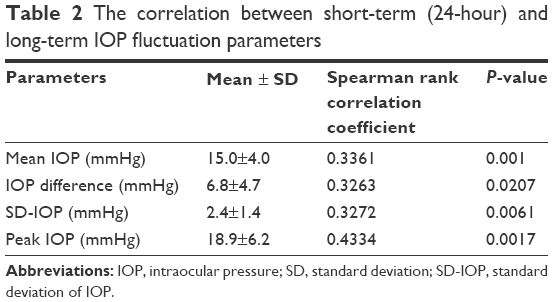 | Table 2 The correlation between short-term (24-hour) and long-term IOP fluctuation parameters |
Discussion
The prior studies on IOP fluctuation were a mix of short-term and long-term studies. It has been difficult to determine the significance of these studies due to lack of standardization regarding the time between assessments, the methods of measurement, and the definition of IOP fluctuation itself. To the best of our knowledge, this study is the first to analyze the relationship between long-term and short-term IOP fluctuations with a CLS. We measured four parameters for determining long-term IOP fluctuations. The mean IOP as well as peak IOP, the IOP difference, and SD-IOP of long-term IOP fluctuation was correlated with the short-term IOP fluctuation measured with a CLS. Thus, the short-term and the long-term IOP fluctuations were significantly correlated.
The long-term IOP fluctuation was shown as a significant risk factor by multiple logistic regression analysis.8,15 Another study showed that peak IOP was a better predictor of progression than mean IOP or IOP fluctuation.9 Some studies reported that the short-term and the long-term IOP fluctuations were correlated in stable glaucoma patients.15–19 These results are in agreement with our present findings.
Tan et al reported that short-term IOP fluctuation correlated with thickness of retinal nerve fiber layer.17 Agnifili et al compared IOP fluctuations between healthy subjects and glaucoma patients. They reported that glaucoma patients showed larger IOP fluctuation than normal subjects.18 The larger IOP fluctuation in both long and short term could predict the rate of deterioration of VF. The only available treatment for glaucoma at present is lowering the IOP, but it does not adequately suppress the progression of glaucoma.8,9 Since a new treatment modality to reduce the IOP fluctuation is required, it may be necessary to use a CLS to measure IOP fluctuations.
Measuring the IOP fluctuation with a CLS could thus become a standard method of measuring short-term IOP fluctuation. This method has several merits: IOP fluctuation can be measured every 5 minutes rather than every few hours. IOP fluctuation can be measured without interfering with the CLS wearer’s sleep. No restriction is imposed on the subject’s posture during the measurement. Even though the obtained values are objective (mVeq), short-term IOP fluctuations measured with a CLS might help to predict long-term IOP fluctuations.
Limitations
Our study has some limitations. First, we did not consider a change or addition of the eye drops. It was reported that glaucoma medication could make the circadian IOP fluctuation smaller.20 Holló et al reported that a CLS could not measure the effect of topical medication or body position.21 Adherence of a CLS to the cornea might alter the effects of topical medications. Second, short-term IOP fluctuation was assessed with a CLS on different days, although some studies reported a good reproducibility of the results of short-term IOP fluctuation with a CLS.22–25 Third, the value in mVeq measured with a CLS cannot be converted to mmHg. Mottet et al reported that the IOP measurement using a CLS is an accurate and reproducible method to characterize the IOP rhythm but does not allow estimating the IOP value in mmHg corresponding to the relative variation of the electrical signal measured.14 To address these problems, further studies are necessary.
Conclusion
In conclusion, long-term and short-term IOP fluctuations were significantly correlated. Measuring IOP fluctuation with a CLS could be useful to predict long-term IOP fluctuation. This might be of some help in deciding a glaucoma treatment.
Disclosure
The authors report no conflicts of interest in this work.
References
Quigley HA, Vitale S. Vitale models of open-angle glaucoma prevalence and incidence in the United States. Invest Ophthalmol Vis Sci. 1997;38(1):83–91. | ||
Naka M, Kanamori A, Tatsumi Y, et al. Comparison of mean deviation with AGIS and CIGTS scores in association with structural parameters in glaucomatous eyes. J Glaucoma. 2009;18(5):379–384. | ||
Bengtsson B, Leske MC, Hyman L, Heijl A; Early Manifest Glaucoma Trial Group. Fluctuation of intraocular pressure and glaucoma progression in the early manifest glaucoma trial. Ophthalmology. 2007;114(2):205–209. | ||
Nouri-Mahdavi K, Hoffman D, Coleman AL, et al. Predictive factors for glaucomatous visual field progression in the Advanced Glaucoma Intervention Study. Ophthalmology. 2004;111(9):1627–1635. | ||
Leske MC, Heijl A, Hussein M, et al. Factors for glaucoma progression and the effect of treatment: the early manifest glaucoma trial. Arch Ophthalmol. 2003;121(1):48–56. | ||
Caprioli J, Coleman AL. Intraocular pressure fluctuation – a risk factor for visual field progression at low intraocular pressures in the advanced glaucoma intervention study. Ophthalmology. 2008;115(7):1123–1129. | ||
Musch DC, Gillespie BW, Niziol LM, Lichter PR, Varma R; CIGTS Study Group. Intraocular pressure control and long-term visual field loss in the Collaborative Initial Glaucoma Treatment Study. Ophthalmology. 2011;118(9):1766–1773. | ||
Komori S, Ishida K, Yamamoto T. Results of long-term monitoring of normal-tension glaucoma patients receiving medical therapy: results of an 18-year follow-up. Graefes Arch Clin Exp Ophthalmol. 2014;252(12):1963–1970. | ||
De Moraes CG, Juthani VJ, Liebmann JM, et al. Risk factors for visual field progression in treated glaucoma. Arch Ophthalmol. 2011;129(5):562–568. | ||
Gardiner SK, Fortune B, Wang L, Downs JC, Burgoyne CF. Intraocular pressure magnitude and variability as predictors of rates of structural change in non-human primate experimental glaucoma. Exp Eye Res. 2012;103:1–8. | ||
Lee J, Kong M, Kim JL, Kee C. Comparison of visual field progression between relatively low and high intraocular pressure groups in normal tension glaucoma patients. J Glaucoma. 2014;23(8):553–560. | ||
Mansouri K, Shaarawy T. Continuous intraocular pressure monitoring with a wireless ocular telemetry sensor: initial clinical experience in patients with open angle glaucoma. Br J Ophthalmol. 2011;95(5):627–629. | ||
Leonardi M, Pitchon EM, Bertsch A, Renaud P, Mermoud A. Wireless contact lens sensor for intraocular pressure monitoring: assessment on enucleated pig eyes. Acta Ophthalmol. 2009;87(4):433–437. | ||
Mottet B, Aptel F, Romanet JP, Hubanova R, Pépin JL, Chiquet C. 24-Hour intraocular pressure rhythm in young healthy subjects evaluated with continuous monitoring using a contact lens sensor. JAMA Ophthalmol. 2013;131(12):1507–1516. | ||
Hong S, Kim CY, Seong GJ. Long-term intraocular pressure fluctuation and visual field progression in glaucoma patients with low intraocular pressure after post-trabeculectomy phacoemulsification. J Ocul Pharmacol Ther. 2007;23(6):571–576. | ||
Asrani S, Zeimer R, Wilensky J, Gieser D, Vitale S, Lindenmuth K. Large diurnal fluctuations in intraocular pressure are an independent risk factor in patients with glaucoma. J Glaucoma. 2000;9(2):134–142. | ||
Tan S, Yu M, Baig N, Chan PP, Tang FY, Tham CC. Circadian intraocular pressure fluctuation and disease progression in primary angle closure glaucoma. Invest Ophthalmol Vis Sci. 2015;56(8):4994–5005. | ||
Agnifili L, Mastropasqua R, Frezzotti P, et al. Circadian intraocular pressure patterns in healthy subjects, primary open angle and normal tension glaucoma patients with a contact lens sensor. Acta Ophthalmol. 2015;93(1):e14–e21. | ||
Fogagnolo P, Orzalesi N, Centofanti M, Oddone F, Manni G, Rossetti L. Short- and long-term phasing of intraocular pressure in stable and progressive glaucoma. Ophthalmologica. 2013;230(2):87–92. | ||
Konstas AG, Tsironi S, Vakalis AN, et al. Intraocular pressure control over 24 hours using travoprost and timolol fixed combination administered in the morning or evening in primary open-angle and exfoliative glaucoma. Acta Ophthalmol. 2009;87(1):71–76. | ||
Holló G, Kóthy P, Vargha P. Evaluation of continuous 24-hour intraocular pressure monitoring for assessment of prostaglandin-induced pressure reduction in glaucoma. J Glaucoma. 2014;23(1):e6–e12. | ||
Magacho L, Toscano DA, Freire G, Shetty RK, Avila MP. Comparing the measurement of diurnal fluctuations in intraocular pressure in the same day versus over different days in glaucoma. Eur J Ophthalmol. 2010;20(3):542–545. | ||
Xu S, Jiao Q, Cheng Y, Sun J, Lu Q, Zhong Y. Short-term reproducibility of twenty-four-hour intraocular pressure curves in untreated patients with primary open-angle glaucoma and ocular hypertension. PLoS One. 2015;10(10):e0140206. | ||
Mansouri K, Medeiros FA, Tafreshi A, Weinreb RN. Continuous 24-hour monitoring of intraocular pressure patterns with a contact lens sensor: safety, tolerability, and reproducibility in patients with glaucoma. Arch Ophthalmol. 2012;130(12):1534–1539. | ||
De Smedt S, Mermoud A, Schnyder C. 24-Hour intraocular pressure fluctuation monitoring using an ocular telemetry sensor: tolerability and functionality in healthy subjects. J Glaucoma. 2012;21(8):539–544. |
 © 2016 The Author(s). This work is published and licensed by Dove Medical Press Limited. The
full terms of this license are available at https://www.dovepress.com/terms
and incorporate the Creative Commons Attribution
- Non Commercial (unported, 3.0) License.
By accessing the work you hereby accept the Terms. Non-commercial uses of the work are permitted
without any further permission from Dove Medical Press Limited, provided the work is properly
attributed. For permission for commercial use of this work, please see paragraphs 4.2 and 5 of our Terms.
© 2016 The Author(s). This work is published and licensed by Dove Medical Press Limited. The
full terms of this license are available at https://www.dovepress.com/terms
and incorporate the Creative Commons Attribution
- Non Commercial (unported, 3.0) License.
By accessing the work you hereby accept the Terms. Non-commercial uses of the work are permitted
without any further permission from Dove Medical Press Limited, provided the work is properly
attributed. For permission for commercial use of this work, please see paragraphs 4.2 and 5 of our Terms.