Back to Journals » Journal of Inflammation Research » Volume 18
Correlation Between Red Blood Cell Distribution Width to Albumin Ratio and Cardiovascular Events in Maintenance Hemodialysis Patients
Authors Guo H, Chen F, Zeng C, Wang Y, Ding M, Zhang N, Wu X, Wang X
Received 3 September 2025
Accepted for publication 3 November 2025
Published 26 November 2025 Volume 2025:18 Pages 16509—16518
DOI https://doi.org/10.2147/JIR.S562750
Checked for plagiarism Yes
Review by Single anonymous peer review
Peer reviewer comments 2
Editor who approved publication: Dr Wenjian Li
Hui Guo,1,* Fuhua Chen,1,* Chuchu Zeng,1 Yonglan Wang,1 Miao Ding,1 Nan Zhang,1 Xianfeng Wu,2 Xiaoxia Wang1
1Department of Nephrology, Tongren Hospital, Shanghai Jiao Tong University School of Medicine, Shanghai, 200336, People’s Republic of China; 2Department of Nephrology, Shanghai Eighth People Hospital, Jiangsu University, Shanghai, 200235, People’s Republic of China
*These authors contributed equally to this work
Correspondence: Xianfeng Wu, Email [email protected] Xiaoxia Wang, Email [email protected]
Objective: To investigate the correlation between red blood cell distribution width to albumin ratio (RAR) and cardiovascular events (CVEs) in maintenance hemodialysis (MHD) patients.
Methods: Clinical data were retrospectively collected from MHD patients in Tongren Hospital, Shanghai Jiao Tong University School of Medicine from January 1, 2017 to May 31, 2024. The prognostic endpoints in this study were CVEs. Kaplan-Meier survival curve, Cox regression model, restricted cubic spline analyses and subgroup analysis were used to analyze the independent relationship between RAR and CVEs.
Results: A total of 237 MHD patients were included. The median follow-up was 22 (6, 45) months, and CVEs occurred in 100 patients (100/237, 42.2%). The population was divided into Tertile1, 2, and 3 according to the tertiles of baseline RAR levels. Kaplan-Meier survival curve showed a significant difference in the cumulative survival free of CVEs among the tertiles (p=0.0096). Multivariate Cox regression model showed that RAR was an independent risk factor for CVEs in MHD patients (HR=1.336, 95% CI 1.090, 1.638, p=0.005). Compared with Tertile 1 (RAR< 3.75), Tertile 3 (RAR≥ 4.46) was associated with an increased risk of CVEs (HR=1.909, 95% CI 1.074, 3.394, p=0.028). The adjusted restricted cubic spline analysis indicated that the relationship of RAR with CVEs was linear (p for nonlinearity = 0.402). In the subgroup analysis, an interaction effect of RAR and gender was observed.
Conclusion: Elevated RAR is an independent risk factor for CVEs in MHD patients, and RAR may be helpful for early detection of CVEs risk in MHD patients, although sex differences should be taken in account.
Keywords: red blood cell distribution width, albumin, hemodialysis, cardiovascular events
Background
Maintenance hemodialysis (MHD) is an important means of renal replacement therapy for patients with end-stage renal disease (ESRD).1 The China Kidney Disease Network 2016 Annual Data Report showed that patients on MHD accounted for 91.94% of all patients on dialysis.1 The number of patients on MHD reached 735,000 in 2021 in China, ranking the highest worldwide.2 Globally, including in China, the number of chronic kidney disease (CKD) and ESRD patients are increasing annually, and the clinical and economic burden of MHD continue to increase.3 Compared with the general population, patients with CKD suffer from more common and severe cardiovascular diseases, and cardiovascular events (CVEs) are the leading cause of death in patients with ESRD.4 Therefore, identifying effective risk factors that can predict CVEs in MHD patients is particularly important.
The relationship between inflammation and CVEs has been extensively studied.5 Evidence has demonstrated that inflammation is a well-recognized nontraditional risk factor that contributes to excessive cardiovascular mortality in dialysis patients.6 Inflammation accelerates atherosclerosis progression, promotes vascular and heart valve calcification and aggravates protein-energy wasting.7 Dialysis patients often develop protein-energy wasting and malnutrition due to factors such as chronic inflammation, inadequate dietary intake and metabolic acidosis.8 Since malnutrition may amplify systemic inflammation, inflammation and malnutrition are closely related through interaction, leading to a vicious cycle.9
Red blood cell distribution width (RDW) represents the heterogeneity of red blood cell volume. Studies have confirmed that RDW is an indicator reflecting malnutrition and inflammation, and is an independent risk factor for CVEs in CKD patients and death in dialysis patients.10–12 Serum albumin (ALB), synthesized by the liver, is a key marker of nutritional status. Researches have shown that low albumin levels are a strong predictor of mortality in both the general population and CKD patients.13,14 The RDW to ALB ratio (RAR), a joint indicator of RDW and ALB, is a novel biomarker related to systemic inflammation and nutritional status.15 RAR has been reported to have good predictive value for the prognosis of various populations, including patients with CKD, cardiovascular disease, cancer, acute pancreatitis, diabetic retinopathy and diabetic ketoacidosis.16–21 Currently, it remains unclear whether RAR is associated with CVEs in MHD patients. This study aims to explore the correlation between RAR and CVEs in MHD patients, in order to provide a basis for early intervention of CVEs in MHD patients.
Methods
Study Design and Participants
In this retrospective cohort study, the inclusion criteria were patients who received MHD in Tongren Hospital, Shanghai Jiao Tong University School of Medicine from January 1, 2017 to May 31, 2024. The exclusion criteria were as follows: (1) patients aged<18 years at the start of MHD; (2) patients who underwent MHD therapy for less than 3 months; (3) patients with acute cardiovascular events, active infection, active bleeding, malignancies, severe liver diseases, hematological diseases or active autoimmune diseases; (4) incomplete data on RDW or ALB. (5) history of blood transfusion 3 months before enrollment; (6) iron, folic acid and other drugs that may affect RDW were taken 3 months before enrollment. (7) from peritoneal dialysis to hemodialysis. Finally, 237 patients were included in the study and followed up until the endpoint or August 31, 2024 (Figure 1). This study was performed in accordance with the ethical standards of the Helsinki Declaration and its later amendments. The study was approved by the Ethics Committee of Tongren Hospital, Shanghai Jiao Tong University School of Medicine (Ethics approval number: K2025-023-01). Ethics committee waived the need for informed consent because it was a retrospective study, and no privacy issues were involved. This study adhered to the Reporting of studies Conducted using Observational Routinely-collected Data (RECORD) guidelines. The manuscript was prepared with reference to the RECORD checklist, and the required information is reported accordingly.
 |
Figure 1 Flow diagram of the study. |
Data Collection and Definitions
The data were retrieved retrospectively. Baseline demographic data and laboratory indicators included sex, age, body mass index (BMI), systolic blood pressure (SBP), diastolic blood pressure (DBP), history of hypertension, history of diabetes, history of cardiovascular disease (CVD), medications use (including angiotensin-converting enzyme inhibitor/angiotensin receptor blocker [ACEI/ARB], calcium channel blocker [CCB], β-blocker, ɑ-blocker, diuretic and aspirin), follow-up time, blood white blood cell count (WBC), hemoglobin (Hb), RDW, blood platelet count (PLT), C-reactive protein (CRP), serum albumin (ALB), estimated glomerular filtration rate (eGFR), serum creatinine (SCr), serum uric acid (SUA), serum potassium (K), serum calcium (Ca), serum phosphorus (P), parathyroid hormone (PTH), high-sensitivity cardiac troponin I (hs-cTnI), brain natriuretic peptide (BNP), total cholesterol (TC), triglycerides (TG), high-density lipoprotein (HDL), low-density lipoprotein (LDL), iron, ferritin, folic acid and vitamin B12. The data were retrieved from one month prior to initiating MHD. The formula for calculating BMI is weight/height2 (kg/m2). eGFR was calculated according to the CKD-EPI formula.22 eGFR (mL/min/1.73m2)=175×SCr (mg/dL)−1.234×age−0.179×0.79 (female). The history of CVD includes coronary atherosclerotic heart disease, heart failure, stroke and peripheral artery disease. The calculation formula of RAR is RDW (%) /ALB (g/dL).
Study Outcome
The primary outcome was CVEs, including acute coronary syndrome, congestive heart failure, malignant arrhythmia, cerebrovascular disease, aortic dissection, aortic aneurysm, peripheral artery disease and cardiovascular death. Data on CVEs were extracted from the electronic medical records of our hospital and followed up until the first CVEs occurrence. Patients without CVEs were followed up until non-cardiovascular death, transfer to peritoneal dialysis, kidney transplantation or other centers, loss to follow-up, or the end of follow-up (August 31, 2024), whichever occurred first.
Statistical Analysis
The population was divided into Tertile1, 2, and 3 according to the tertiles of baseline RAR levels (Tertile1: RAR<3.75, Tertile2: 3.75≤RAR<4.46, Tertile3: RAR≥4.46). Continuous variables were expressed as the mean±standard deviation if normally distributed or median (25–75% interquartile range) if not normally distributed. Categorical variables were expressed as frequencies and percentages. Chi-squared, one-way ANOVA or Kruskal–Wallis tests were used to test for differences in categorical or continuous factors among the tertiles. Kaplan-Meier curves were used to compare the cumulative survival free of CVEs among the tertiles. Differences were assessed using the Log rank test. Factors associated with CVEs were examined using univariate and multivariate Cox regression models. The Restricted cubic spline (RCS) analysis was used to assess the linear relationship between RAR and CVEs. In the subgroup analyses, the groups were stratified by sex (male or female), age (<65 or ≥65 years old), BMI (<24 or ≥24kg/m2), history of diabetes (with or without), history of CVD (with or without). Statistical analyses were conducted using the Statistical Package Social Science Version 29.0 (IBM SPSS 29.0) and the R package 4.4.2 (https://www.r-project.org/). The tests were performed with a bilateral approach and the level of statistical significance was set at p <0.05.
Results
Baseline Characteristics of the Study Population
237 MHD patients were included in this study. The mean age was 67.6 (57.5, 73.0) years, among whom 165 were male (69.6%), 216 patients (91.1%) with a history of hypertension, 143 patients (60.3%) with a history of diabetes and 119 patients (50.2%) with a history of CVD. Table 1 summarizes the demographic and clinical characteristics stratified by RAR tertiles. Compared with Tertile 1, patients in Tertile 3 exhibited a higher prevalence of diabetes and CVD history. Additionally, Tertile 3 showed significantly higher levels of SBP, DBP, CRP, eGFR, BNP and VB12, along with lower SCr level (p <0.05 for each).
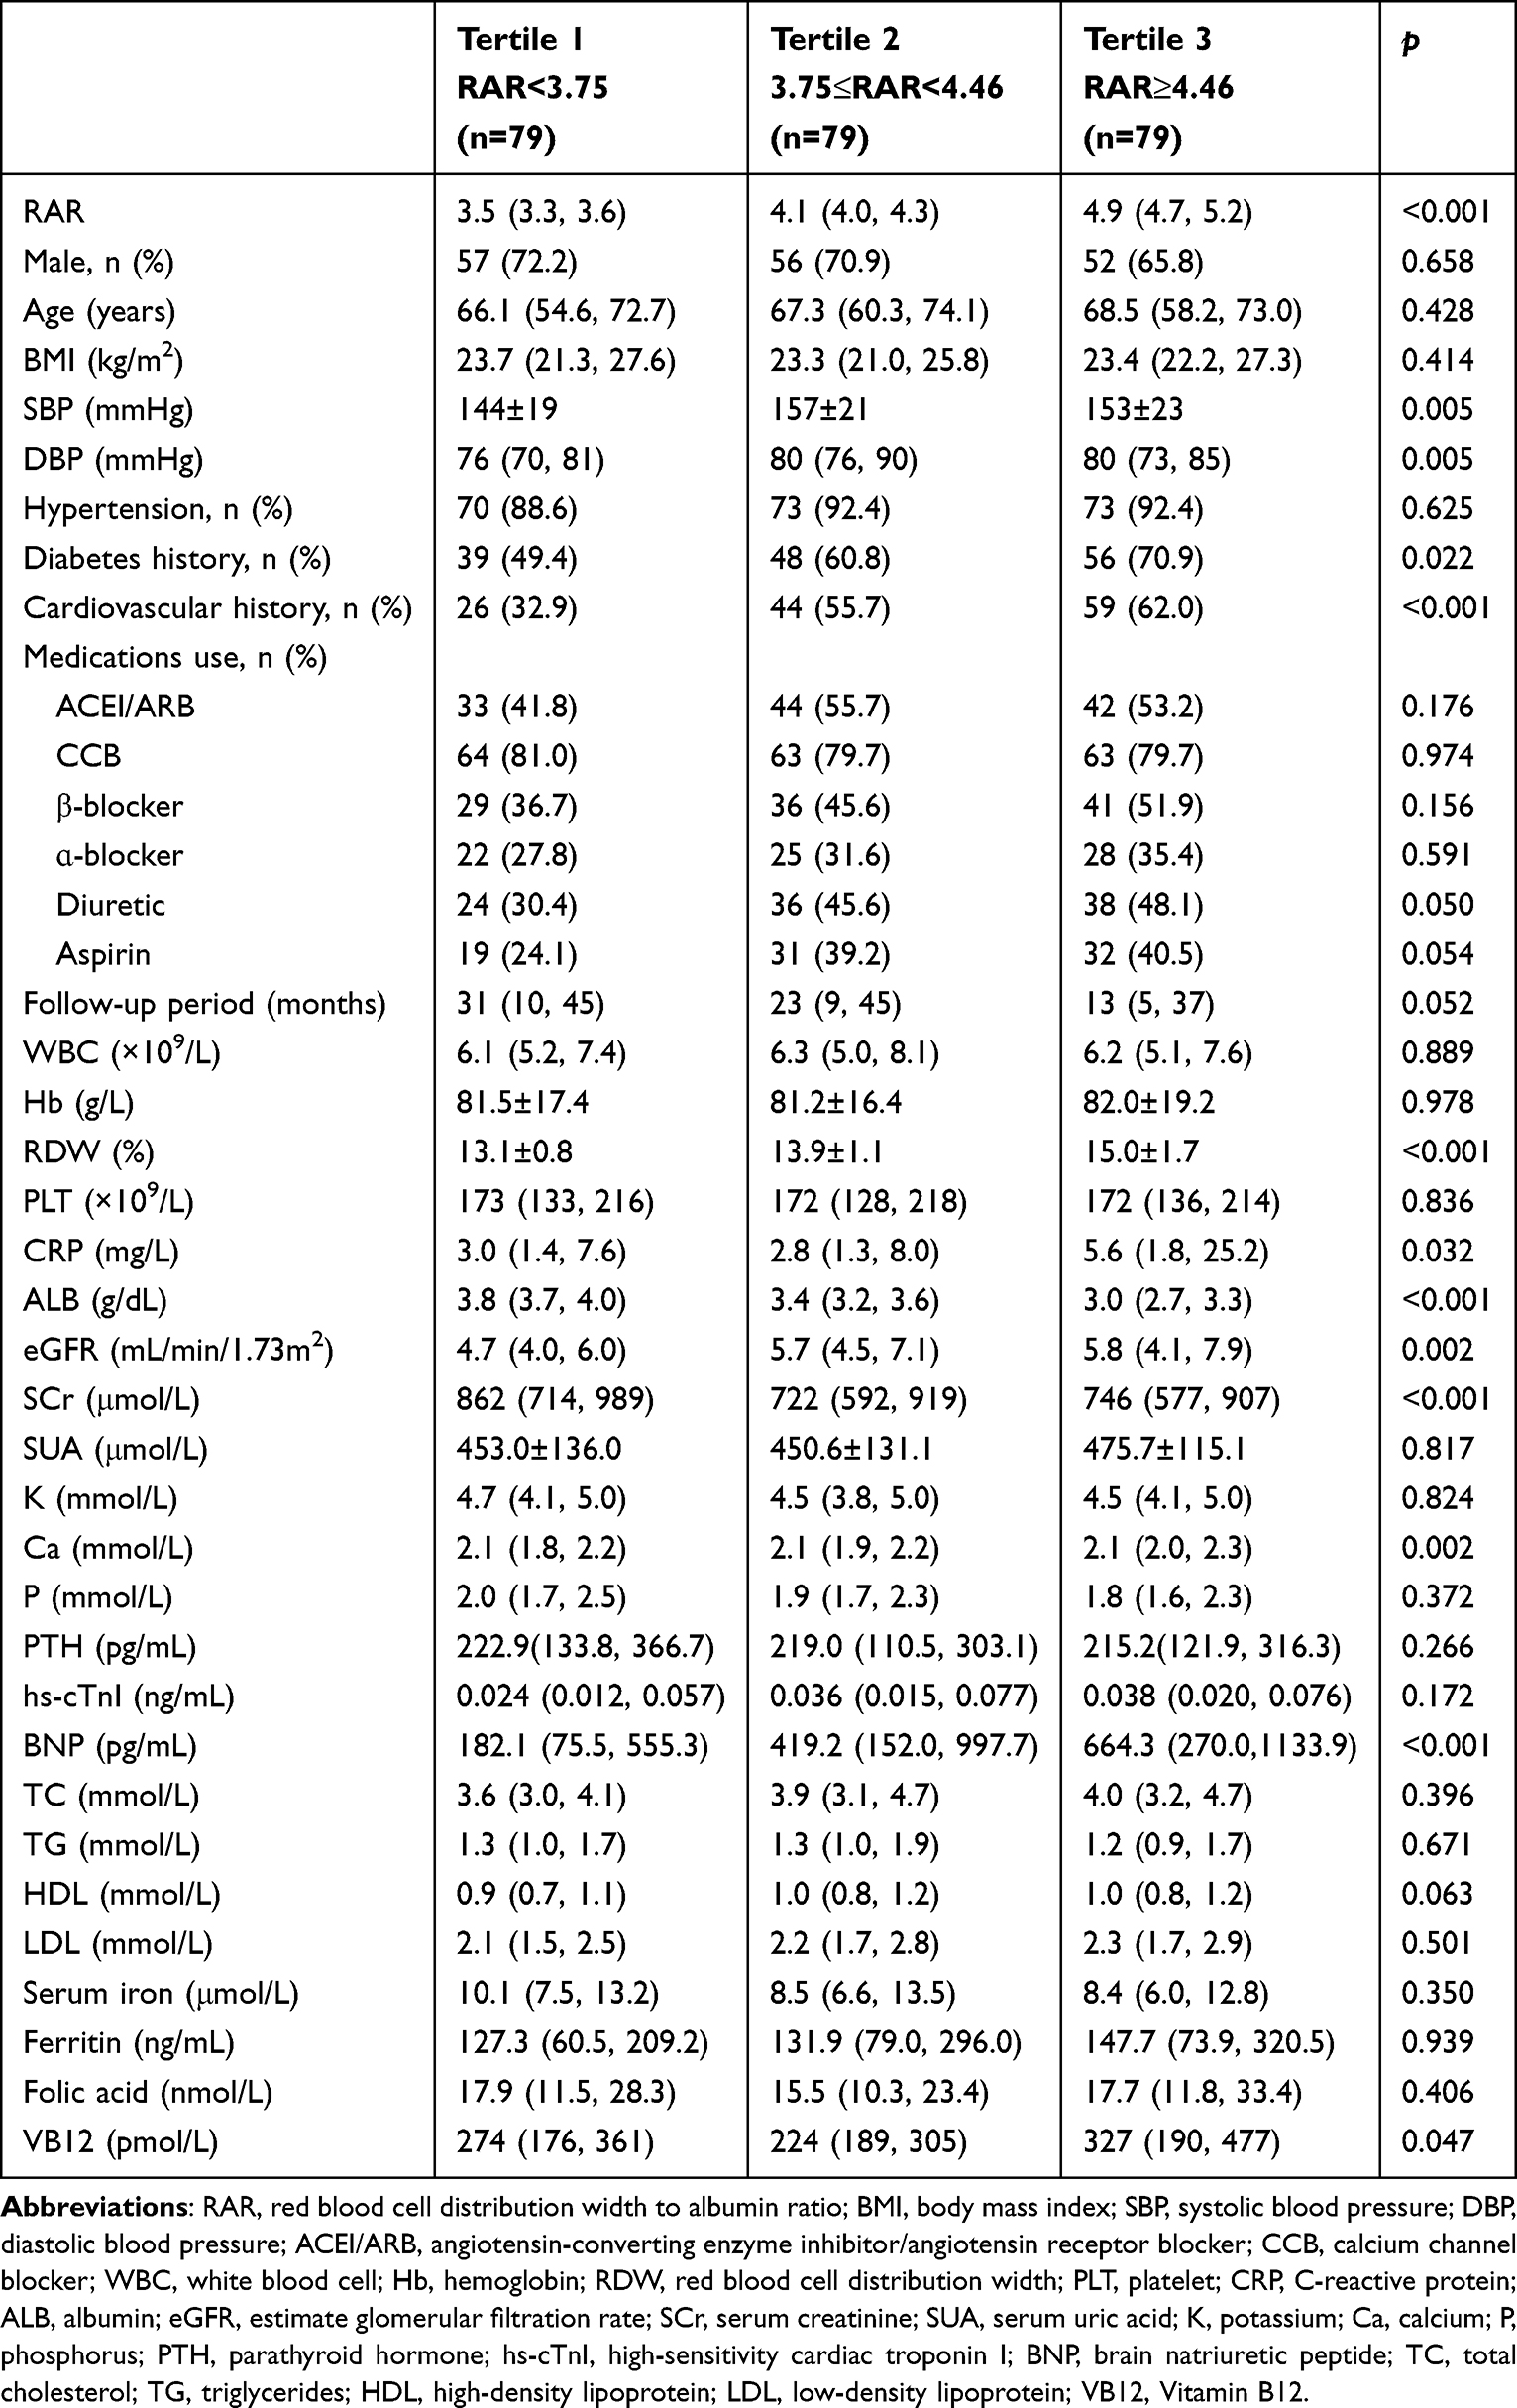 |
Table 1 Baseline Characteristics of the Study Participants Stratified by RAR Tertile |
The Relationship Between RAR and CVEs
The median follow-up was 22 (6, 45) months. During the follow-up period, CVEs occurred in 100 patients (100/237, 42.2%). In the population without CVEs, 18 patients died of non-cardiovascular causes, 2 patients received kidney transplantation, 11 patients transferred to other centers, and 11 patients were loss of follow-up. The number of CVEs was 24 in Tertile 1, 37 in Tertile 2, and 39 in Tertile 3, respectively. The Kaplan-Meier survival analysis and Log rank test revealed that the cumulative survival free of CVEs was significantly different among three groups (log rank=9.348, p=0.0096) (Figure 2). The incidence of CVEs in Tertile 2 and Tertile 3 were higher than that in Tertile1 (log rank=4.513, p=0.034; log rank=5.940, p=0.015). However, there was no significant difference observed between Tertile 2 and Tertile 3 (log rank=0.101, p=0.750).
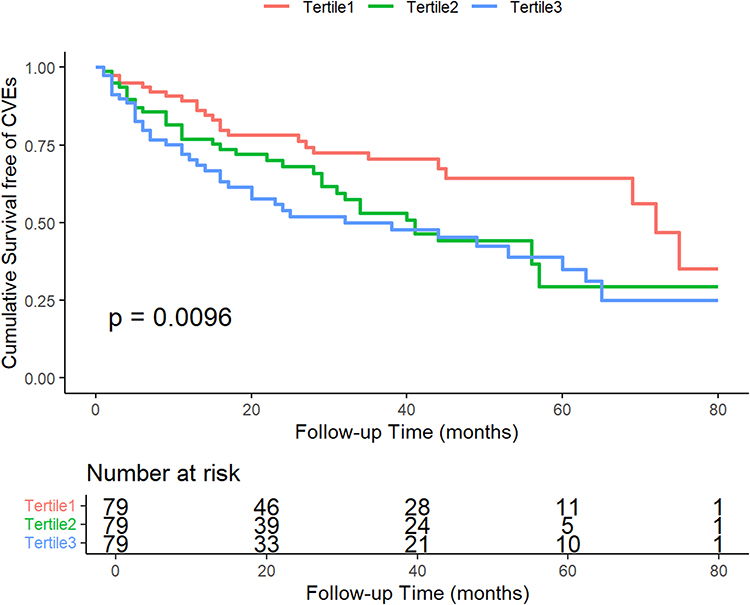 |
Figure 2 Kaplan-Meier curves of Cumulative Survival free of CVEs stratified by RAR. |
The correlation between the RAR and CVEs was demonstrated using Cox regression models. The univariate analysis revealed that RAR was a risk factor for CVEs (HR=1.334, 95% CI 1.137, 1.566, p<0.001). In addition, diabetes history (HR=1.675, 95% CI 1.098, 2.555, p=0.017), CVD history (HR=2.364, 95% CI 1.566, 3.569, p<0.001), use of CCB (HR=1.835, 95% CI 1.041, 3.233, p=0.036), α-blocker (HR=1.672, 95% CI 1.116, 2.506, p=0.013), aspirin (HR=1.557, 95% CI 1.050, 2.311, p=0.028), and WBC count (HR=1.087, 95% CI 1.013, 1.166, p=0.021) were associated with CVEs. After adjusting for age, sex, BMI, hypertension history, diabetes history, cardiovascular history, medications (ACEI/ARB, CCB, β-blocker, ɑ-blocker, diuretic, aspirin), WBC, Hb, CRP, Ca, P, PTH and eGFR, the multivariable Cox regression analysis revealed that higher RAR levels were independently associated with increased risk of CVEs (HR=1.336, 95% CI 1.090, 1.638, p=0.005). After adjusting for the above mentioned confounding factors in Model 3, RAR≥4.46 (Tertile 3) was associated with a 90.9% (95% CI: 1.074, 3.394, p=0.028) higher risk of CVEs (Table 2).
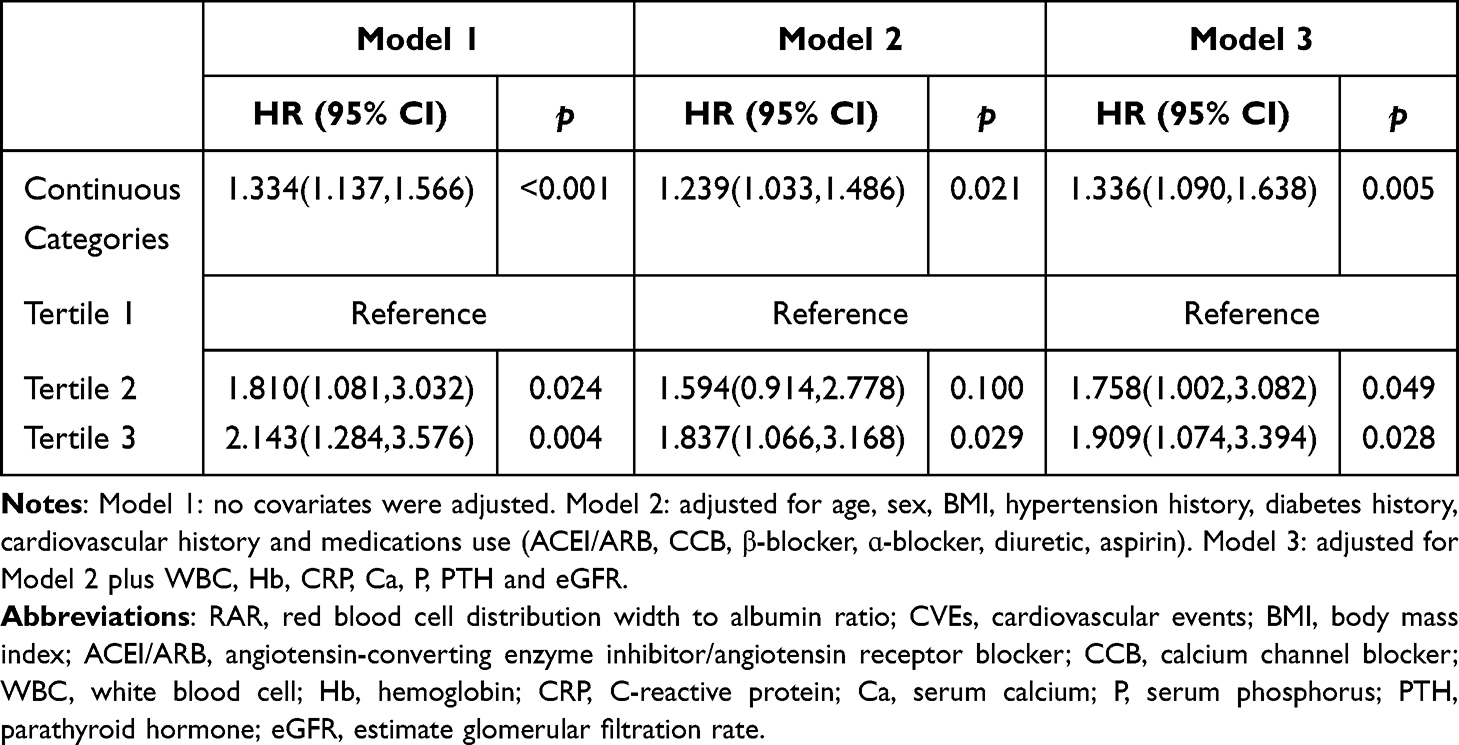 |
Table 2 Cox Regression Analysis of RAR and CVEs |
The RCS analysis showed that RAR levels and CVEs were positively and linearly correlated after adjusting for confounding factors in Model 3 (p for nonlinearity=0.402). The CVEs rate increased with increasing RAR levels (Figure 3). The RCS plot had a knot at 4.12. When the RAR value was below 4.12, the HR was less than 1. When the RAR value exceeded 4.12, the HR was greater than 1 and increased as RAR increased.
 |
Figure 3 Restricted cubic spline analyses of the relationship between RAR and CVEs. |
Subgroup and Interaction Analyses
In the subgroup analysis, no statistically significant interactions were observed for age, BMI, diabetes, and history of CVD subgroups. A significant interaction by sex was observed (P for interaction = 0.023). Elevated RAR level was significantly associated with an increased risk of CVEs in female MHD patients (HR=3.03, 95% CI 1.39, 6.64), whereas no significant association was found in males (HR=1.18, 95% CI 0.92, 1.52) (Figure 4).
 |
Figure 4 Forest plot of the relationship between RAR and CVEs in different subgroups. The P for interaction corresponds to the interaction test between the RAR and the subgroups variable of interest. |
Discussion
The RAR has been identified as a risk factor for poor prognosis of various populations. To our knowledge, this is the first study to evaluate the prognostic implications of RAR in MHD patients. Our study suggested that higher RAR values were associated with CVEs in MHD patients. RAR may be a useful prognostic biomarker for MHD patients. RAR may serve as a complementary biomarker alongside established cardiovascular risk scores, such as the AROii score,23 to stratify MHD patients for more intensive cardiovascular monitoring and management.
In CKD patients, factors such as metabolic abnormalities, inflammation, oxidative stress, endothelial dysfunction, vascular calcification, and malnutrition may be the pathophysiological mechanisms leading to a high incidence of CVEs.24,25 Hemodialysis is one of the important renal replacement treatment options for ESRD patients. However, hemodialysis cannot completely remove metabolic toxins in the blood. These toxins can activate inflammatory pathways and pathophysiological mechanisms dominated by inflammation, such as oxidative stress and endothelial dysfunction, which can induce the occurrence of CVEs including atherosclerosis, heart failure, arrhythmia and vascular calcification.7 RDW is an indicator of red blood cell volume heterogeneity and is usually combined with mean red blood cell volume to identify the causes of anemia. With the progress of research, RDW has been confirmed to be an indicator reflecting malnutrition and inflammation. The mechanism of elevated RDW in dialysis patients is complex. Previous studies26 have shown that RDW may reflect the following pathological states: anemia and anemia-related nutritional deficiencies, abnormal erythropoietin production or poor erythropoietin response, hypoxia, oxidative stress, endothelial dysfunction, inflammation, malnutrition, volume status, aging, decreased physiological reserve capacity, thrombosis and increased red blood cell fragmentation. All these pathological conditions are prevalent in dialysis patients and may affect erythropoiesis and erythrocyte survival directly or indirectly, thereby leading to an increase of RDW. Elevated RDW is associated with poor prognosis in MHD patients. A retrospective observational study of 109,675 adult HD patients found a robust, consistent and linear relationship between baseline and time-varying RDW and mortality.11 As RDW increased, the risk of death also increased. Baseline characteristics stratified by the five RDW categories. The highest baseline RDW (RDW≥17.5%) was associated with the highest risk of mortality when compared with the reference group (15.5–16.5%)(adjusted hazard ratio [HRs]=1.28, 95% CI 1.24,1.33). Higher time-varying RDW was also incrementally associated with higher all-cause mortality risk in all levels of adjustment. Mo L, et al27 studied the relationship between RDW and cerebral stroke risk in hemodialysis patients. 442 MHD patients was followed up for 50 months. Compared with non-stroke patients, a significantly higher RDW was measured in patients with cerebral stroke and cerebral infarction. Multivariate Cox regression analysis showed that patients with the highest mean RDW quartile had a 2.55-fold (HR=3.55; 95% CI 1.33,9.51) higher risk of developing cerebral infarction relative to those with the lowest mean RDW quartile, while RDW was not an independent risk factor for cerebral hemorrhage.
Serum albumin is synthesized by the liver and is a key protein for maintaining plasma colloid osmotic pressure and material transport. A reduction in serum ALB level may be related to blood volume overload, chronic inflammation, liver congestion, malnutrition, and cachexia. Malnutrition, protein loss and inflammation may be the potential mechanisms by which hypoalbuminemia leads to an increased risk of CVEs. Studies have shown that hypoalbuminemia is independently associated with an increased risk of CVEs in ESRD patients.28
As a combination of RDW and ALB, RAR is a low-cost, easy-to-use laboratory indicator in clinical work. RAR is a novel composite inflammation and nutrition biomarker and may be a superior tool to predict poor prognosis in different populations. In ESRD patients, there is a strong relationship between malnutrition, inflammation, and atherosclerosis, known as the malnutrition-inflammation-atherosclerosis syndrome, which is associated with an exceptionally high mortality rate.29 Recent studies have shown that the predictive value of RAR for prognosis in CKD patients may be greater than that of RDW. In a retrospective cohort study16 involving 997 CKD patients, patients were divided into tertile groups according to the baseline RAR values. Multivariate Cox regression analysis showed that patients in the highest RAR group had significantly higher risks of ESRD, all-cause mortality and CVEs than those in the lowest RAR group. ROC curve analysis proved that the discriminating ability of RAR for ESKD was superior to RDW. Furthermore, several studies have shown that a high level of RAR has predictive value for poor cardiovascular outcomes, which may be related to inflammation and malnutrition. A study30 included 1243 patients with congestive heart failure combined with CKD from the MIMIC IV Database, and the results showed that RAR had a good efficacy and clinical net for predicting in-hospital mortality, half-year mortality, one-year mortality, and three-year mortality. A retrospective cohort study31 included 826 patients with first-onset acute myocardial infarction from the MIMIC-III Database. In multivariate analysis, RAR was found to be associated with 30-day mortality (Model 3: HR = 1.23, 95% CI = 1.09–1.39, P < 0.001). RAR also had good predictive value for 1-year and 3-year mortality. Another research showed that the stroke patients in the ICU with high levels of RAR (RAR > 4.03) had a higher risk of all-cause mortality.32 In our study, the incidence of CVEs in Tertile 2 and Tertile 3 were higher than that in Tertile 1, however, there was no significant difference observed between Tertile 2 and Tertile 3. This finding might potentially be attributed to the limited sample size, and future studies with large samples are needed to confirm our results.
In the subgroup analysis, the interactions between RAR and sex, age, BMI, diabetes, and history of CVD were examined respectively. Except for sex, no interaction between RAR and the above indicators was observed. In a study31 investigating the relationship between RAR and mortality in patients with myocardial infarction, the subgroup analysis showed that the effect of RAR was higher in female patients than in male patients (P for interaction = 0.026). According to another study, RDW strongly predicted acute myocardial infarction in female patients.33 The underlying mechanism, however, remains unknown. Estrogen has been proven to exert cardiovascular protective effects through direct and indirect regulation of vascular endothelium, lipid metabolism, inflammatory responses, oxidative stress, and cardiomyocytes.34 Both estrogen and estrogen receptors exert cardioprotective effects by attenuating inflammatory cytokines, including interleukin-8 and monocyte chemoattractant protein-1 as well as recruitment of leukocytes.35 Postmenopausal women represented 84.7% (61/72) of the female cohort in our study. The decline of estrogen in postmenopausal women may highlight the correlation between RAR and CVEs. In addition, the observed interaction could also be due to the smaller sample size of women, residual confounding or selection bias. Due to the limited number of MHD patients without hypertension history, subgroup analysis based on hypertension status was not performed. We are cautious about the findings of subgroup analysis since this is a hypothesis generated from the data of our study. These results may be influenced by heterogeneity among different populations and require further research to be confirmed.
Limitations
First, it was a retrospective single-center cohort study; even though we adjusted as many confounding factors as possible, potential confounders like dietary intake, physical activity or specific comorbidities not captured in history were not available. Second, the study considered only the baseline RAR level, neglecting the potential influence of dynamic changes of RAR on CVEs. Third, all eligible patients were from China, suggesting that the findings may lack general applicability to other ethnic groups.
Conclusions
In summary, this study revealed that increased RAR was significantly associated with an increased risk of CVEs in MHD patients. As an easily accessible, low-cost and reproducible indicator, RAR might provide value for cardiovascular risk stratification and prognostic prediction in MHD patients, although sex differences should be taken in account.
Data Sharing Statement
The datasets of this study are available from the corresponding author on reasonable request.
Ethics Approval and Consent to Participate
This study was approved by the Ethics Committee of Tongren Hospital, Shanghai Jiao Tong University School of Medicine. Ethics committee waived the need for informed consent because it was a retrospective study, and no privacy issues were involved.
Author Contributions
Hui Guo and Fuhua Chen: Investigation, Data curation, Formal analysis, Methodology, Software, Writing - original draft. Chuchu Zeng: Investigation, Data curation, Validation, Writing - original draft. Yonglan Wang, Miao Ding and Nan Zhang: Investigation, Data curation, Writing - original draft. Xianfeng Wu: Conceptualization, Supervision, Project administration, Writing - review and editing. Xiaoxia Wang: Funding acquisition, Project administration, Writing - review and editing. All authors made a significant contribution to the work reported, whether that is in the conception, study design, execution, acquisition of data, analysis and interpretation, or in all these areas; took part in drafting, revising or critically reviewing the article; gave final approval of the version to be published; have agreed on the journal to which the article has been submitted; and agree to be accountable for all aspects of the work.
Funding
This study was supported by the National Natural Science Foundation of China (Grant No. 82170745) and the Research Fund of Tongren Hospital, Shanghai Jiao Tong University School of Medicine (TRYJ2021LC04).
Disclosure
All authors declare no conflicts of interest.
References
1. Zhang L, Zhao M-H, Zuo L, et al. China Kidney Disease Network (CK-NET) 2016 annual data report. Kidney Int Suppl. 2020;10(2):e97–e185. doi:10.1016/j.kisu.2020.09.001
2. Liu J, Zhang H, Diao Z, et al. Epidemiological analysis of death among patients on maintenance hemodialysis: results from the Beijing blood purification quality Control and Improvement Center. Bmc Nephrol. 2023;24(1):236. doi:10.1186/s12882-023-03271-6
3. Zambeli-Ljepovic A, Tungsanga S, Ghimire A, et al. The potential of kidney transplantation to reduce mortality from chronic kidney disease: a global, cross-sectional, modelling study. Lancet Glob Health. 2025;13(10):e1691–e1700. doi:10.1016/S2214-109X(25)00222-0
4. Gansevoort RT, Correa-Rotter R, Hemmelgarn BR, et al. Chronic kidney disease and cardiovascular risk: epidemiology, mechanisms, and prevention. Lancet. 2013;382(9889):339–352. doi:10.1016/S0140-6736(13)60595-4
5. Matsushita K, Ballew SH, Wang AY, et al. Epidemiology and risk of cardiovascular disease in populations with chronic kidney disease. Nat Rev Nephrol. 2022;18(11):696–707. doi:10.1038/s41581-022-00616-6
6. Yang Y, Xu Y, Liu S, et al. The systemic inflammation indexes predict all-cause mortality in peritoneal dialysis patients. Ren Fail. 2023;45(1):2160348. doi:10.1080/0886022X.2022.2160348
7. Ravid JD, Kamel MH, Chitalia VC. Uraemic solutes as therapeutic targets in CKD-associated cardiovascular disease. Nat Rev Nephrol. 2021;17(6):402–416. doi:10.1038/s41581-021-00408-4
8. Xie Y, Feng X, Gao Y, et al. Association of albumin to non-high-density lipoprotein cholesterol ratio with mortality in peritoneal dialysis patients. Ren Fail. 2024;46(1):2299601. doi:10.1080/0886022X.2023.2299601
9. Pecoits-Filho R, Lindholm B, Stenvinkel P. The malnutrition, inflammation, and atherosclerosis (MIA) syndrome -- the heart of the matter. Nephrol Dial Transplant. 2002;17 Suppl 11:28–31. doi:10.1093/ndt/17.suppl_11.28
10. Hsieh YP, Chang CC, Kor CT, et al. The predictive role of red cell distribution width in mortality among chronic kidney disease patients. PLoS One. 2016;11(12):e0162025. doi:10.1371/journal.pone.0162025
11. Vashistha T, Streja E, Molnar MZ, et al. Red cell distribution width and mortality in hemodialysis patients. Am J Kidney Dis. 2016;68(1):110–121. doi:10.1053/j.ajkd.2015.11.020
12. Peng F, Li Z, Zhong Z, et al. An increasing of red blood cell distribution width was associated with cardiovascular mortality in patients on peritoneal dialysis. Int J Cardiol. 2014;176(3):1379–1381. doi:10.1016/j.ijcard.2014.08.030
13. Mukai H, Villafuerte H, Qureshi AR, Lindholm B, albumin SPS. inflammation, and nutrition in end-stage renal disease: c-reactive protein is needed for optimal assessment. Semin Dial. 2018;31(5):435–439. doi:10.1111/sdi.12731
14. Amano H, Yoshimura K, Iijima R, et al. A slight decrease in the serum albumin level is associated with the rapid progression of kidney dysfunction, even within the normal range. Intern Med. 2020;59(21):2679–2685. doi:10.2169/internalmedicine.4466-20
15. Hao M, Jiang S, Tang J, et al. Ratio of red blood cell distribution width to albumin level and risk of mortality. JAMA Network Open. 2024;7(5):e2413213. doi:10.1001/jamanetworkopen.2024.13213
16. Kimura H, Tanaka K, Saito H, et al. Impact of red blood cell distribution width-albumin ratio on prognosis of patients with CKD. Sci Rep. 2023;13(1):15774. doi:10.1038/s41598-023-42986-2
17. Ni Q, Wang X, Wang J, Chen P. The red blood cell distribution width-albumin ratio: a promising predictor of mortality in heart failure patients - A cohort study. Clin Chim Acta. 2022;527:38–46. doi:10.1016/j.cca.2021.12.027
18. Lu C, Long J, Liu H, et al. Red blood cell distribution width-to-albumin ratio is associated with all-cause mortality in cancer patients. J Clin Lab Anal. 2022;36(5):e24423. doi:10.1002/jcla.24423
19. Pan LN, Pan SA, Lei BH, Hong GL, Chen KW. Development of a novel nomogram incorporating red blood cell distribution width-albumin ratio for the prediction of 30-day mortality in acute pancreatitis patients. Emerg Med Int. 2022;2022:1573931. doi:10.1155/2022/1573931
20. Fu W, Hu F, Xu C. Association between red blood cell distribution width/albumin ratio and all-cause mortality or cardiovascular diseases mortality in patients with diabetic retinopathy: a cohort study. PLoS One. 2023;18(12):e0296019. doi:10.1371/journal.pone.0296019
21. Zhou D, Wang J, Li X. The red blood cell distribution width-albumin ratio was a potential prognostic biomarker for diabetic ketoacidosis. Int J Gen Med. 2021;14:5375–5380. doi:10.2147/IJGM.S327733
22. Ma YC, Zuo L, Chen JH, et al. Modified glomerular filtration rate estimating equation for Chinese patients with chronic kidney disease. J Am Soc Nephrol. 2006;17(10):2937–2944. doi:10.1681/ASN.2006040368
23. Anker SD, Gillespie IA, Eckardt KU, et al. Development and validation of cardiovascular risk scores for haemodialysis patients. Int J Cardiol. 2016;216:68–77. doi:10.1016/j.ijcard.2016.04.151
24. Stenvinkel P, Carrero JJ, Axelsson J, et al. Emerging biomarkers for evaluating cardiovascular risk in the chronic kidney disease patient: how do new pieces fit into the uremic puzzle? Clin J Am Soc Nephrol. 2008;3(2):505–521. doi:10.2215/CJN.03670807
25. Sigrist M, Bungay P, Taal MW, Mcintyre CW. Vascular calcification and cardiovascular function in chronic kidney disease. Nephrol Dial Transplant. 2006;21(3):707–714. doi:10.1093/ndt/gfi236
26. Chen X, Shen B, Zou J, et al. The prognostic value of red blood cell distribution width in patients on maintenance hemodialysis. Blood Purif. 2016;42(4):314–321. doi:10.1159/000449421
27. Mo L, Chen Y, Li Z, et al. Red blood cell distribution width as a marker of cerebral infarction in hemodialysis patients. Ren Fail. 2017;39(1):712–718. doi:10.1080/0886022X.2017.1398664
28. Suliman ME, Stenvinkel P, Barany P, et al. Hyperhomocysteinemia and its relationship to cardiovascular disease in ESRD: influence of hypoalbuminemia, malnutrition, inflammation, and diabetes mellitus. Am J Kidney Dis. 2003;41(3 Suppl 1):S89–S95. doi:10.1053/ajkd.2003.50093
29. Sueta D, Hokimoto S, Sakamoto K, et al. Validation of the high mortality rate of malnutrition-inflammation-atherosclerosis syndrome: -community-based observational study. Int J Cardiol. 2017;230:97–102. doi:10.1016/j.ijcard.2016.12.072
30. Qian LJ, Hong LX. Association between red blood cell distribution width-to-albumin ratio and in-hospital mortality in patients with congestive heart failure combined with chronic kidney disease. Front Cardiovasc Med. 2025;12:1563512. doi:10.3389/fcvm.2025.1563512
31. Li D, Ruan Z, Wu B. Association of red blood cell distribution width-albumin ratio for acute myocardial infarction patients with mortality: a retrospective cohort study. Clin Appl Thromb Hemost. 2022;28:1309664506. doi:10.1177/10760296221121286
32. Zhao N, Hu W, Wu Z, et al. The red blood cell distribution width-albumin ratio: a promising predictor of mortality in stroke patients. Int J Gen Med. 2021;14:3737–3747. doi:10.2147/IJGM.S322441
33. Cemin R, Donazzan L, Lippi G, Clari F, Daves M. Blood cells characteristics as determinants of acute myocardial infarction. Clin Chem Lab Med. 2011;49(7):1231–1236. doi:10.1515/CCLM.2011.183
34. Mendelsohn ME, Karas RH. The protective effects of estrogen on the cardiovascular system. N Engl J Med. 1999;340(23):1801–1811. doi:10.1056/NEJM199906103402306
35. Giordano S, Hage FG, Xing D, et al. Estrogen and Cardiovascular Disease: is Timing Everything? Am J Med Sci. 2015;350(1):27–35. doi:10.1097/MAJ.0000000000000512
 © 2025 The Author(s). This work is published and licensed by Dove Medical Press Limited. The
full terms of this license are available at https://www.dovepress.com/terms
and incorporate the Creative Commons Attribution
- Non Commercial (unported, 4.0) License.
By accessing the work you hereby accept the Terms. Non-commercial uses of the work are permitted
without any further permission from Dove Medical Press Limited, provided the work is properly
attributed. For permission for commercial use of this work, please see paragraphs 4.2 and 5 of our Terms.
© 2025 The Author(s). This work is published and licensed by Dove Medical Press Limited. The
full terms of this license are available at https://www.dovepress.com/terms
and incorporate the Creative Commons Attribution
- Non Commercial (unported, 4.0) License.
By accessing the work you hereby accept the Terms. Non-commercial uses of the work are permitted
without any further permission from Dove Medical Press Limited, provided the work is properly
attributed. For permission for commercial use of this work, please see paragraphs 4.2 and 5 of our Terms.