Back to Journals » Diabetes, Metabolic Syndrome and Obesity » Volume 13
Correlation Between Circulating Levels of Secreted Frizzled-Related Protein 5 and Type 2 Diabetic Patients and Subjects with Impaired-Glucose Regulation
Received 17 December 2019
Accepted for publication 9 March 2020
Published 22 April 2020 Volume 2020:13 Pages 1243—1250
DOI https://doi.org/10.2147/DMSO.S242657
Checked for plagiarism Yes
Review by Single anonymous peer review
Peer reviewer comments 3
Editor who approved publication: Prof. Dr. Antonio Brunetti
Xiaoyan He,1 Huijuan Ma2
1Special Medical Department, Beijing Jiangong Hospital, Beijing 100054, People’s Republic of China; 2Department of Endocrinology, Hebei General Hospital, Shijiazhuang 050051, People’s Republic of China
Correspondence: Xiaoyan He
Special Medical Department, Beijing Jiangong Hospital, Beijing 100054, People’s Republic of China
Email [email protected]
Background: Secreted frizzled-related protein 5 (SFRP5) is a recently identified adipokine; however, its functions during pathogenesis of T2DM and obesity remain unclear. This research attempted to investigate associations between circulating SFRP5 and obesity/T2DM.
Materials and Methods: According to diagnosis, 107 patients were assigned as impaired-glucose regulation (IGR) and 111 patients newly-diagnosed as T2DM were assigned as the T2DM group. Meanwhile, 132 subjects with normal-glucose tolerance (NGT) were assigned as the NGT group. Differences in plasma SFRP5 levels among three groups were compared. Correlation between SFRP5 levels and different metabolic markers was analyzed. Multiple-linear stepwise regression analyses were performed to determine independent factors for SFRP5. Patients in the T2DM group were administrated with metformin for 12 weeks. Meanwhile, changes in plasma SFRP5 levels were also analyzed.
Results: Plasma SFRP5 level of the IGR group was significantly lower compared to the NGT group (219.1± 39.7 pg/mL vs 236.7± 72.6 pg/mL, P< 0.05), however, that of the T2DM group was significantly lower compared to the IGR group (203.5± 42.1 pg/mL vs 219.1± 39.7 pg/mL, P< 0.01). Level of plasma SFRP5 was negatively correlated with fasting plasma glucose, BMI, waist circumference (WC), normalized WC (waist-to-height ratio) (WHtR), 2h plasma glucose, fasting insulin, glycosylated hemoglobin (HbA1c), fasting C-peptide, HOMA-IR, and hs-CRP (P< 0.01). Among the above factors, HbA1c and fasting insulin levels (FIns) were two independent factors. Plasma SFRP5 levels were increased after 12-week metformin treatment (201.0± 34.8 pg/mL vs 213.1± 34.4 pg/mL, P< 0.05), while insulin resistance was alleviated (ln(HOMA-IR): 1.35± 0.55 vs 1.07± 0.49, P< 0.01).
Conclusion: Metformin reduced circulating levels of secreted frizzled-related protein 5 and improved pathophysiological parameters of T2DM.
Keywords: secreted frizzled-related protein 5, type 2 diabetes mellitus, obesity, insulin resistance, metformin
Introduction
Adipokines are a variety of cytokines secreted by adipocytes. Many adipokines have been proven to be related to the low-grade inflammatory responses and insulin-sensitivity, while adipokine dysregulation would be of benefit to the pathogenesis of obesity and type 2 diabetes (T2DM).1,3 Secreted frizzled-related protein 5 (SFRP5) is a recently identified adipokine. From a study on mouse models, SFRP5 was found to be able to control inflammatory cells within adipose tissue by neutralizing non-canonical c-Jun N-terminal kinase (JNK) activation, therefore improved the glucose metabolism.4 However, a study on mice showed that SFRP5 could inhibit Wnt signaling to suppress mitochondrial oxidative metabolism and stimulate adipocyte growth during obesity.5 Meanwhile, another study reported that SFRP5 is a negative regulator for glucose metabolism and function of pancreatic β cells.6 Several clinic studies explored the correlation of circulating SFRP5 level with obese degrees and the glucose-tolerance statuses. Some studies7,12 showed that SFRP5 levels were elevated in obese and T2DM patients, while the others showed controversial findings.13,14 These discrepancies implied that the functions of SFRP5 in the pathogenesis of T2DM and obesity still remain unclear.
To confirm a correlation between circulating SFRP5 level and glucose tolerance status, we performed cross-sectional research to compare the plasma SFRP5 level among patients with distinguished glucose-tolerance statuses. Meanwhile, we also analyzed the association between plasma SFRP5 level and various metabolic markers. Further, to understand the physiological role of SFRP5, we then conducted an interventional study to observe changes of plasma SFRP5 levels of T2DM patients when glucose metabolism was improved by metformin treatment.
Materials and Methods
Patients and Diagnostic Criteria
The participants were recruited from healthy examinees and patients visiting our hospital from January 2017 to December 2017. Newly-diagnosed T2DM patients aged 30–80 years, with body mass indexes (BMI) of 16–36 kg/m2 and glycated hemoglobin (HbA1c) ≤9.0% were included in the T2DM group (n=111). Diabetes and impaired-glucose regulation (IGR) in this research were diagnosed with World Health Organization (WHO) 2006 diagnostic criteria,15 according to which 107 patients with IGR were assigned as the IGR group (n=107). Meanwhile, 132 subjects with normal-glucose tolerance (NGT) were assigned as the NGT group (n=132). According to the evaluation of Epitools software, the sample size in each group was efficient for illustrating data in this study. The exclusion criteria were listed as the following: 1) Participants who had received any diet, exercise or pharmacological therapy for T2DM, or had taken any other medicine; 2) Patients who had been injured or undergone surgery within the past 1 month; and 3) Participants who were pregnant, had type 1 diabetes or ketoacidosis, hypertension, liver cirrhosis, hepatic or renal failure, hypercortisolism, hyperthyroidism, malignant disease, acute or chronic infectious or immunological disease, or other known major diseases. The inclusion and exclusion criteria of subjects are also illustrated in Figure 1.
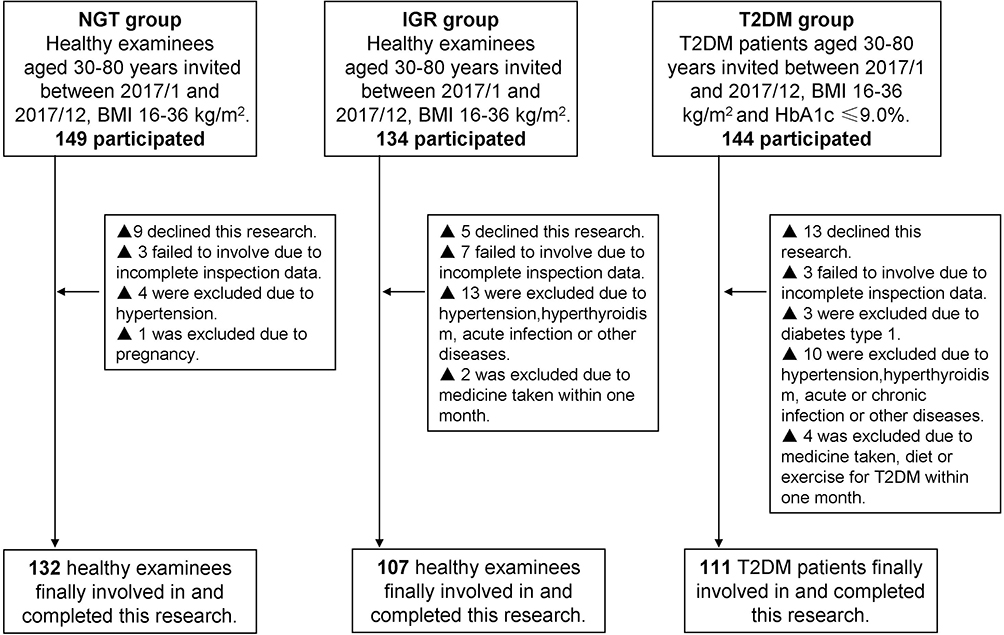 |
Figure 1 Protocol flow chart for the study population. Abbreviations: NGT, normal-glucose tolerance; IGR, impaired-glucose regulation; T2DM, type 2 diabetes; BMI, body mass indexes; HbA1c, glycated hemoglobin. |
This study has been approved by the Ethical Committee of Beijing Jiangong Hospital (Ethics registration number: PHG-HPH-F-AYW0-0029). This study was conducted in accordance with the Declaration of Helsinki. All patients provided written-informed consents and approved the present research.
Metformin Treatment
After being diagnosed with T2DM, the patients who did not have any acute complications were involved in the interventional study. The participants were administered metformin (Glucophage, Shanghai Squibb, Shanghai, China) for 12 weeks, according to the previous study16 described and our clinical practice. The dose of metformin for each individual was adjusted on the basis of tolerability and glycemic-control status. The goal of glycemic control in this study was the 2 hour postprandial plasma glucose (2hPG) <10.0 mmol/L and the fasting plasma glucose (FPG) <7.0 mmol/L. Patients whose plasma glucose levels did not meet the goal after 6 weeks of treatment. Meanwhile, those subjects who had any acute complication or could not tolerate metformin were withdrawn from the study.
All 111 newly-diagnosed T2DM patients were enrolled in the metformin treatment. Among them, two patients quit the follow-up, and seven patients were withdrawn due to unsatisfactory glycemic control. Finally, a total of 102 patients completed the 12-week metformin treatment.
Anthropometric and Biochemical Measurements
All subjects underwent anthropometric measurements, blood pressure measurements, routine biochemical analyses of blood, 75 g oral glucose tolerance test (OGTT), and plasma SFRP5 concentration measurements. The 75 g OGTT was conducted post an overnight fast (>12 hours) and the glucose levels were measured at fasting (0 minutes), and post 30 minutes, 60 minutes, 120 minutes, and 180 minutes. In this study, the OCTT was used to assist with the diagnosis of NGT, IGR, and T2DM when subjects were enrolled. Additionally, the subjects of the interventional study underwent these measurements at the 7th week and 12th week treatment of metformin.
Anthropometric parameters in this study mainly included BMI, waist circumferences (WC), and normalized WC (waist-to-height ratio) (WHtR). Waist circumference was measured to the nearest 0.1 centimeter at the uppermost lateral border of the hip crest with a steel measuring tape.
The concentrations of plasma triglyceride (TG), glucose and total cholesterol (TC) were examined with oxidase assay. HbA1c levels were assessed using high-performance liquid chromatography (HPLC) method. Insulin levels and C-peptide concentrations were evaluated using chemiluminescence immunoassay. The concentrations of high-density lipoprotein cholesterol (HDL-C) and low-density lipoprotein cholesterol (LDL-C) were analyzed using the direct clearance method. The high-sensitive C-reactive protein (hsCRP) concentration was assessed using latex-enhanced immunoturbidimetry. The concentration of SFRP5 was analyzed using ELISA kits (Shanghai ShinnyBIO Biological Technology Co., Ltd, China) according to the protocol of the manufacturer. The indicator of insulin-resistance, homeostasis model assessment of insulin resistance (HOMA-IR) and indicator for the insulin-secretion, HOMA β-cell index (HOMA-β) were also evaluated according to the previous reported equations.17,18 Briefly, HOMA-IR was determined with the FPG and fasting plasma insulin (FPI) concentrations with the formula FPG×FPI/22.5. Also, the HOMA-β was determined and calculated using 20×FPI/(FPG-3.5).
Statistical Analysis
In this research, statistical analysis was conducted with professional SPSS 20.0 statistical software (SPSS, Inc., Chicago, IL, USA). Continuous data with normal distribution were analyzed using the Kolmogorov–Smirnov test, while the skewed data were also analyzed using a non-parametric test when appropriate. Continuous data was represented as mean±standard deviation (SD) and analyzed using the analysis of variance (ANOVA) test between groups. Categorical data was represented as “%” and analyzed using χ2 test between groups. Correlation analyses were conducted using the Pearson method. P-value less than 0.05 was assigned as the significant difference.
Results
Plasma SFRP5 Levels of Subjects with Different Glucose Tolerances
A total of 132 NGT subjects, 107 IGR subjects, and 111 patients newly-diagnosed as T2DM were involved in this research. The clinical characteristics and plasma SFRP5 levels of patients were shown in Table 1. The gender ratios, ages, BMI, WC, and WHtR did not differ among three groups. FPG (P=0.008), 2hPG (P=0.007), HbA1c (P=0.003), and fasting insulin (FIns) (P=0.008) levels in IGR subjects were significantly higher compared to that of NGT subjects, and those levels of T2DM patients were also significantly higher compared to that of IGR subjects (FPG, P=0.008, HbA1c, P=0.005, 2hPG, P=0.009, FIns, P=0.016). Accordingly, the IGR subjects demonstrated significantly higher homeostasis model assessment of insulin resistance (HOMA-IR) values (P=0.007) and lower homeostasis model assessment β (HOMA-β) values (P=0.009) than that of NGT subjects, and the T2DM patients also demonstrated significantly higher HOMA-IR values (P=0.004) and lower HOMA-β values (P=0.007) than that of IGR subjects. The T2DM patients demonstrated significantly higher TG levels compared to that of NGT subjects (P=0.008) and the IGR subjects (P=0.023). However, no obvious difference for TG levels was discovered between NGT subjects and IGR subjects. IGR subjects and T2DM patients had lower HDL-C levels compared to that of NGT subjects (P=0.012, P=0.009, respectively), and higher fasting C peptide (FCP) levels (P=0.008 and P=0.007, respectively), but the difference of HDL-C or FCP levels between IGR subjects and T2DM patients was not significant. The plasma SFRP5 concentrations of NGT, IGR, T2DM patients were 236.7±72.6 pg/mL, 219.1±39.7 pg/mL, and 203.5±42.1 pg/mL, respectively. It can be seen that SFRP5 level (Table 1) was decreased in IGR and T2DM subjects when compared to that in NGT subjects (P=0.048 and P=0.004, respectively), and was also significantly lower in T2DM subjects when compared to that in IGR patients (P=0.008).
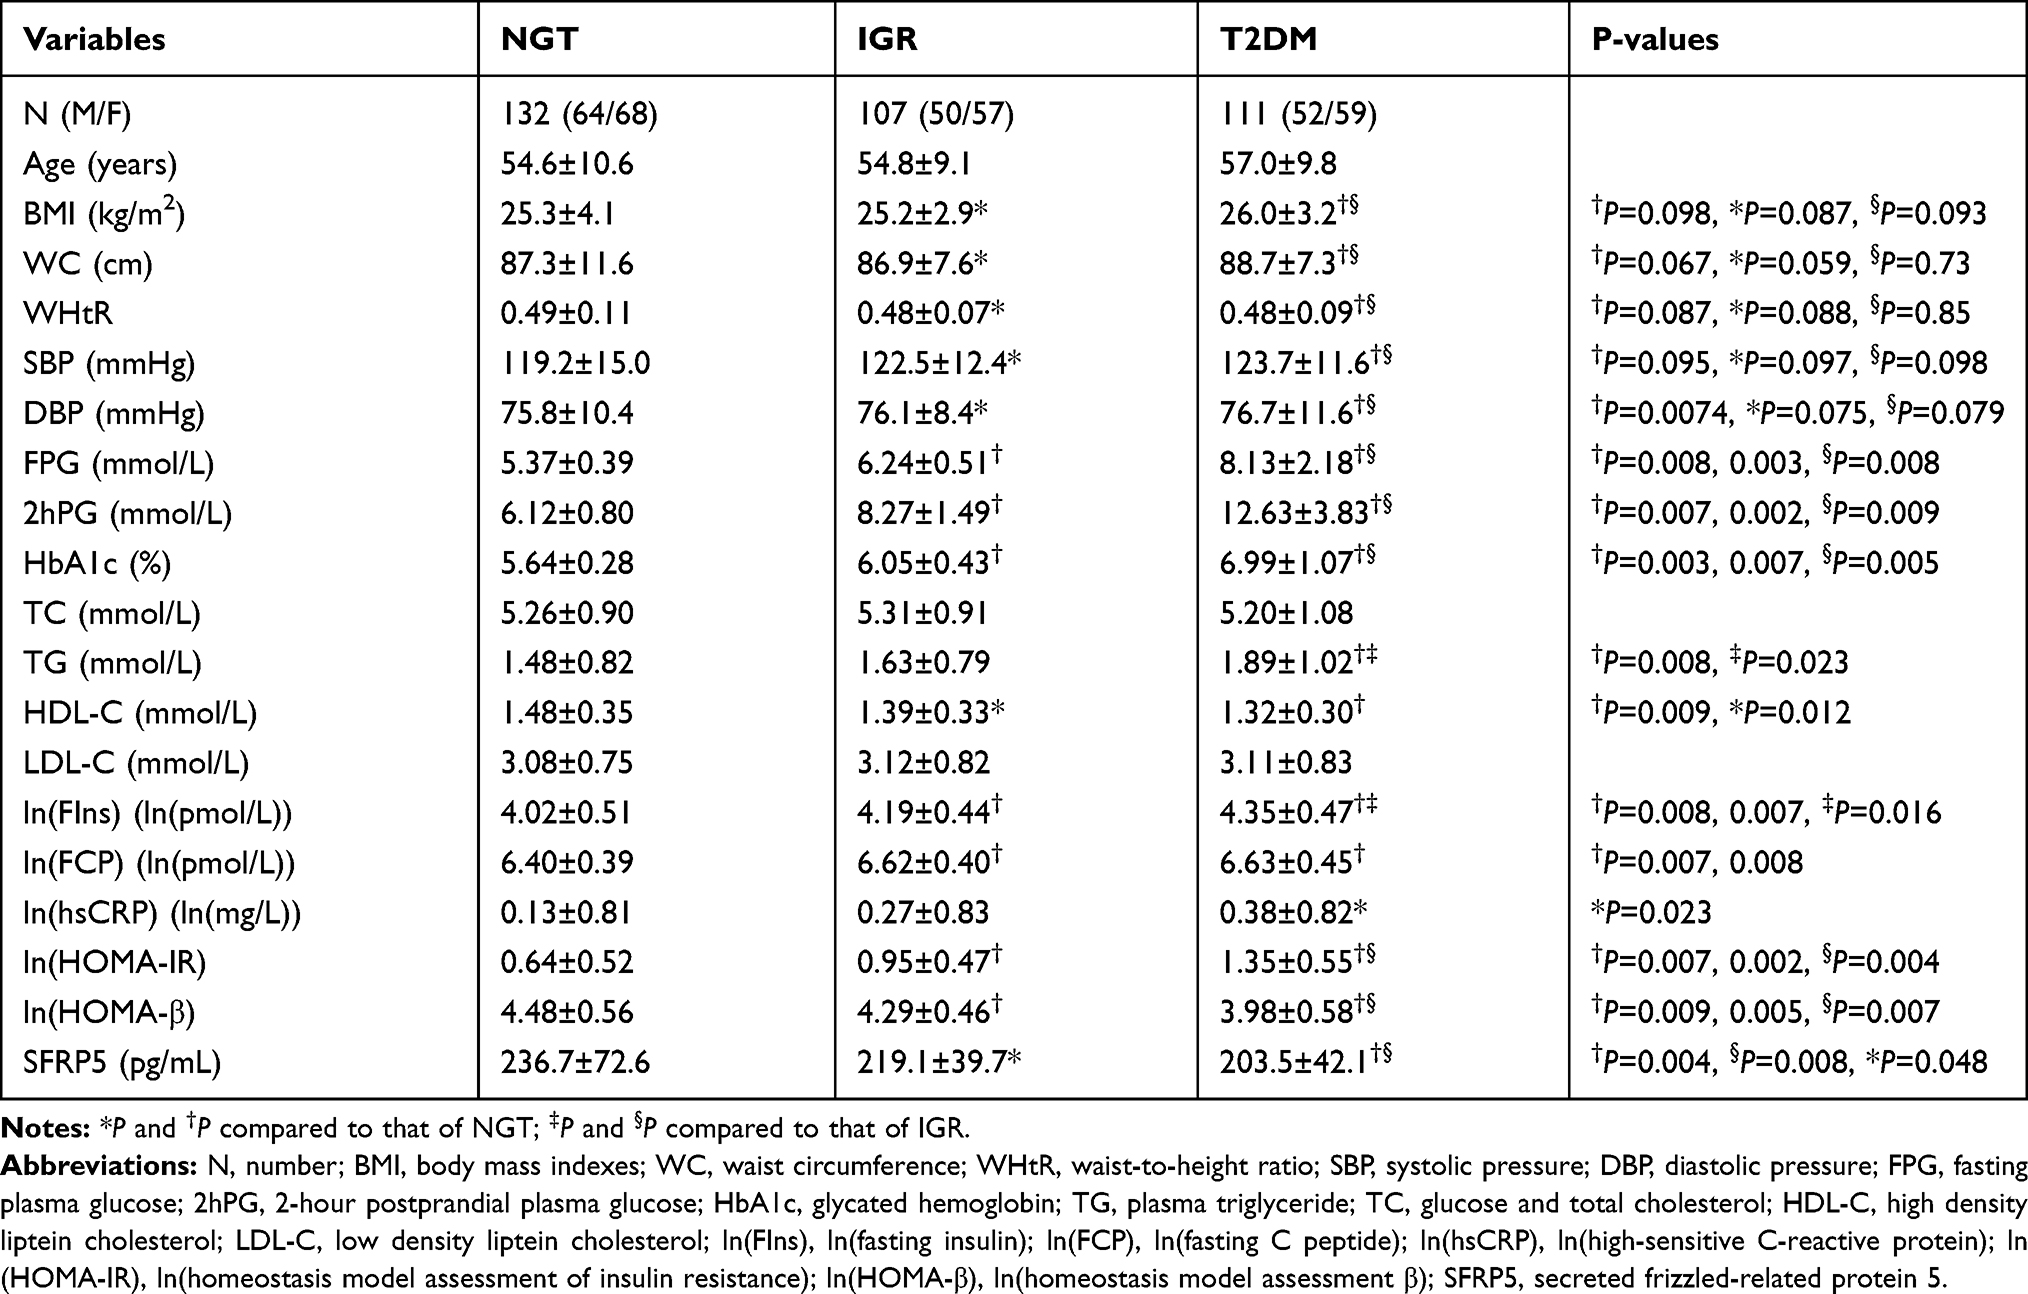 |
Table 1 Clinical and Basic Characteristics and Plasma SFRP5 Levels of the Patients |
Correlation Between Plasma SFRP5 Levels and Anthropometric/Biochemical Parameters in Subjects
No gender difference in plasma SFRP5 levels was found (225.2±61.0 pg/mL in men vs 216.8±52.3 pg/mL in women, P=0.167). Our results of correlations between plasma SFRP5 levels and the measured metabolic markers are shown in Table 2. No correlation between SFRP5 levels and ages was found (P>0.05). There was negative correlation between SFRP5 levels and WC/BMI (r=−0.227 and r=−0.192, respectively, both P<0.001). SFRP5 level was also negatively correlated with systolic pressure (SBP) (r=−0.152, P=0.007), however, without correlation between SFRF5 and diastolic pressure (DBP) level. There were also negative correlations between SFRP5 levels and blood glucose levels, including FPG, 2hPG, and HbA1c (r=−0.245, r=−0.219, r=−0.333, respectively, all P<0.001). SFRP5 level was negatively correlated with TG level (r=−0.141, P<0.01) and positively correlated with HDL-C level (r=0.137, P=0.011). SFRP5 levels were also negatively correlated with ln(fasting insulin) (ln(FIns)), ln(fasting C peptide) (ln(FCP)), ln(high-sensitive C-reactive protein) (ln(hsCRP)), ln(homeostasis model assessment of insulin resistance) (ln(HOMA-IR)) (r=−0.336, r=−0.258, r=−0.208, r=−0.384, P<0.001). However, SFRP5 levels were not correlated with ln(HOMA-β). After adjusting for gender, age, and WC, the SFRP5 levels were negatively correlated with FPG (P<0.001), 2hPG (P=0.001), HbA1c (P<0.001), ln(FIns) (P=0.001), ln(FCP) (P=0.010), ln(hsCRP) (P=0.012), and ln(HOMA-IR) (P<0.001), and positively correlated with HDL-C, however without correlation with the SBP/TG.
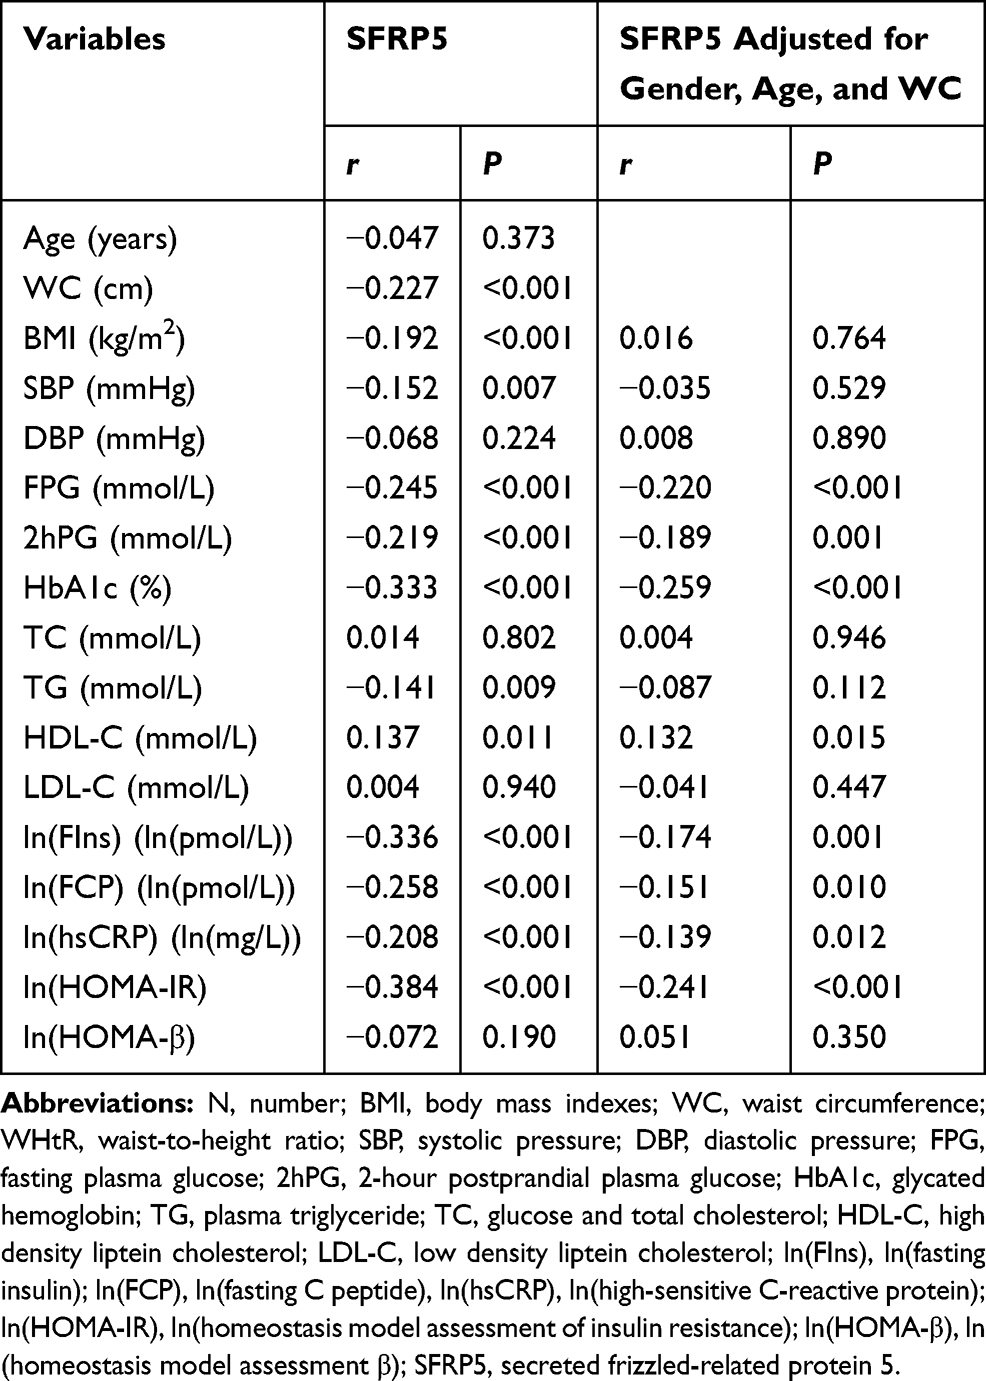 |
Table 2 Results of Correlation Analysis of Plasma SFRP5 Levels with Metabolic Markers in Study Subjects |
A multiple-linear stepwise regression test was further performed to discover the independent associated factors. Plasma SFRP5 levels were associated with the HbA1c and ln(FIns) (Table 3, β=−0.253 and β=−0.268, respectively, and both P<0.001).
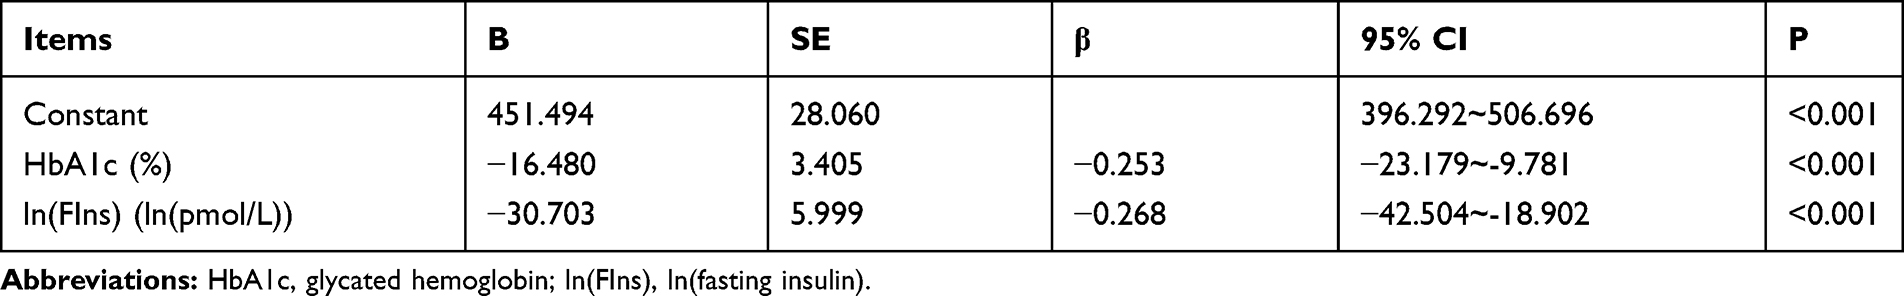 |
Table 3 Results of Multiple Linear Stepwise Regression Analysis of Plasma SFRP5 Levels in Study Subjects |
Changes in Plasma SFRP5 Levels of T2DM Patients After Metformin Treatment
The clinical characteristics and plasma SFRP5 levels of 102 subjects after receiving 6 weeks treatment and after receiving 12 weeks administration were compared with the levels of baseline (Table 4). The FPG (P=0.007 or P=0.008) and 2hPG levels (P=0.008 or P=0.009) were significantly reduced after 6 or 12 weeks administration and HbA1c level was significantly decreased post-12 weeks administration compared to that in baseline and 6 weeks post-administration (both P=0.007). HOMA-IR value was obviously decreased post-6 or 12 weeks of administration (P=0.006 or P=0.005), while HOMA-β value was significantly reduced (P<0.008 or P=0.007). Plasma SFRP5 level was also significantly elevated after 6 or 12 weeks administration compared to that in the baseline group (P=0.038 or P=0.041). The changes in other metabolic markers were not significant.
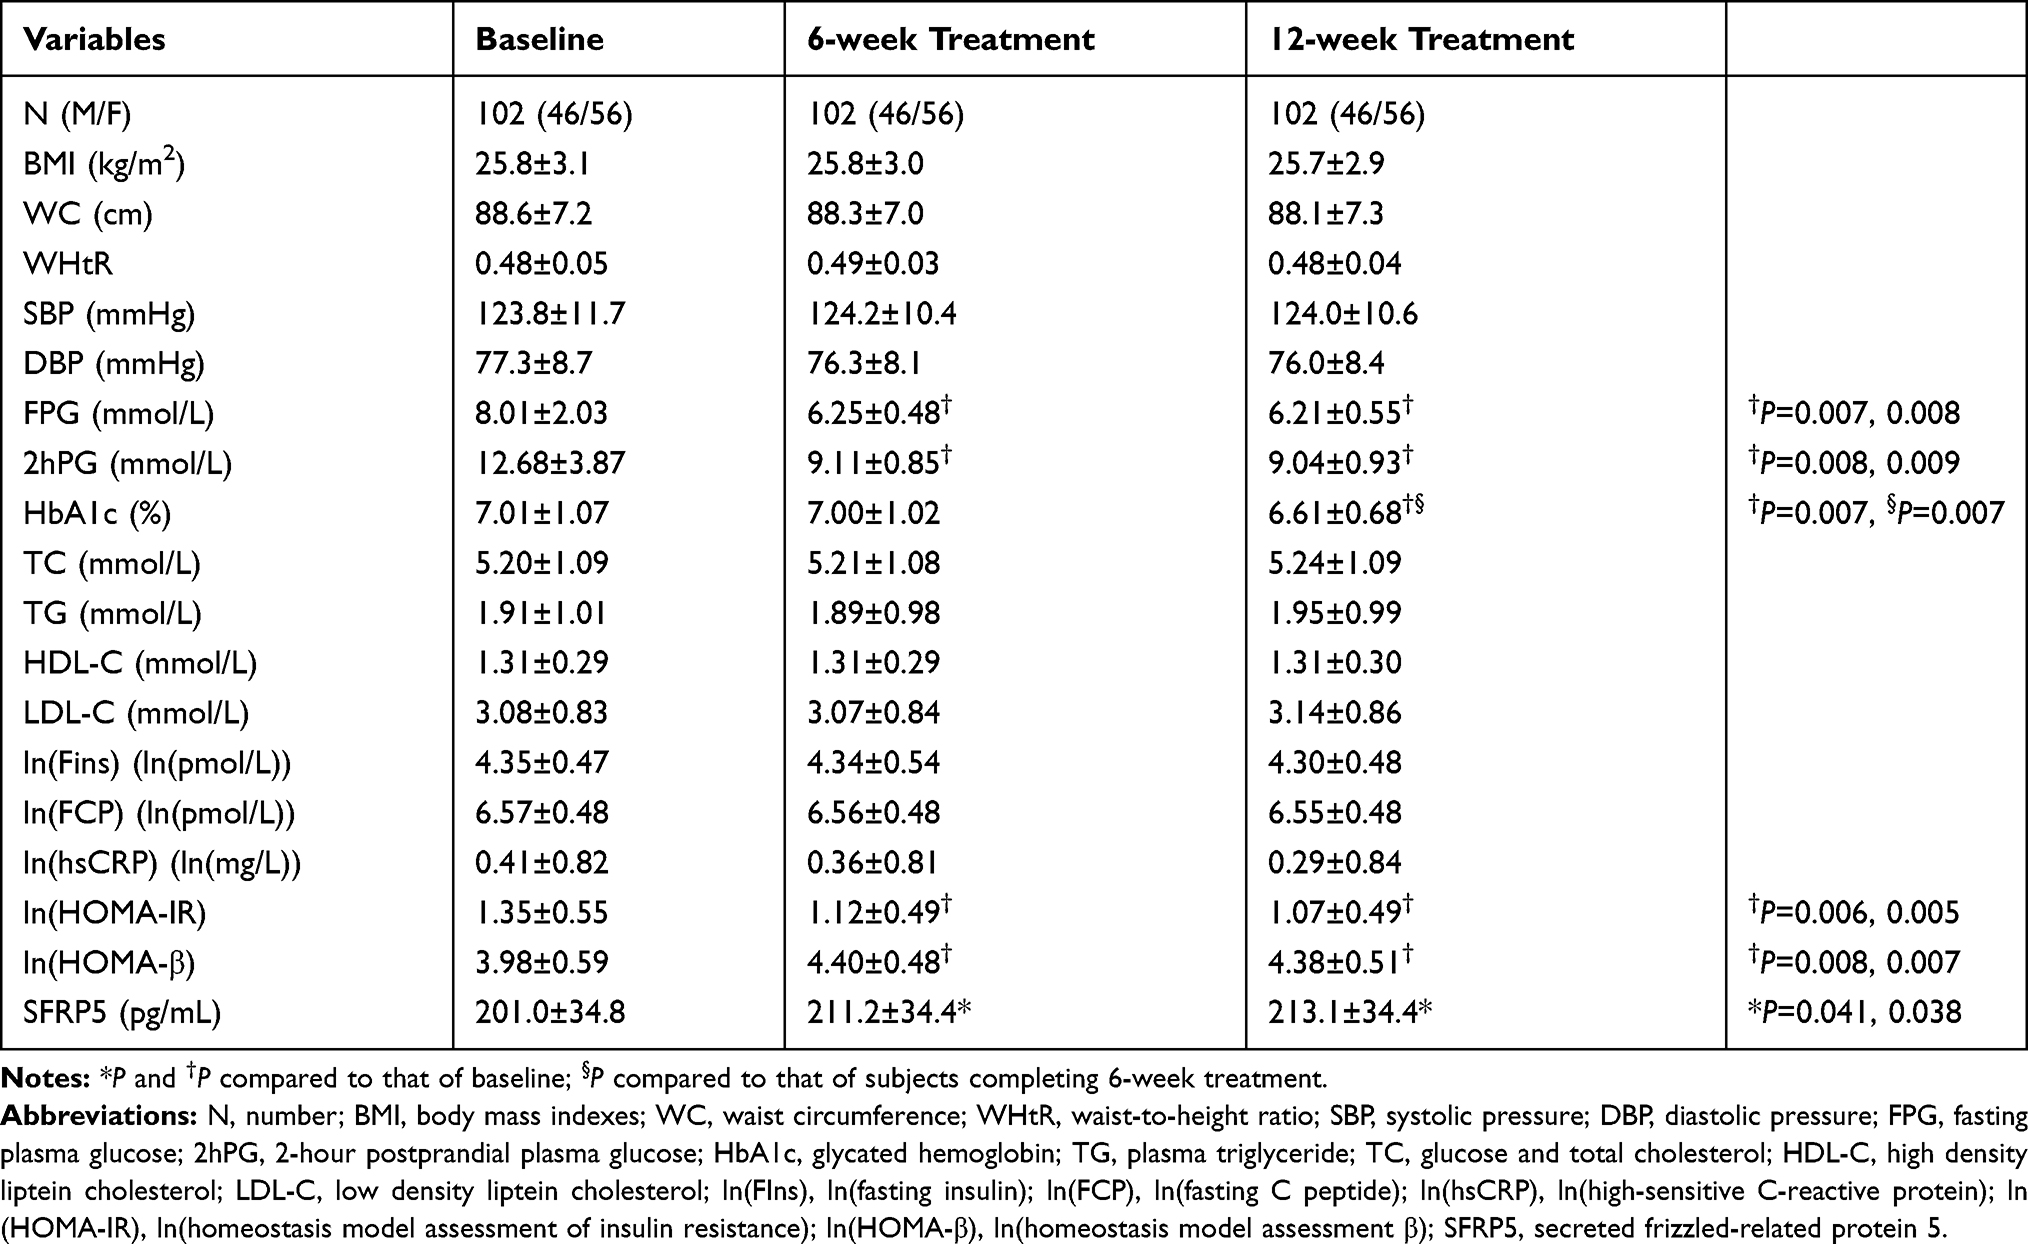 |
Table 4 Clinical Characteristics and Plasma SFRP5 Levels of the Patients Before and After the Metformin Treatment |
Discussion
In this cross-sectional research, our results demonstrated that the plasma SFRP5 level of the IGR group was significantly lower compared to that of the NGT group, while the SFRP5 levels of the T2DM group were significantly lower compared to those of the IGR group. These results are consistent with those studies of Li et al8 and Qu et al.10 However, Lu et al13 showed that plasma SFRP5 level was obviously elevated in T2DM subjects, while Canivell et al14 reported that serum SFRP5 level was higher in T2DM patients compared to IGR patients. Our findings and those of Yinet al8 and Qu et al10 demonstrated that T2DM subjects newly-diagnosed with T2DM have not been administered with any diabetes treatment, such as lifestyle intervention. In the study of Lu et al,13 the subjects in the T2DM group were administered with insulin or oral hypoglycemic-agents. However, in the study of Canivell et al,14 T2DM subjects received a 6-month low-carbohydrate diet to control blood glucose. Drug or dietary interventions in T2DM patients indeed affect circulating SFRP5 levels, as shown in our results on SFRP5 changes of T2DM patients treated with metformin, as well as Lv et al’s19 study and Schulte et al’s20 study.
The present study demonstrated that there were significant differences for FPG, 2hPG, HbA1c, TG, HDL-C, ln(FIns), ln(FCP), ln(hsCRP), ln(HOMA-IR), and ln(HOMA-β) among the NGT group, IGR group, and T2DM group. However, the values for the lipid profiles, including TG, LDL-C, and HDL-C, fall in normal ranges for all three groups. This result is interesting in hat the impaired-glucose regulation and T2DM do not affect the production of lipid profiles, which would be clarified in the following investigations.
We showed that plasma SFRP5 level was negatively correlated with BMI, waist circumference, and WHtR, all of which are indicators for degrees of abdominal obesity and obesity. The above findings are in accordance with the findings of Qu et al.10 Our results also showed that plasma SFRP5 levels were negatively correlated with FPG, 2hPG, HbA1c, ln(FIns), ln(FCP), and ln(HOMA-IR), which remains obvious even after the adjustment of gender, age, waist circumference, and WHtR. However, the SFRP5 levels were not correlated with HOMA-β. Also, the multiple-linear stepwise regression findings demonstrated that HbA1c and ln(FIns) were two independent factors associated with SFRP5 among the selected metabolic markers. The pathogenesis of T2DM involves insulin-resistance related compensatory insulin secretion. These findings suggest that plasma SFRP5 levels are negatively correlated to the developed insulin resistance during T2DM. However, these findings are insufficient to conclude that plasma SFRP5 level is not related to β-cell function. Because subjects involved in this study were healthy individuals with NGT, individuals with IGR and patients newly-diagnosed with T2DM, their β-cell functions have not been significantly impaired. Meanwhile, the circulating insulin levels were even elevated to compensate for high blood glucose, and changes in SFRP5 levels induced by impaired β-cells have not been shown. In contrast, Carstensen-Kirberg et al21 observed that serum SFRP5 level was negatively correlated with β-cell function of patients diagnosed as non-alcoholic fatty liver disease, among them T2DM subjects who were not newly-diagnosed and had significantly lower β-cell function compared to that of NGT and IGR subjects. Furthermore, our results illustrated that SFRP5 levels were negatively correlated with hsCRP level. In the absence of infection or trauma, plasma hsCRP level is an indicator of low-grade inflammation in individuals. This result suggests that plasma SFRP5 levels are negatively associated with the severity of low-grade inflammation, which is closely related to the onset of obesity and T2DM.22
Together, circulating SFRP5 level is negatively correlated with severity for insulin-resistance, abdominal obesity, and low-grade inflammation in individuals without any drug or dietary intervention.4 Meanwhile, validating SFRP5 could prevent progression of insulin-resistance and inflammation in animals.4 It has been proven that the Wnt5A/JNK signaling pathway is involved in inflammation of adipose tissue and obesity-induced insulin-resistance.23,24 In Wnt5a/JNK signaling pathway, tyrosine kinase-like orphan receptor 2 (ROR2) is a transmembrane receptor of WNT5A. When the cysteine-rich domain (CRD) of ROR2 binds to Wnt5a outside the membrane, the proline-rich domain (PRD) could activate JNK through filamin A inside the membrane.25 JNK can up-regulate obesity-induced inflammation and insulin resistance through a variety of mechanisms.26 SFRP5, with a CRD structurally homologous to that of ROR2, could competitively bind to Wnt5a and antagonize the Wnt5a/JNK signaling pathway,27 therefore suppressing inflammation and insulin resistance.
Our findings showed that SFRP5 levels in T2DM group (203.5±42.1 pg/mL) were significantly reduced compared to that in NGT group (236.7±72.6 pg/mL) and IGR group (219.1±39.7 pg/mL). Presently, there is no confirmed evidence that shows that metformin has a preventive effect on diabetes. The clinical guidelines of various countries have not widely recommended drug intervention (such as metformin) as the main means to prevent diabetes. Therefore, we only administrated metformin to the T2DM patients, and observed it’s effects on SFRP5 levels. The results indicated that plasma SFRP5 levels were significantly increased post the 12-week metformin administration (201.0±34.8 pg/mL vs 213.1±34.4 pg/mL), Meanwhile, the interventional study also demonstrated that metformin effectively promoted the insulin sensitivity. Both of the above SFRP5 and insulin sensitivity findings support Lv et al’s19 finding that SFRP5 expression and secretion in adipocytes are increased upon treatment with metformin in vitro. Similarly, Schulte et al20 also found that serum SFRP5 levels are increased while insulin sensitivity is improved by calorie restriction in obese subjects. These results reveal that metformin treatment and calorie restriction are potential regulators of SFRP5. Because the molecular mechanism of metformin regulation is also unknown, therefore we hypothesized that it might be related to the cross talk between insulin and Wnt signaling pathways.28,29 Meanwhile, according to the previous study,19 SFRP5, as protein-peptide hormone, is secreted by adipocytes. Therefore, the increased levels of SFRP5 in the T2DM patients might depend on the metformin triggered secretion of adipocytes.
A few limitations of our studies need to be considered. First, the relationship between circulating SFRP5 and β-cell function has not been observed because the selected subjects had not suffered from β-cell dysfunction. The casual relationship between elevated circulating SFRP5 levels and T2DM could not be inferred from our studies. To investigate it, a cohort study should be designed to observe and compare changes in circulating SFRP5 levels and other related factors, especially Wnt5a levels, in individuals who undergo the progression from NGT to T2DM. Secondarily, this study has not evaluated correlation between glycometabolic status markers and SFRP5 during or after the treatment. Thirdly, the insulin levels post-OGTT have also not been clarified. In the following study, we would evaluate correlation between glycometabolic status markers and SFRP5, as well as clarify the insulin levels after the OGTT in patients.
In conclusion, this study demonstrated a reduction in circulating SFRP5 level in patients with T2DM and an elevation of SFRP5 levels after metformin treatment. Meanwhile, a negative correlation between SFRP5 levels and abdominal obesity, insulin resistance, and inflammation were also discovered. In summary, metformin reduced circulating levels of secreted frizzled-related protein 5 and improved pathophysiological indexes of type 2 diabetes patients.
Disclosure
The authors report no conflicts of interest in this work.
References
1. Trojnar M, Patro-Malysza J, Kimber-Trojnar Z, Leszczynska-Gorzelak B, Mosiewicz J. Association between fatty acid-binding protein 4-A proinflammatory adipokine and insulin resistance, gestational and type 2 diabetes mellitus. Cells. 2019;8(3):E227. doi:10.3390/cells8030227
2. Elsehmawy AAEW, El-Toukhy SE, Seliem NMA, Moustafa RS, Mohammed DS. Apelin and chemerin as promising adipokines in children with type 1 diabetes mellitus. Diabetes Metab Syndr Obes. 2019;12:383–389. doi:10.2147/DMSO.S189264
3. Lelis DF, Freitas DF, Machado AS, Crespo TS, Santos SHS. Angiotensin-(1–7), adipokines and inflammation. Metabolism. 2019;95:36–45. doi:10.1016/j.metabol.2019.03.006
4. Shen HH, Yang CY, Kung CW, et al. Raloxifene inhibits adipose tissue inflammation and adipogenesis through Wnt regulation in ovariectomized rats and 3 T3-L1 cells. J Biomed Sci. 2019;26(1):62. doi:10.1186/s12929-019-0556-3
5. Mori H, Prestwich T, Reid MA, et al. Secreted frizzled-related protein 5 suppresses adipocyte mitochondrial metabolism through WNT inhibition. J Clin Invest. 2012;122(7):2405–2416. doi:10.1172/JCI63604
6. Rulifson IC, Majeti JZ, Xiong Y, et al. Inhibition of secreted frizzled-related protein 5 improves glucose metabolism. Am J Physiol Endocrinol Metab. 2014;307(12):E1144–H1152. doi:10.1152/ajpendo.00283.2014
7. Xu W, Geng H, Liu X, et al. Wingless-type MMTV integration site family member 5a: a novel biomarker regulated in type 2 diabetes mellitus and diabetic kidney disease. J Diabetes Metab Disord. 2019;18(2):525–532. doi:10.1007/s40200-019-00461-8
8. Li B, Yao Q, Guo S, et al. Type 2 diabetes with hypertensive patients results in changes to features of adipocytokines: leptin, irisin, LGR4 and Sfrp5. Clin Exp Hypertens. 2019;41(7):645–650. doi:10.1080/10641963.2018.1529779
9. Prats-Puig A, Soriano-Rodriguez P, Carreras-Badosa G, et al. Balanced duo of anti-inflammatory SFRP5 and proinflammatory WNT5A in children. Pediatr Res. 2014;75(6):793–797. doi:10.1038/pr.2014.29
10. Qu H, Liu Q, Hu Z. Relation of plasma secreted frizzled-related protein 5 to obesity and type 2 diabetes mellitus. Chin J Endocrinol Metab. 2014;30:678–681.
11. Xu Q, Wang H, Li Y, et al. Plasma Sfrp5 levels correlate with determinants of the metabolic syndrome in Chinese adults. Diabetes Metab Res Rev. 2017;33(6):e2896. doi:10.1002/dmrr.v33.6
12. Zhang C, Li B, Guo S. The changes of serum Irisin and SFRP5 levels in obese patients with type 2 diabetes mellitus. Int J Endocrinol Metab. 2018;38:1–5.
13. Lu YC, Wang CP, Hsu CC, et al. Circulating secreted frizzled-related protein 5 (Sfrp5) and wingless-type MMTV integration site family member 5a (Wnt5a) levels in patients with type 2 diabetes mellitus. Diabetes Metab Res Rev. 2013;29(7):551–556. doi:10.1002/dmrr.2426
14. Canivell S, Rebuffat S, Ruano EG, et al. Circulating SFRP5 levels are elevated in drug-naïve recently diagnosed type 2 diabetic patients as compared with prediabetic subjects and controls. Diabetes Metab Res Rev. 2015;31(2):212–219. doi:10.1002/dmrr.v31.2
15. World Health Organization and International Diabetes Federation. Definition and Diagnosis of Diabetes Mellitus and Intermediate Hyperglycemia: Report of a WHO/IDF Consultation. Geneva: World Health Organization; 2006. Available from: https://apps.who.int/iris/handle/10665/43588.
16. Fouqueray P, Pirags V, Inzucchi SE, et al. The efficacy and safety of imeglimin as add-on therapy in patients with type 2 diabetes inadequately controlled with metformin monotherapy. Diabetes Care. 2013;36(3):565–568. doi:10.2337/dc12-0453
17. Matthews DR, Hosker JP, Rudenski AS, Naylor BA, Treacher DF, Turner RC. Homeostasis model assessment: insulin resistance and beta-cell function from fasting plasma glucose and insulin concentrations in man. Diabetologia. 1985;28(7):412–419. doi:10.1007/BF00280883
18. Matsuda M. Measuring and estimating insulin resistance in clinical and research settings. Nutr Metab Cardiovasc Dis. 2010;20(2):79–86. doi:10.1016/j.numecd.2009.07.007
19. Lv C, Jiang Y, Wang H, Chen B. Sfrp5 expression and secretion in adipocytes are up-regulated during differentiation and are negatively correlated with insulin resistance. Cell Biol Int. 2012;36(9):851–855. doi:10.1042/CBI20120054
20. Schulte DM, Müller N, Neumann K, et al. Pro-inflammatory wnt5a and anti-inflammatory sFRP5 are differentially regulated by nutritional factors in obese human subjects. PLoS One. 2012;7(2):e32437. doi:10.1371/journal.pone.0032437
21. Carstensen-Kirberg M, Hatziagelaki E, Tsiavou A, et al. Sfrp5 associates with beta-cell function in humans. Eur J Clin Invest. 2016;46(6):535–543. doi:10.1111/eci.2016.46.issue-6
22. Ye X, Yu Z, Li H, Franco OH, Liu Y, Lin X. Distributions of C-reactive protein and its association with metabolic syndrome in middle-aged and older Chinese people. J Am Coll Cardiol. 2007;49(17):1798–1805. doi:10.1016/j.jacc.2007.01.065
23. Xing L, Zhang H, Majumder K, Zhang W, Mine Y. r-glutamylvaline prevents low-grade chronic inflammation via activation of a calcium-sensing receptor pathway in 3T3-L1 mouse adipocytes. J Agric Food Chem. 2019;67(30):8361–8369. doi:10.1021/acs.jafc.9b02334
24. Farb MG, Karki S, Park SY, et al. WNT5A-JNK regulation of vascular insulin resistance in human obesity. Vasc Med. 2016;21(6):489–496. doi:10.1177/1358863X16666693
25. Minami Y, Oishi I, Endo M, Nishita M. Ror-family receptor tyrosine kinases in noncanonical Wnt signaling: their implications in developmental morphogenesis and human diseases. Dev Dyn. 2010;239(1):1–15. doi:10.1002/dvdy.21991
26. Solinas G, Becattini B. JNK at the crossroad of obesity, insulin resistance, and cell stress response. Mol Metab. 2017;6(2):174–184. doi:10.1016/j.molmet.2016.12.001
27. Cho YK, Kang YM, Lee SE, et al. Effect of SFRP5 (secreted frizzled-related protein 5) on the Wnt5a (wingless-type family member 5a)-induced endothelial dysfunction and its relevance with arterial stiffness in human subjects. Arterioscler Thromb Vasc Biol. 2018;38(6):1358–1367. doi:10.1161/ATVBAHA.117.310649
28. Kim M-H, Jee J-H, Park S, Kim KW, Lee MK, Lee M-K. Metformin enhances glucagon-like peptide 1 via cooperation between insulin and Wnt signaling. J Endocrinol. 2014;220(2):117–128. doi:10.1530/JOE-13-0381
29. Jiating L, Buyun J, Yinchang Z. Role of metformin on osteoblast differentiation in type 2 diabetes. Biomed Res Int. 2019;2019:9203934. doi:10.1155/2019/9203934
 © 2020 The Author(s). This work is published and licensed by Dove Medical Press Limited. The
full terms of this license are available at https://www.dovepress.com/terms
and incorporate the Creative Commons Attribution
- Non Commercial (unported, 3.0) License.
By accessing the work you hereby accept the Terms. Non-commercial uses of the work are permitted
without any further permission from Dove Medical Press Limited, provided the work is properly
attributed. For permission for commercial use of this work, please see paragraphs 4.2 and 5 of our Terms.
© 2020 The Author(s). This work is published and licensed by Dove Medical Press Limited. The
full terms of this license are available at https://www.dovepress.com/terms
and incorporate the Creative Commons Attribution
- Non Commercial (unported, 3.0) License.
By accessing the work you hereby accept the Terms. Non-commercial uses of the work are permitted
without any further permission from Dove Medical Press Limited, provided the work is properly
attributed. For permission for commercial use of this work, please see paragraphs 4.2 and 5 of our Terms.