Back to Journals » Clinical Ophthalmology » Volume 15
Correlation Between Changes in Lamina Cribrosa Structure and Visual Field in Primary Open-Angle Glaucoma
Authors El Basty A, Gaber R ![]() , Elmaria A
, Elmaria A ![]() , Sabry M
, Sabry M ![]() , Hussein TR
, Hussein TR
Received 15 October 2021
Accepted for publication 7 December 2021
Published 17 December 2021 Volume 2021:15 Pages 4715—4722
DOI https://doi.org/10.2147/OPTH.S343019
Checked for plagiarism Yes
Review by Single anonymous peer review
Peer reviewer comments 3
Editor who approved publication: Dr Scott Fraser
Ahmed El Basty, Raouf Gaber, Ahmed Elmaria, Moataz Sabry, Tarek R Hussein
Department of Ophthalmology, Tanta University, Tanta, Gharbeya Province, Egypt
Correspondence: Raouf Gaber
Tanta University Eye Hospital, The Faculty of Medicine, El-Gash St. Medical Campus, Tanta, Gharbeya Province, 31527, Egypt
Tel +201557673775
Email [email protected]
Purpose: To investigate the correlation between changes in lamina cribrosa (LC) structure using enhanced depth imaging (EDI) and severity of visual field (VF) affection in primary open-angle glaucoma (POAG).
Patients and Methods: This prospective cross-sectional study was carried out on 52 glaucomatous eyes of 28 POAG patients who attended Tanta University Eye Hospital and 40 normal eyes of 20 age-matched normal subjects from April 2020 to March 2021. POAG patients were classified according to the modified Hodapp–Anderson–Parrish grading scale based on the MD of the standard automated perimetry (SAP) visual field into two groups: group (1) – mild-to-moderate POAG patients (MD ≤ 12 dB), group (2) – severe POAG patients (MD ≥ 12 dB) and the third group included normal (control) age- and gender-matched individuals.
Results: There was no statistically significant difference between the three groups regarding lamina cribrosa thickness nor lamina cribrosa area and there was no statistically significant correlation between MD and LC thickness, LC area (P-value=0.395 and 0.644). There was a statistically significant correlation between MD and anterior lamina cribrosa surface depth (P-value=0.002) and there was a statistically significant positive correlation between MD and prelaminar neural tissue (PLNT) thickness and prelaminar neural tissue (PLNT) area (P-value= 0.023 and < 0.001, respectively).
Conclusion: EDI-OCT is a useful biomarker of structural changes in ONH and LC, and we recommended it to be a part of the routine monitoring of patients with POAG.
Keywords: EDI, blindness, biomarker, lamina cribrosa, PLNT thickness
Introduction
Glaucoma is identified as a potentially progressive characteristic optic neuropathy, which includes structural or morphological alterations in the head of the optic nerves (ONH), associated with excavation of ONH and lamina cribrosa (LC) deformation and development of characteristic patterns of functional worsening of the visual field (VF) due to neurodegeneration of the retinal ganglion cell (RGCs) axons.1–3
Glaucoma is the second most frequent blindness condition globally after cataract. In 2020, about 79 million people suffer from glaucoma around the world.4,5 The number of individuals affected by glaucoma continues to rise, and it is estimated that it may reach up to 111.8 million in 2040, worldwide.6
Primary open-angle glaucoma (POAG) is the most prevalent type of glaucoma worldwide (about 70% of the cases of glaucoma).3
The laminar area of ONH is the major place of insult to RGCs axonal damage in both human and experimental animals with glaucoma.7 In glaucoma, the LC structure is significantly affected by the remodeling of its connective tissue by multiple mechanisms. This could change the physiology of resident cells and LC capillaries, which probably contribute to glaucomatous damage.8,9
Advances in the field of OCT including enhanced depth imaging-optical coherence tomography (EDI-OCT) provide the means to evaluate structural modifications of the ONH and LC.10
Functional diagnosis is mostly based on visual field analysis by standard automated perimetry (SAP). SAP is the reference test and the most widely used approach for evaluation of functional deterioration of glaucoma,11 documentation and tracking of functional regression in glaucoma.12
There are limited data on the correlation between the structural changes in optic nerve head and the functional assessment of glaucoma using visual field analysis. In our study, we evaluate the correlation between the structure of ONH using OCT EDI and functional changes in POAG patients using visual field analysis. Most of the studies done before focused mainly on Lamina cribrosa thickness and anterior lamina cribrosa surface depth (depth of the cup). In our manuscript, we tried to increase our understanding of changes in lamina cribrosa (LC) by measuring LC area and thickness and structures related to LC as prelaminar neural tissue (PLNT) by measuring PLNT thickness and area.
Patients and Methods
This prospective cross-sectional study was carried out on 52 glaucomatous eyes of 28 POAG patients who attended Tanta University Eye Hospital and 40 normal eyes of 20 age-matched normal subjects from April 2020 to March 2021.
There is no risk to the participants of the study at all and ethical committee approval number 33751/3/20 from Tanta University was obtained. The study was conducted in accordance with the tenets of the Declaration of Helsinki and the guidelines of good clinical practice. Full counseling of the participants in this research about the nature of the study was obtained and informed consent was taken.
Inclusion criteria:
- Patients diagnosed with primary open-angle glaucoma.
- Patients older than 40 years of age.
- Both genders were included in the study.
- Patients has spherical correction between (−6 D and +3 D) and cylindrical correction within ±3 D.
Exclusion criteria:
- Patients with any associated systemic (eg, neurologic disease) or ocular diseases other than glaucoma that affect ONH or VF testing.
- Patients who had any previous ocular surgery or trauma.
- Eyes with unreliable VF (defined as follows: false-negative >25%, false-positive >25% and fixation loss >20%).
- Patients with poor quality OCT images (eg, dense cataract or vitreous hemorrhage).
- Patients with congenital anomalies of the optic nerve (eg, optic nerve hypoplasia, morning glory disc anomaly, optic disc coloboma and optic nerve pit).
POAG patients were grouped according to the modified Hodapp–Anderson– Parrish grading scale based on the MD of the standard automated perimetry (SAP) visual field13 into two groups: group (1) mild-to-moderate POAG patients (MD ≤ 12 dB), group (2) severe POAG patients (MD ≥ 12 dB) and the third group included normal (control) age- and gender-matched individuals.
Detailed medical and surgical history was obtained from all the participants followed by a complete ophthalmological examination, in particular:
A. Measurement of uncorrected and best-corrected distance visual acuity (UCVA, BCVA) using a Snellen chart in decimal notation.
B. Anterior segment fully examined using slit-lamp and gonioscopic examination for the AC angle using Goldmann 3-mirror lens with the slit lamp for any abnormality to exclude angle-closure and secondary glaucomas.
C. All participants underwent a Posterior segment examination using slit-lamp fundus biomicroscopy using a +78.00 D lens.
Visual Field Testing
VF examination by Humphrey field analyzer (Carl-Zeiss Meditec, Dublin, CA; SITA standard strategy, program 24–2). All participants underwent VF testing to determine MD and PSD using the standard automated perimetry Full Threshold Standard 24–2 strategy size III white stimulus at the same time with imaging. VF loss was expressed as MD from normal. We used the VF mean deviation (MD) for analysis of VF affection.
Optical Coherence Tomography (Spectralis; Heidelberg Engineering Co., Heidelberg, Germany) of the RNFL Thickness
Peripapillary RNFL thickness assessment using the 3.4 mm circular scan centered on the optic disc, the peripapillary RNFL was measured in the four quadrants and the average RNFL thickness was taken as the main parameter.
EDI-OCT Imaging (Spectralis; Heidelberg Engineering Co., Heidelberg, Germany) for LC and ONH
Parameters of LC and ONH were measured manually by experienced examiners masked to patient’s clinical data: a) The thickness of the LC is defined as the distance between the anterior and posterior borders of the highly reflective region of the ONH in the EDI-OCT B-scans. b) The area of the LC is defined as the area between the anterior and posterior borders of the highly reflective region. c) Prelaminar neural tissue (PLNT) is defined as the perpendicular distance between the anterior PLNT surface and the anterior surface of the LC. d) PLNT area is defined as the area between the anterior PLNT surface and the anterior surface of the LC. e) The anterior lamina cribrosa surface depth (ALCSD) is defined as the distance from the line connecting the two Bruch’s membrane opening (BMO) edges (reference line) to the anterior LC surface (Figures 1 and 2).
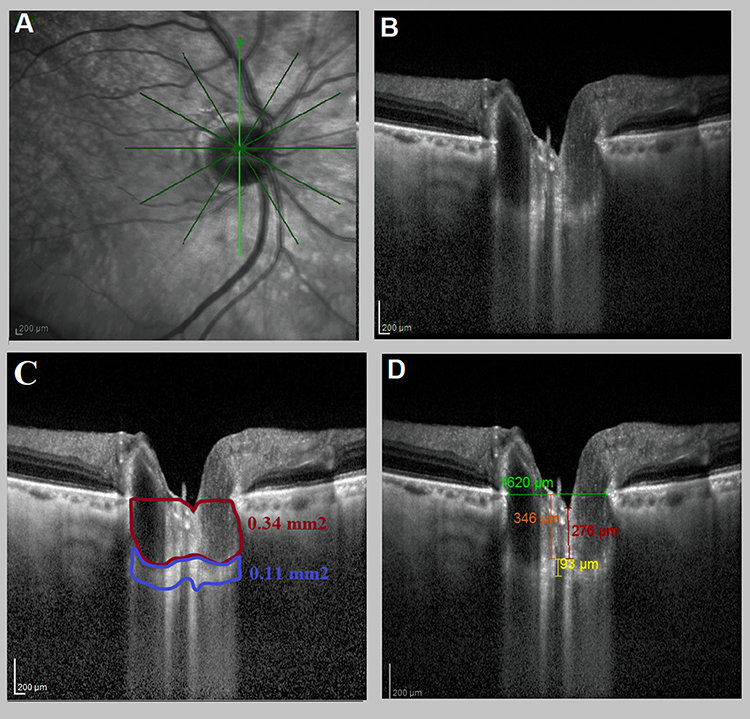 |
Figure 1 Right eye of a mild POAG patient (MD = −4.35). (A) The axial scans of the optic nerve head. (B) The enhanced depth imaging with spectral-domain optical coherence tomography (EDI-OCT) device (Spectralis, Heidelberg Engineering, Heidelberg, Germany) of lamina cribrosa (LC). (C) EDI-OCT assessment of LC showed that: Blue square showing the lamina cribrosa area (0.11 mm2) and the red square prelaminar neural tissue area (0.34 mm2). (D) EDI-OCT assessment of LC showed that: yellow line showing LC thickness 93 µm, red line showing prelaminar neural tissue thickness (276 µm), and orange line showing anterior lamina cribrosa surface depth (346 µm). Green line showing reference line connecting both ends of Bruch’s membrane opening. |
 |
Figure 2 Left eye of a mild POAG patient (MD = −5.51). (A) The axial scans of the optic nerve head. (B) The enhanced depth imaging with spectral-domain optical coherence tomography (EDI-OCT) device (Spectralis, Heidelberg Engineering, Heidelberg, Germany) of lamina cribrosa. (C) EDI-OCT assessment of LC showed that: Blue square showing the lamina cribrosa area (0.14 mm2) and the red square prelaminar neural tissue area (0.31 mm2). (D) EDI-OCT assessment of LC showed that: yellow line showing LC thickness 96 µm, green line showing prelaminar neural tissue thickness (248 µm), and orange line showing anterior lamina cribrosa surface depth (348 µm). Red line showing reference line connecting both ends of Bruch’s membrane opening. |
Statistical Analysis
All data analysis was performed using (SPSS V20) statistical software. Qualitative data were described using frequency and percent. Quantitative data were described using mean, median, standard deviation and range (minimum and maximum). The significance level was set at P-value <0.05.
Results
The baseline demographics and clinical characteristics of the patients are summarized in Tables 1 and 2, respectively.
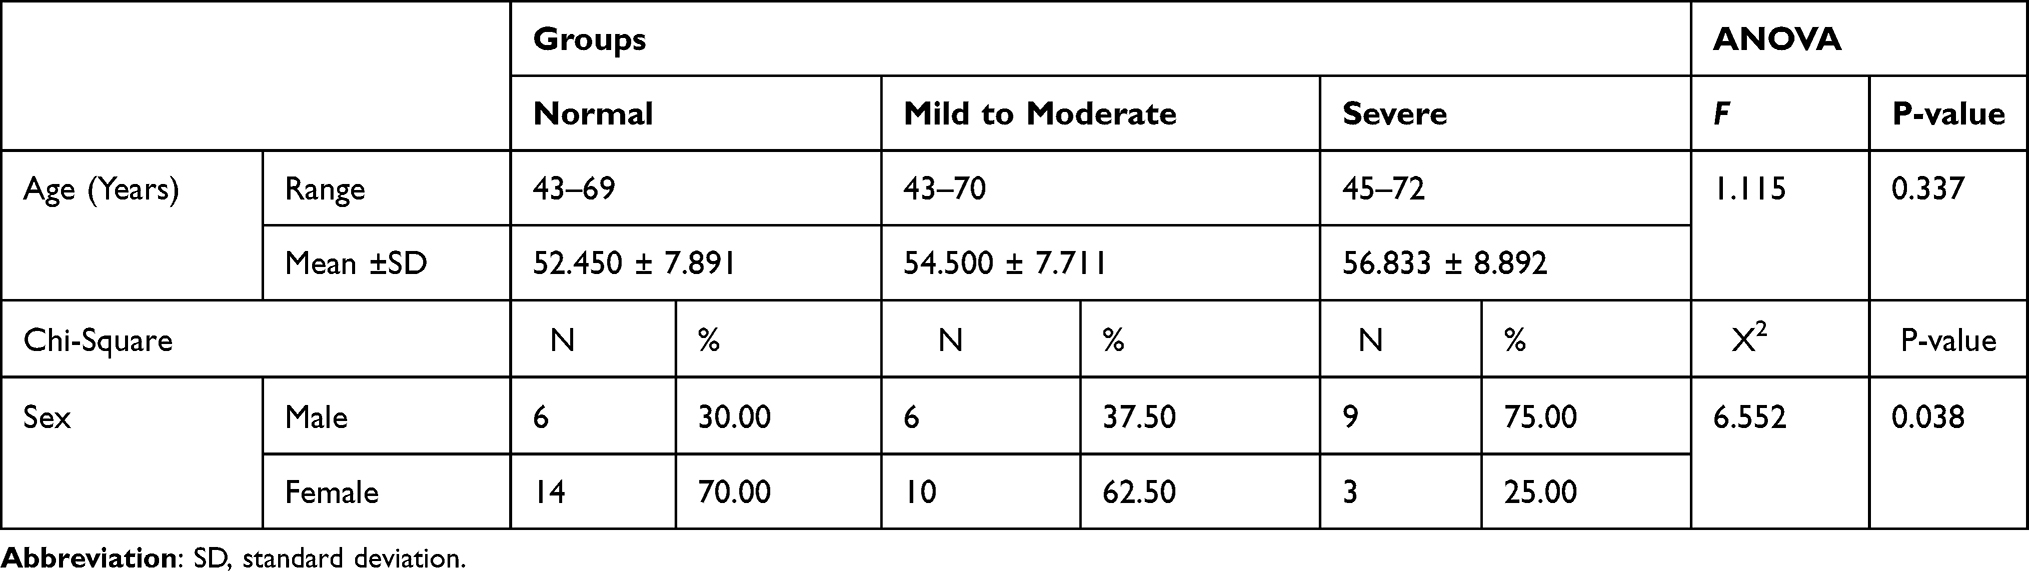 |
Table 1 Demographic Characteristics (the Age and Gender Distribution) of the Study Groups |
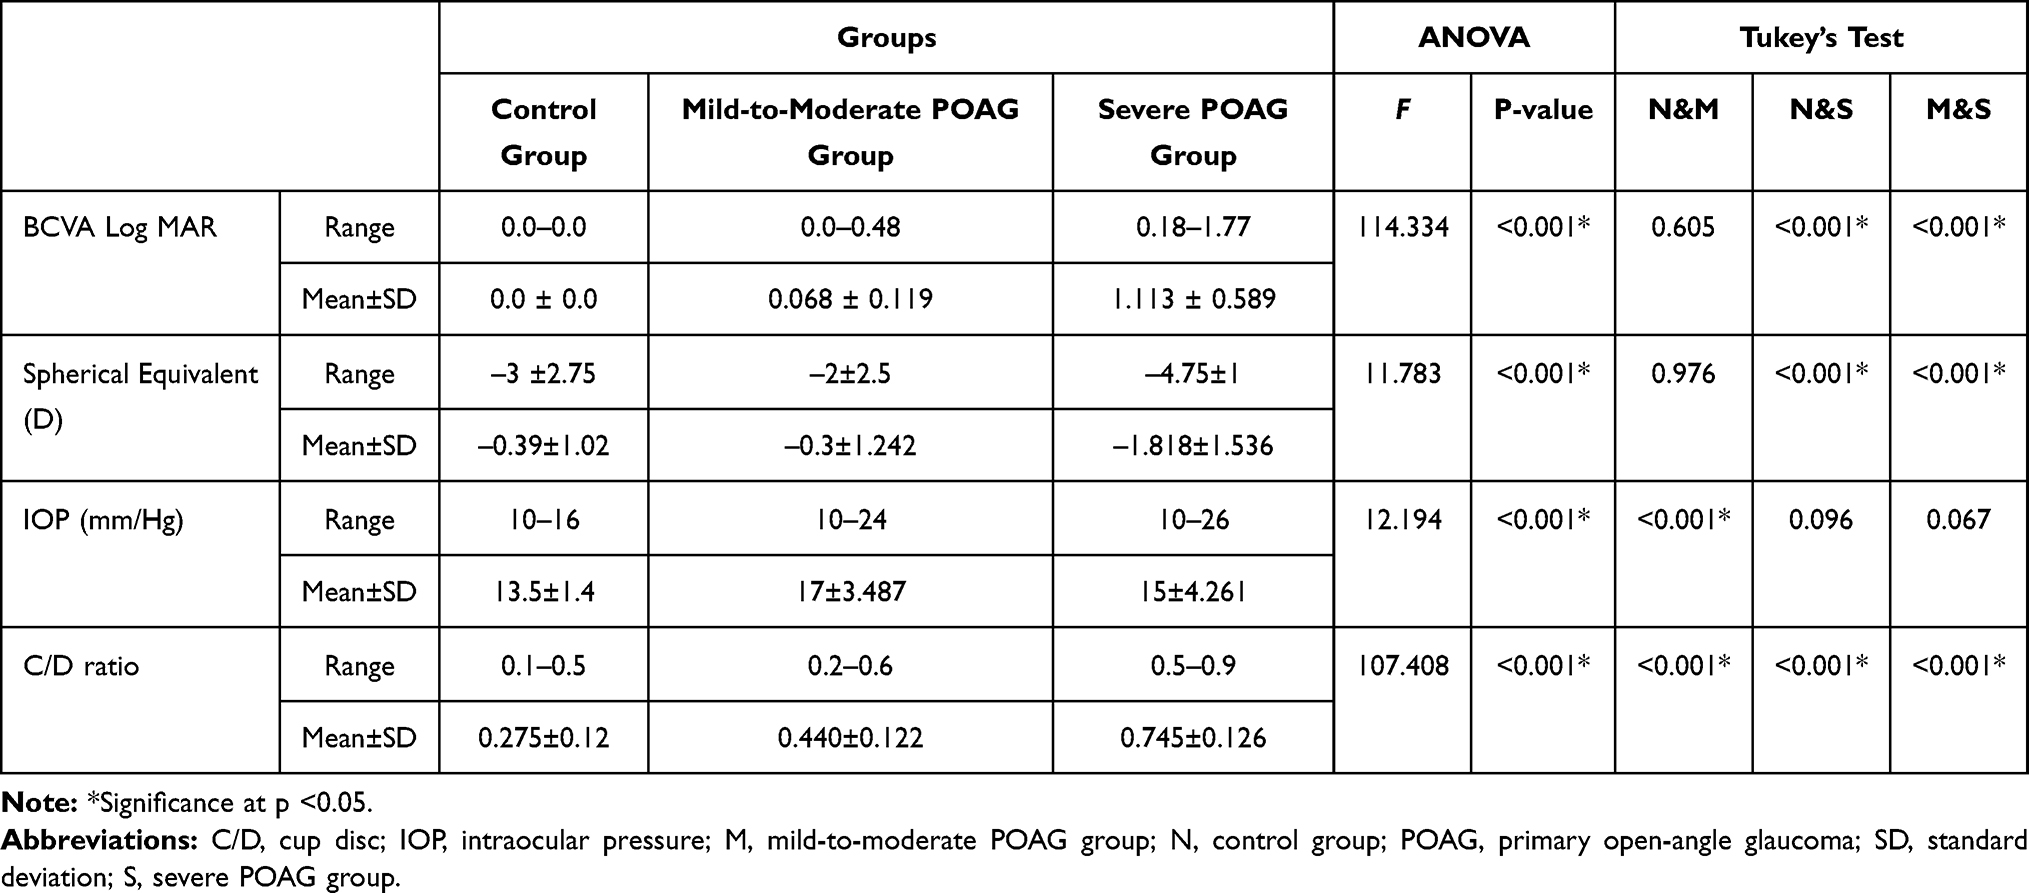 |
Table 2 Clinical Characteristics of the Study Groups |
The mean best corrected visual acuity (BCVA) was 0.068 ± 0.119 LogMAR in mild-to-moderate glaucoma group, 1.113 ± 0.589 LogMAR in the severe glaucoma group and 0.0 ± 0.0 LogMAR in the control group (3). BCVA was significantly lower in the severe glaucoma group than mild-to-moderate glaucoma group and control group, but there was no statistically significant difference between mild-to-moderate and control group. LC thickness and area were not statistically significantly different between all groups (p-value = 0.838 and 0.716, respectively).
The mean PLNT thickness was 158.900 ± 73.689 µm in the mild-to-moderate group, 121.455 ± 70.050 µm in the severe glaucoma group and 217.750 ± 142.378 µm in the control group. PLNT thickness was statistically significant thinner in the severe glaucoma group in comparison to the control group (p-value = 0.003) but not statistically significant between the mild-tomoderate group and control group (p-value = 0.440) and between the mild-to-moderate group and severe glaucoma group (p-value = 0.070). The mean PLNT area was (0.385 ± 0.099 mm2) in the mild-to-moderate glaucoma group, (0.282 ± 0.114 mm2) in the severe glaucoma group and (0.488 ± 0.109 mm2) in the control group. PLNT area was statistically significantly smaller in the severe glaucoma group in comparison to the mild-to-moderate group and normal control group and also between the mild-to-moderate group and control group (Table 3).
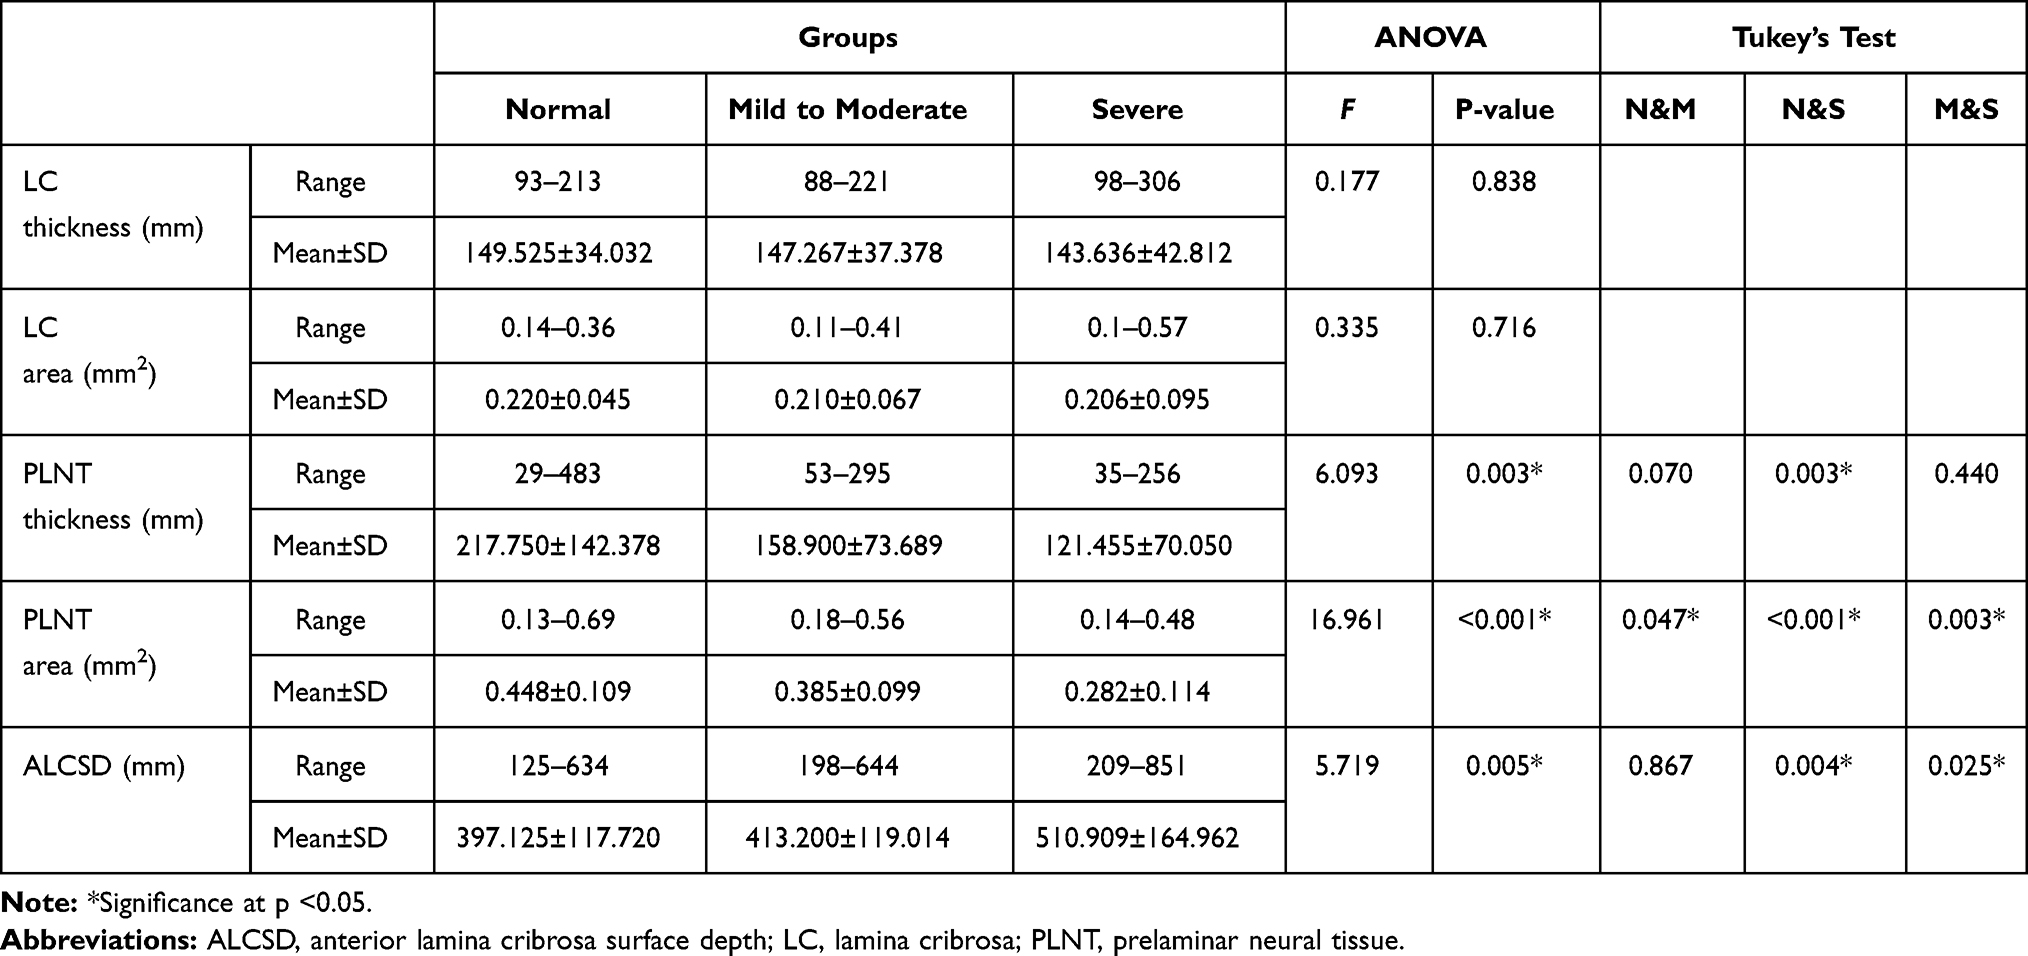 |
Table 3 Optic Nerve Head Parameters in Different Glaucoma Groups |
The mean ALCSD was 413.200 ± 119.014 µm in the mild-to-moderate group, 510.909 ± 164.0962 µm in the severe glaucoma group and 397.125 ± 117.720 µm in the control group. ALCSD was showing a statistically significant increase in the severe glaucoma group in comparison to both the mild-to-moderate group and control group (p-value = 0.004 and p-value = 0.025) but the difference was not statistically significant between the mild-to-moderate glaucoma group and the control group (p-value = 0.867).
There was a statistically significant positive correlation between MD and PLNT thickness and PLNT area (P-value=0.023 and <0.001, respectively) and a statistically significant negative correlation between MD and anterior lamina cribrosa surface depth (P-value= 0.002). Also, there was no statistically significant correlation between MD and LC thickness, LC area (P-value=0.395 and 0.644) (Table 4).
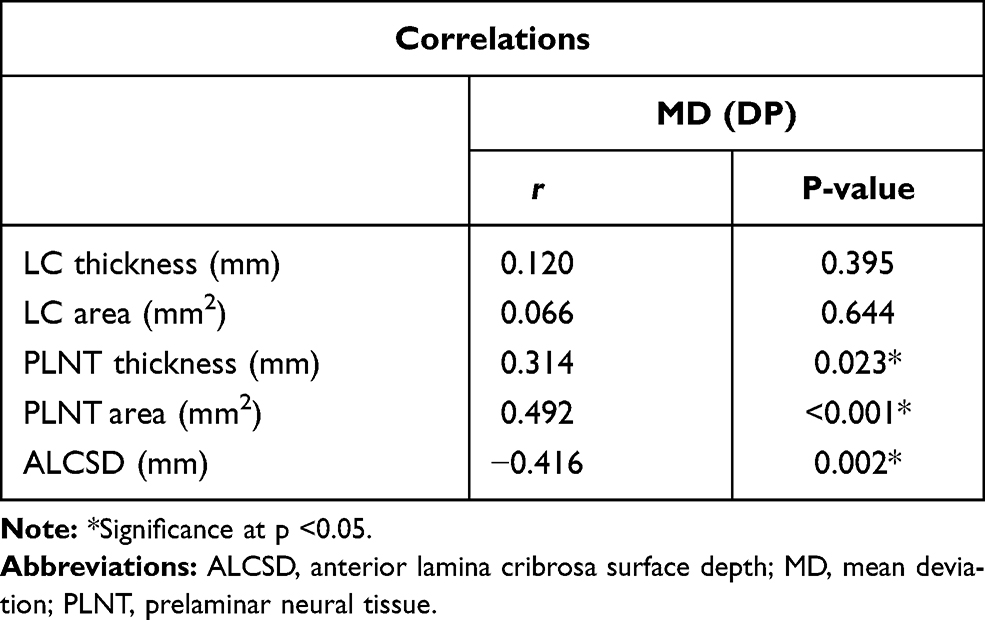 |
Table 4 Correlation Between Mean Deviation of Visual Field and Optic Nerve Head Parameters |
Discussion
Glaucoma is a worldwide leading cause of an irreversible decrease in quality of life and vision loss.1 Glaucomatous damage is typically characterized by structural changes such as distinct cupping of the ONH and thinning of the RNFL associated with functional loss (patterns of VF defects).14,15
EDI-OCT is a new approach in OCT that has been shown to reliably capture images of the retina and choroid in various ocular diseases16 and can capture images of deep structures within ONH such as LC and PLNT.17,18 This approach shows promising progress that can help for diagnosis and follow-up for the structural changes that occur in glaucomatous patients.17,18
In the present study, we used EDI-OCT imaging for the assessment of structural changes of ONH in POAG patients. The parameters of interest were LC thickness, LC area, PLNT thickness, PLNT area and the ALCSD. These parameters were analyzed and correlated with mean deviation of the visual field, which considered the parameter of functional deterioration in POAG patients.
In the current study, LC thickness and area were not statistically significantly different between all groups. This agreed with Lopes et al18 who conducted a study on a total of 73 eyes from 73 participants (39 patients with glaucoma and 34 controls). He found insignificant differences in LC thickness or area when compared between the enrolled healthy participants and glaucomatous patients with a broad range of disease stages.
Contrary to these results, Fayed19 concludes that there is a generalized decrease in LC thickness in the glaucomatous patients compared with healthy controls and the LC morphology can help differentiate normal eyes from glaucomatous eyes. The mean values of the LC thickness in the POAG group were 188.4±15.8 μm and the mean values of the LC thickness in the normal control group were 395.6 ± 20.6 μm. This may be explained by the absence of IOP lowering medication effect on lamina cribrosa biomechanics in his study.
Contrary to our study, Kim et al20 and Park et al17 found that LC thickness decreased with the progression of the disease severity.
In the present study, prelaminar neural tissue thickness was statistically thinner in the severe glaucoma group than in the control group. This coincides with Lopes et al18 who showed that the PLNT parameters significantly decreased in glaucomatous eyes than control eyes.
The current study shows a statistically significant positive correlation between MD and PLNT area and a negative correlation between MD and ALCSD. No statistically significant correlation between MD and LC thickness, LC area, PLNT thickness.
In agreement with the results in the present study, Lopes et al18 found no significant correlations were found for LC thickness or area when compared with both VF MD in enrolled healthy participants and glaucomatous patients with various stages of disease stages. Also, Daguman and Delfin21 study detected no strong correlation between LC thickness to the severity of VF test results (LC thickness r=0.160, p=0.274).
Contrary to the results of the present study, Kim et al20 found a significant correlation with LC thickness, with greater severity and VF deterioration associated with decreasing LC thickness. Also, Fayed19 study results were against these results as he found that there was a significant positive correlation between LC thickness and VF MD in glaucomatous patients.
On the contrary of the current study, the study carried out by Park et al17 concluded that the LC thickness showed a significant positive correlation with VF MD. In early POAG patients, LC thickness was 277.30 ± 49.82 μm; in moderate POAG patients, the LC thickness was 205.26 ± 20.73 μm; and in severe POAG patients, LC thickness was 165.44 ± 9.32 μm. In early NTG patients, LC thickness was 192.44 ± 19.87 μm; in moderate NTG patients LC thickness was 154.16 ± 11.05 μm; and in severe NTG patients, LC thickness was 147.22 ± 8.33 μm.
In agreement with the results in the present study, Lopes et al18 found significant structure-function positive correlations were found between VFI values and PLNT area (R2 = 0.20).
This agreed with Fayed19 found that there was a significant negative correlation between ALCSD and VF MD. Also, Kim et al20 found a significant negative correlation with ALCSD with greater severity associated with increasing ALCSD.
Conclusion
EDI-OCT is a valuable tool for evaluation of structural changes in LC and ONH and it has been suggested that it be used in the routine monitoring of patients with POAG.
Disclosure
The authors report no conflicts of interest in this work.
References
1. Casson RJ, Chidlow G, Wood JPM, Crowston JG, Goldberg I. Definition of glaucoma: clinical and experimental concepts. Clin Experiment Ophthalmol. 2012;40(4):341–349. doi:10.1111/j.1442-9071.2012.02773.x
2. Malik R, Swanson WH, Garway‐Heath DF. The ‘structure-function’ relationship in glaucoma – past thinking and current concepts. Clin Experiment Ophthalmol. 2013;40(4):369–380.
3. Grzybowski A, Och M, Kanclerz P, Le C, De Moraes CG. Primary open angle glaucoma and vascular risk factors: a review of population based studies from 1990 to 2019. J Clin Med. 2020;9(3):761. doi:10.3390/jcm9030761
4. Chen Z, Zheng X, Shen H, Zeng Z, Liu Q, Li Z. Combination of enhanced depth imaging optical coherence tomography and fundus images for glaucoma screening. J Med Syst. 2019;43(6). doi:10.1007/s10916-019-1303-8
5. Rozpędek-Kamińska W, Wojtczak R, Szaflik JP, Szaflik J, Majsterek I. The genetic and endoplasmic reticulum-mediated molecular mechanisms of primary open-angle glaucoma. Int J Mol Sci. 2020;21(11):4171. doi:10.3390/ijms21114171
6. Tham Y-C, Li X, Wong TY, Quigley HA, Aung T, Cheng C-Y. Global prevalence of glaucoma and projections of glaucoma burden through 2040: a systematic review and meta-analysis. Ophthalmology. 2014;121(11):2081–2090. doi:10.1016/j.ophtha.2014.05.013
7. Downs JC, Girkin CA. Lamina cribrosa in glaucoma. Curr Opin Ophthalmol. 2017;28(2):113–119. doi:10.1097/ICU.0000000000000354
8. Ling YTT, Shi R, Midgett DE, Jefferys JL, Quigley HA, Nguyen TD. Characterizing the collagen network structure and pressure-induced strains of the human lamina cribrosa. Investig Ophthalmol Vis Sci. 2019;60(7):2406–2422. doi:10.1167/iovs.18-25863
9. Yu J, Gu R, Zong Y, et al. Relationship between retinal perfusion and retinal thickness in healthy subjects: an optical coherence tomography angiography study. Invest Ophthalmol Vis Sci. 2016;57(9):OCT204–10. doi:10.1167/iovs.15-18630
10. Abe RY, Gracitelli CPB, Diniz-Filho A, Tatham AJ, Medeiros FA. Lamina cribrosa in glaucoma: diagnosis and monitoring. Curr Ophthalmol Rep. 2015;3(2):74–84. doi:10.1007/s40135-015-0067-7
11. Gracitelli CPB, Zangwill LM, Diniz-filho A, et al. Detection of glaucoma progression in individuals of African descent compared with those of European Descent. JAMA Ophthalmol. 2018;136(4):329–335. doi:10.1001/jamaophthalmol.2017.6836
12. Weinreb RN, Leung CKS, Crowston JG, et al. Primary open-angle glaucoma. Nat Rev Dis Primers. 2016;2:16067. doi:10.1038/nrdp.2016.67
13. Budenz DL, Rhee P, Feuer WJ, McSoley J, Johnson CA, Anderson DR. Comparison of glaucomatous visual field defects using standard full threshold and Swedish interactive threshold algorithms. Arch Ophthalmol (Chicago, Ill 1960). 2002;120(9):1136–1141. doi:10.1001/archopht.120.9.1136
14. Weinreb RN, Aung T, Medeiros FA. The pathophysiology and treatment of glaucoma: a review. JAMA. 2014;311(18):1901–1911. doi:10.1001/jama.2014.3192
15. Tun TA, Atalay E, Baskaran M, et al. Association of functional loss with the biomechanical response of the optic nerve head to acute transient intraocular pressure elevations. JAMA Ophthalmol. 2018;136(2):184–192. doi:10.1001/jamaophthalmol.2017.6111
16. Dell’omo R, Costagliola C, Salvatore F, Cifariello F, Dell’Omo E. Enhanced depth imaging spectral-domain optical coherence tomography. Retina. 2010;30:378–379. doi:10.1097/IAE.0b013e3181c771eb
17. Park HYL, Jeon SH, Park CK. Enhanced depth imaging detects lamina cribrosa thickness differences in normal tension glaucoma and primary open-angle glaucoma. Ophthalmology. 2012;119(1):10–20. doi:10.1016/j.ophtha.2011.07.033
18. Lopes FS, Matsubara I, Almeida I, et al. Structure-function relationships in glaucoma using enhanced depth imaging optical coherence tomography-derived parameters: a cross-sectional observational study. BMC Ophthalmol. 2019;19(1):4–11. doi:10.1186/s12886-019-1054-9
19. Fayed AA-H. Evaluation of the lamina cribrosa morphology in correlation to retinal nerve fiber layer thickness. Delta J Ophthalmol. 2017;18(3):166. doi:10.4103/DJO.DJO_21_17
20. Kim M, Bojikian KD, Slabaugh MA, Ding L, Chen PP. Lamina depth and thickness correlate with glaucoma severity. Indian J Ophthalmol. 2016;64(5):358–363. doi:10.4103/0301-4738.185594
21. Daguman IJ, Delfin MS. Correlation of lamina cribrosa and standard automated perimetry findings in glaucoma and non- glaucoma patients. J Ophthalmic Stud. 2019;2(1):1–5.
 © 2021 The Author(s). This work is published and licensed by Dove Medical Press Limited. The
full terms of this license are available at https://www.dovepress.com/terms
and incorporate the Creative Commons Attribution
- Non Commercial (unported, 3.0) License.
By accessing the work you hereby accept the Terms. Non-commercial uses of the work are permitted
without any further permission from Dove Medical Press Limited, provided the work is properly
attributed. For permission for commercial use of this work, please see paragraphs 4.2 and 5 of our Terms.
© 2021 The Author(s). This work is published and licensed by Dove Medical Press Limited. The
full terms of this license are available at https://www.dovepress.com/terms
and incorporate the Creative Commons Attribution
- Non Commercial (unported, 3.0) License.
By accessing the work you hereby accept the Terms. Non-commercial uses of the work are permitted
without any further permission from Dove Medical Press Limited, provided the work is properly
attributed. For permission for commercial use of this work, please see paragraphs 4.2 and 5 of our Terms.