Back to Journals » International Journal of Chronic Obstructive Pulmonary Disease » Volume 16
Correlation Between 2D Strain and Classic Echocardiographic Indices in the Diagnosis of Right Ventricular Dysfunction in COPD
Authors Masson Silva JB ![]() , Tannus Silva DGS, Furtado RG, da Silva Júnior CG, Araújo FA
, Tannus Silva DGS, Furtado RG, da Silva Júnior CG, Araújo FA ![]() , Costa SDA, Marra da Madeira Freitas E, Rassi DDC
, Costa SDA, Marra da Madeira Freitas E, Rassi DDC ![]() , Rabahi MF
, Rabahi MF ![]() , Rassi S
, Rassi S
Received 10 November 2020
Accepted for publication 4 May 2021
Published 28 June 2021 Volume 2021:16 Pages 1967—1976
DOI https://doi.org/10.2147/COPD.S290957
Checked for plagiarism Yes
Review by Single anonymous peer review
Peer reviewer comments 2
Editor who approved publication: Prof. Dr. Richard Russell
João Batista Masson Silva,1 Daniela Graner Schuwartz Tannus Silva,1 Rogério Gomes Furtado,2 Cloves Geraldino da Silva Júnior,1 Fabrício Alves Araújo,1 Sandra de Araújo Costa,1 Elis Marra da Madeira Freitas,1 Daniela do Carmo Rassi,3 Marcelo Fouad Rabahi,3 Salvador Rassi1,3
1Hospital das Clínicas da Universidade Federal de Goiás, Goiânia, GO, Brazil; 2CDI – Centro de Diagnóstico por Imagem, Goiânia, GO, Brazil; 3Faculdade de Medicina da Universidade Federal de Goiás, Goiânia, GO, Brazil
Correspondence: João Batista Masson Silva
Hospital das Clínicas da Universidade Federal de Goiás, 1ª Avenida, s/n - Setor Leste Universitário, Goiânia, GO, 74.605-020, Brazil
Tel +55 62 981589499
Email [email protected]
Purpose: This study aims to define which of the right ventricular myocardial deformation indices best correlates with the classic echocardiographic measurements and indices of right ventricular (RV) dysfunction in patients with stable chronic obstructive pulmonary disease (COPD).
Patients and Methods: Ninety-one patients with stable COPD underwent clinical evaluation, spirometry, a 6-minute walk test, and echocardiographic examination. Patients were divided into two groups: “with RV dysfunction” (≥ 1 classic parameter) and “without RV dysfunction”. We used speckle tracking to estimate myocardial deformation. For all analyses, results were considered significant if p < 0.05.
Results: The mean age across all participants was 65 ± 9 years, with 53% (48/91) being male. Patients in the group with RV dysfunction were able to walk shorter distances and had higher estimated right ventricular systolic pressure (RVSP) and mean pulmonary arterial pressure (mPAP). The RV free wall longitudinal strain (RVFWLS) was the only deformation indices that showed a significant correlation with all classic measurements and indices in the diagnosis of RV dysfunction (Wald test, 10.24; p < 0.01; odds ratio, 1.61). In the ROC curve analysis, the absolute value < 20% was the lowest cut-off point of this index for detection of RV dysfunction (AUC = 0.93, S: 95.8%, and E: 88%).
Conclusion: In COPD patients, RVFWLS is the myocardial deformation index that best correlates with classic echocardiographic parameters for the diagnosis of RV dysfunction using < 20% as a cut-off point.
Keywords: echocardiography, pulmonary diseases, right ventricle, speckle tracking
Introduction
Chronic obstructive pulmonary disease (COPD) is a prevalent, preventable, and treatable disease whose main characteristics are chronic airflow limitation, small airway changes (obstructive bronchiolitis), and destruction of the lung parenchyma (pulmonary emphysema). Mechanical and structural changes in the pulmonary vascular bed predispose to the onset of a right ventricular failure that initially manifests oligosymptomatically (in the absence of pulmonary hypertension) and evolves with significant clinical repercussions and worsening of prognosis. Despite being under-diagnosed, COPD is currently a significant cause of morbidity and mortality, with a substantial impact on the global health system.1–3
The analysis of right ventricle (RV) systolic function by echocardiography is a challenge due to its complex crescent-moon-shaped morphology and high dependency of preload and afterload conditions, leading to delays in diagnosing RV dysfunction and consequent delays in treatment.4–6 Although it is the gold standard for evaluating RV function, cardiac resonance imaging is seldom used due to its high cost and low availability. Two-dimensional echocardiography is an affordable procedure that has become the most widely used non-invasive method for the study of the RV. However, because it only allows for visualization of a small segment of the RV, which is structurally complex, diagnostic accuracy can suffer. Echocardiographic evaluation has evolved from simple subjective analysis to incorporate quantitative measurements and indices, with cut-offs that define dysfunction (TAPSE – tricuspid annular plane systolic excursion, FAC – fractional area change, MPI – myocardial performance index, and S’-TDI – tricuspid annular systolic velocity derived from tissue Doppler imaging). These are called conventional or classic measurements and indices.7,8
New technologies allow for the measurement of myocardial deformation indices, providing a potent new tool for RV analysis. These indices are derived from two-dimensional (2D) strain measurements obtained through speckle tracking. This technique can track speckles essentially independent of angle of insonation, which is defined as the angle of the ultrasound beam relative to the tissue or organ of interest. The strongest echoes are produced when the angles of incidence approach the angle of reflection. The increasing availability of the strain indices, as well as its lower load dependence and angle of insonation, makes it a promising method for early assessment of RV dysfunction.9–11
This study’s objective is to evaluate the systolic function of the RV in patients with stable COPD by correlating indices of myocardial deformation measured using two-dimensional (speckle tracking) with the classic echocardiographic measurements and indices of RV dysfunction.
Methods
Studied Sample
We conducted this cross-sectional study from May 2014 to June 2015. The ethics committee of hospital approved the trial in compliance with the declaration of Helsinki. All subjects signed an informed consent form (ICF). The study population consisted of 91 patients treated in the pneumology outpatient clinic. All patients were >40 years old and had a diagnosis of COPD based on their history of smoking or occupational exposure and findings of irreversible airway obstruction on spirometry, in compliance with the latest guidelines for diagnosis and management of COPD.12 According to the ABCD classification of Global Initiative for Obstructive Lung Disease (GOLD 2020) for COPD, the patients were classified: 22 as GOLD A, 17 as GOLD B, 13 as GOLD C and 39 as GOLD D.13
Exclusion criteria were lung disease not caused by COPD, systolic and/or diastolic left ventricular dysfunction, significant left and right valvular disease (higher than moderate), critical renal failure (glomerular filtration rate <30 mL/min/m2), inadequate visualization of the edges of the endocardium of the right ventricular wall, making it impossible to analyze the deformation through speckle tracking and clinical decompensation during last month due to acute and transient changes in pulmonary pressure, RV´s diameters and function.14
The patients were divided into two groups according to the echocardiographic criteria of the American consensus for quantification of cardiac chambers: with RV dysfunction (presence of ≥1 of the classic criteria) and without RV dysfunction (absence of the classic criteria). All of the subjects underwent myocardial deformation analysis, general clinical examination, spirometry, and a 6-minute walk test (Figure 1).
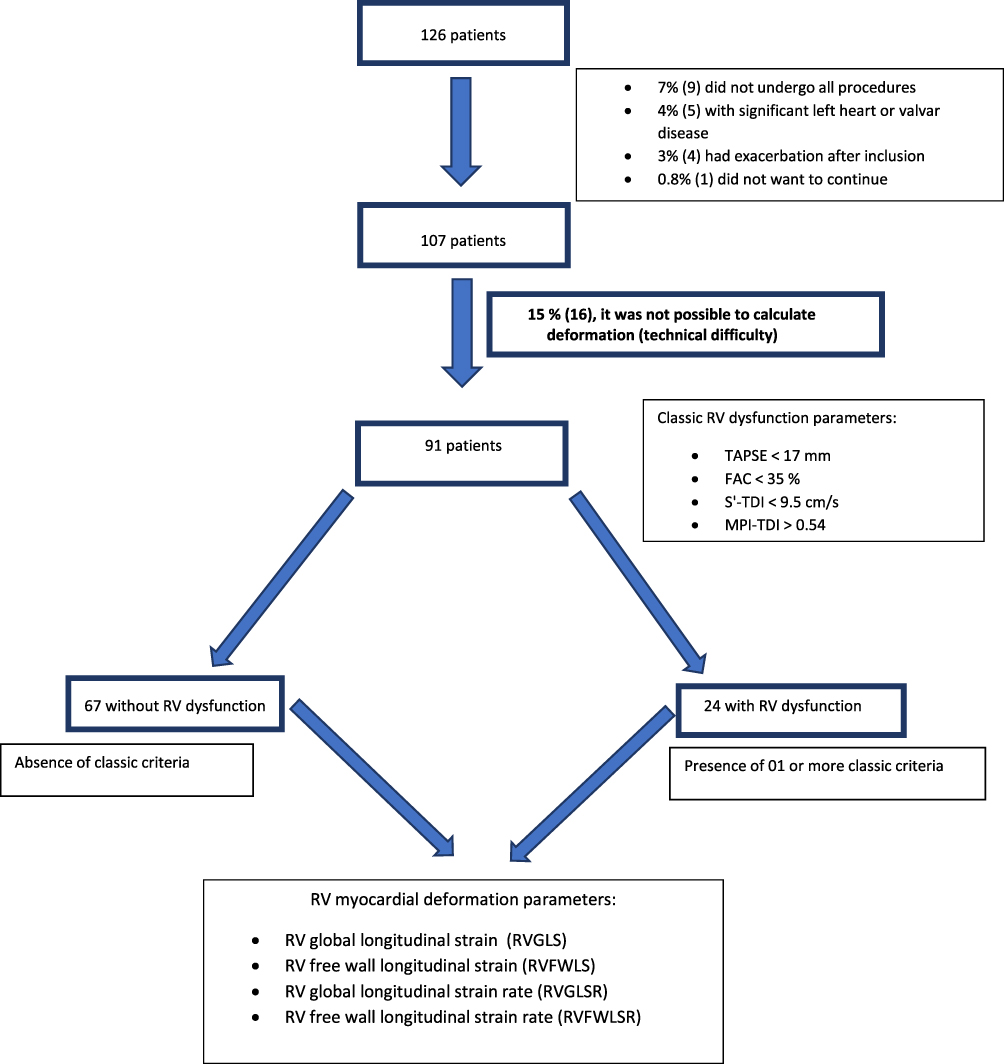 |
Figure 1 Study design. Abbreviations: ECHO, echocardiogram; TAPSE, tricuspid annular plane systolic excursion; FAC, fractional area change; S’-TDI, S-wave velocity derived from tissue Doppler imaging; TEI Index obtained from TDI, myocardial performance index derived by tissue Doppler imaging; RVGLS, right ventricle global longitudinal strain; RVFWLS, right ventricle free wall longitudinal strain; RVGLSR, right ventricle global longitudinal strain rate; RVFWLSR; RV free wall longitudinal strain rate. |
BODE Index
A multidimensional scale ranging from 0 to 10, calculated using four components: body mass index (0–1), FEV1% predicted after a bronchodilator (0–3), modified dyspnoea scale (0–3) and walking distance during the 6-minute walk test (0–3).15
Spirometry
We performed spirometric analysis before and after bronchodilator use using the following spirometer: MasterScope PC, Jaeger; VIASYS Healthcare Inc., Yorba Linda, CA, USA. The protocol, contraindications for performing spirometry, and the reference table for the Brazilian population were taken from the guidelines of the Brazilian Society of Pulmonology and Phthisiology.16
Six-Minute Walk Test
All patients underwent the 6-minute walk test supervised by trained physiotherapists following the American Thoracic Society protocol.17
Dyspnea Scale
We assessed dyspnea based on the Medical Research Council (mMRC) scale, with the following scoring system: 0 – Dyspnea only with strenuous exercise, 1 – Dyspnea when hurrying or walking up a slight hill, 2 – Walks slower than people of the same age because of dyspnea or has to stop for breath when walking at own pace, 3 – Stops for breath after walking 100 yards (91 m) or after a few minutes, 4 – Too dyspneic to leave house or breathless when dressing.18
Echocardiographic Analysis
All patients underwent a complete echocardiographic examination by a single echocardiographer using an ESAOTE MyLab 30 Gold Cardiovascular echocardiography equipped with a 2.5–3.5 MHz multifrequency transducer. The examiner knew the clinical status of the patients when the echocardiography recordings were analyzed. The images were acquired in the left lateral decubitus (parasternal and apical windows) and supine decubitus (subcostal and suprasternal windows) using respiratory maneuvers when applicable (inspiration or expiration associated with a short period of apnea). Measurements of the left chambers were obtained in the long-axis parasternal plane, and the LV ejection fraction was estimated using the Teichholz formula. Measurements of basal, middle and apical diameters of the RV were obtained in the 4-chamber apical plane. Right ventricular outflow tract (RVOT) and main pulmonary artery measurements were taken, respectively, in the long- and short-axis parasternal planes at aortic and pulmonary valve level. Measurements of TAPSE (M-mode), S-wave peak velocity derived from tissue Doppler imaging (S’-TDI), fractional area change (FAC), and myocardial performance index (MPI-TDI) were taken in the 4-chamber apical plane. MPI-TDI calculation relied on the formula MPI = ICT + IVRT/ET. ICT, IVRT, and ET were all measured using tissue Doppler imaging. The fractional area change (FAC) was obtained by tracing the endocardial borders of the RV during systole and diastole and using the formula FAC = (RV area during diastole – RV area during systole)/RV area during diastole. The mean pulmonary arterial pressure (mPAP) was estimated from the pulmonary velocity acceleration time (PVAT), measured using pulsed-wave Doppler during systole. The formula mPAP = 79 – (0.45 x PVAT) was used when PVAT > 120 ms and corrected mPAP = 90 – (0.62 X PVAT) when PVAT < 120 ms. The classic measurements and indices for RV dysfunction were defined as tricuspid annular plane systolic excursion (TAPSE) values <17 mm, myocardial performance index derived from tissue Doppler imaging (MPI-TDI) >0.54, RV fractional area change (FAC) <35%, and S-wave peak velocity derived from tissue Doppler imaging (S’-TDI) <9.5 cm/s. Three consecutive beats of the heart cycle were used when the classical indices were analyzed. The anatomical and hemodynamic analysis of the LV and RV were performed in accordance with recommendations of American Society of Echocardiography.19,20
Data for analysis of deformation (RV free wall and global strain rate and strain) were acquired in the 4-chamber apical projection, with good electrocardiographic signal quality (QRS with satisfactory amplitude) and frame rate between 40 and 70 frames per second. Three consecutive beats of the heart cycle were digitally stored and analyzed using MylabDesk Xtrain® software. We adapted the left ventricular 4-chamber apical mode for the study of the right ventricle by replacing the inferoseptal LV wall with the RV free wall and the anterolateral wall with the interventricular septum. At the end of diastole, the following points are sequentially marked: RV free wall baseline, interventricular septum baseline, and RV apex. The software automatically generates lines perpendicular to the walls of the RV and septum. After manual marking of the intersection of these lines with the endocardium, processing the point tracking with a manual tracing of the RV interventricular septum and free wall points is requested. After processing, strain and strain rate plots are obtained automatically. Evaluation of the six segments of the RV (basal, middle, and apical septal wall + basal, middle, and apical RV free wall) provides the strain and global strain rate of the RV (RVGLS – RV global longitudinal strain and RVGLSR – RV global longitudinal strain rate). Isolated analysis of the 3 RV free wall segments (after exclusion of the basal, middle and apical regions of the interventricular septum) provides the deformation and strain rate of the RV free wall (RVFWLS – RV free wall longitudinal strain and RVFWLSR – RV free wall longitudinal strain rate).
Statistical Analysis
We analyzed the data using the SPSS statistical package, 23.0. We verified data normality using the Shapiro–Wilk test. We characterized patients with and without RV dysfunction using contingency tables with absolute (n) and relative (%) frequency values for categorical variables and descriptive statistics (mean and standard deviation) for continuous variables. We compared patients with and without RV dysfunction using Student’s t, Mann–Whitney’s, and Pearson’s Chi-square tests, adopting a significance level of 5%. We performed a Pearson correlation to verify the relationship between myocardial deformation parameters and classic parameters of right ventricular dysfunction. We conducted a binary logistic regression analysis to evaluate which of the myocardial deformation parameters best correlates with the diagnosis of RV dysfunction according to the classic parameters.
Results
We describe the clinical and demographic characteristics of patients in Table 1. The mean age of the patients was 62 ± 9 years, and 52.7% were male. The LV ejection fraction was similar in both groups. Of the 24 patients diagnosed with RV dysfunction, 80% (19) had MPI-TDI >0.54, 25% (6) had FAC < 35%, 25% (6) had S wave velocity -TDI < 9.5 cm/s, and 21% (5) had TAPSE < 17 mm. The group with RV dysfunction had a lower walking distance in the six-minute test and higher BODE index value (calculated as the sum of scores for body mass index, FEV1% post-bronchodilator, degree of dyspnoea by the mMRC scale, and walking distance in the six-minute walk test). The variables smoking, arterial hypertension, diabetes mellitus, heart diseases, and dyslipidemia were balanced across the groups with and without RV dysfunction.
 |
Table 1 Characterization of the Profile of Patients with and without RV Dysfunction |
The group without RV dysfunction had better spirometric data and lower mPAP (estimated by the pulmonary velocity acceleration time), lower right ventricular systolic pressure (estimated by tricuspid regurgitation), and RV diameters measured at its base and distally to its outflow tract (Table 2).
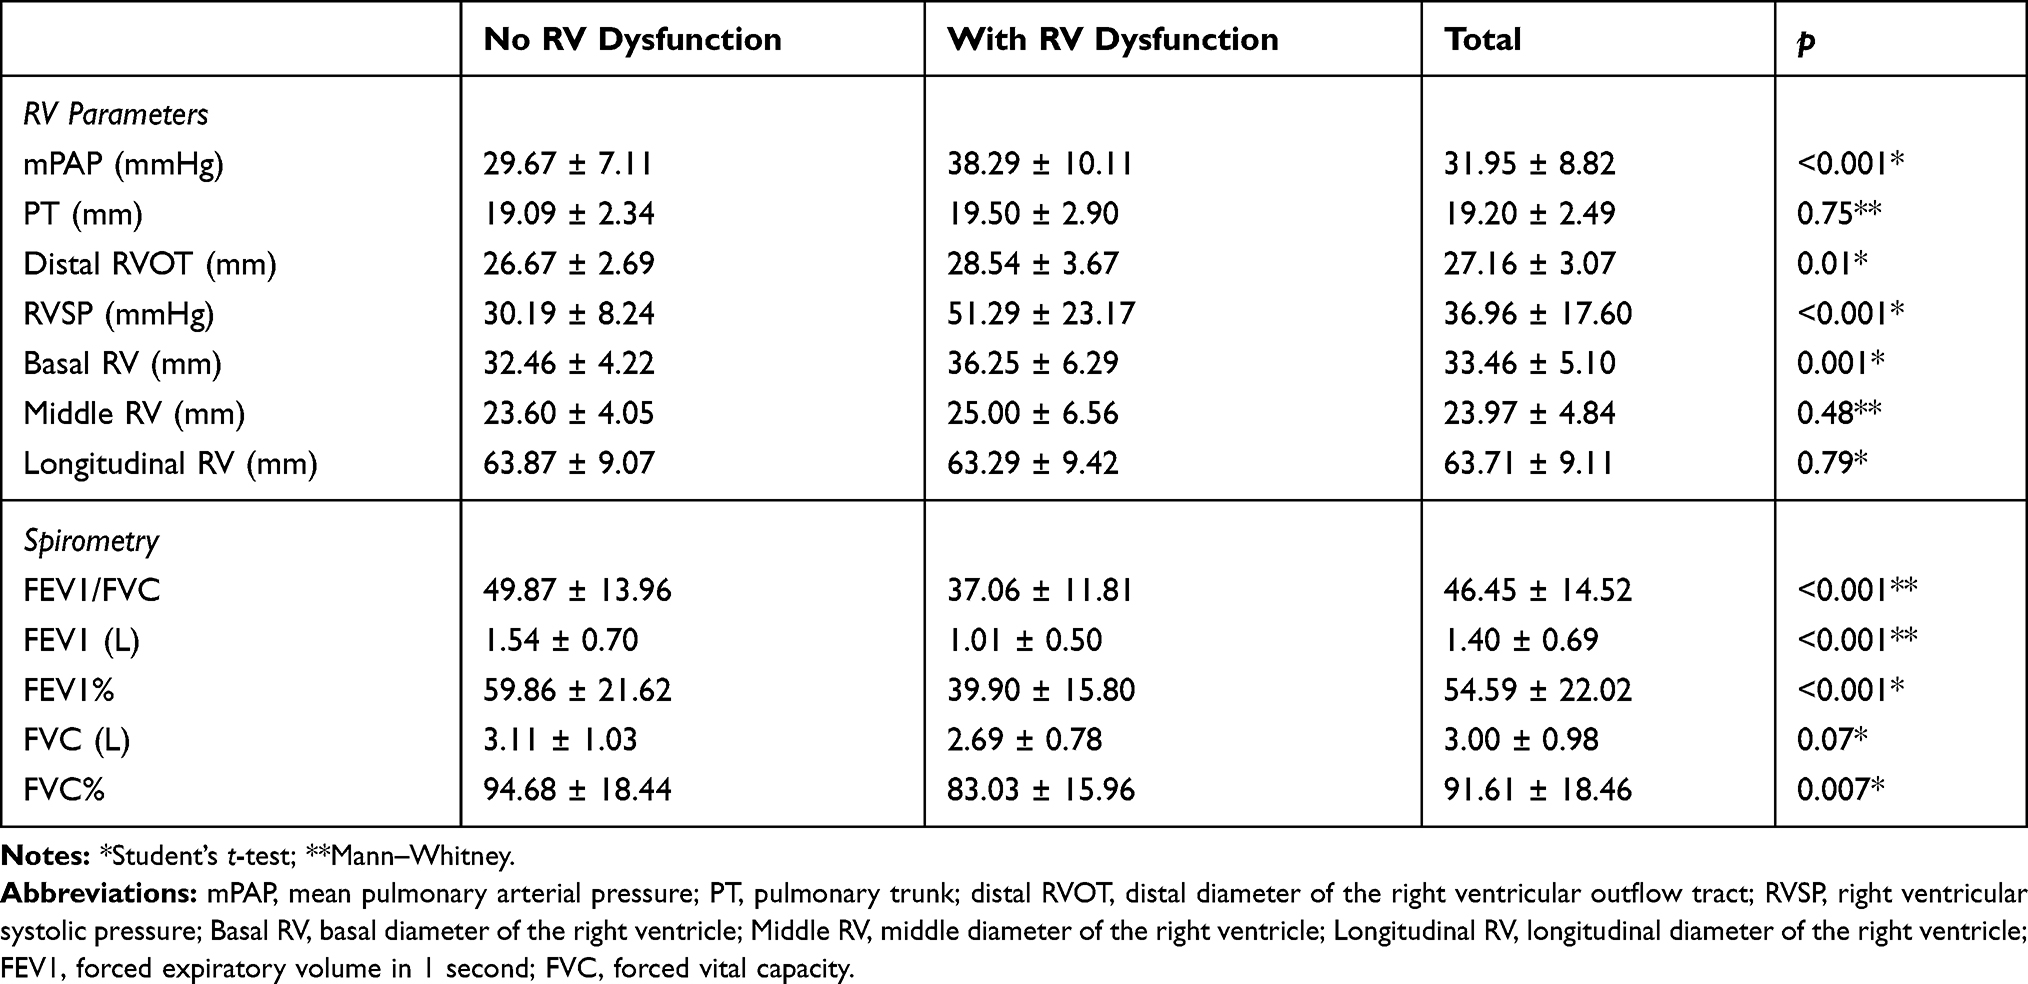 |
Table 2 Characterization of the RV and Spirometric Data of Patients with and without RV Dysfunction (Mean ± SD) |
The values of the four myocardial deformation indices were significantly lower in the group categorized with dysfunction in the univariate analysis, and RVFWLS presents a significantly higher difference, with a calculated t of 8.03 (Table 3). Multivariate analysis with logistic regression confirmed RVFWLS as an independent index associated with the diagnosis of right ventricular dysfunction (p<0.001, OR 1.61, Wald 10.4) (Table 4).
 |
Table 3 Comparison of Myocardial Deformation Values Between Groups with and without RV Dysfunction |
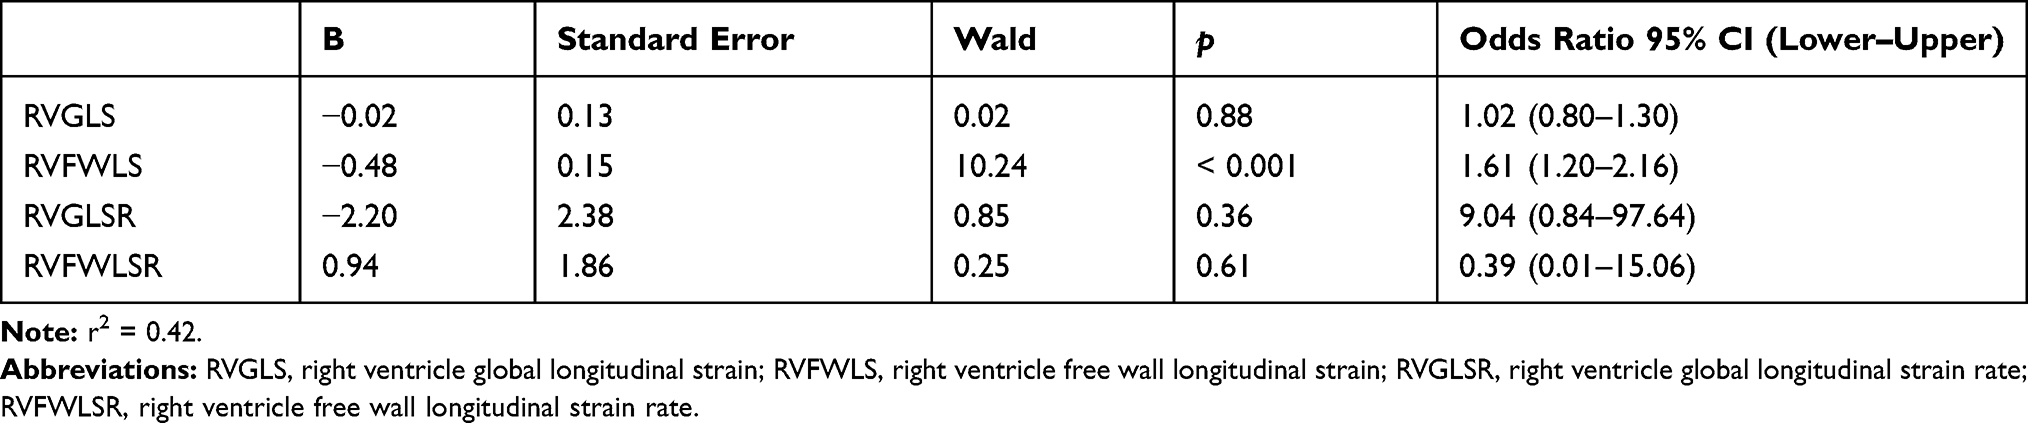 |
Table 4 Result of Binary Logistic Regression Analysis |
We also looked for correlations between the deformation indices and the classic measurements and indices for right ventricular dysfunction. We observed that RVFWLS is the only index that has a statistically significant correlation with all four classic measurements and indices, the correlation with the highest significance being with the myocardial performance index – MPI-TDI (Table 5).
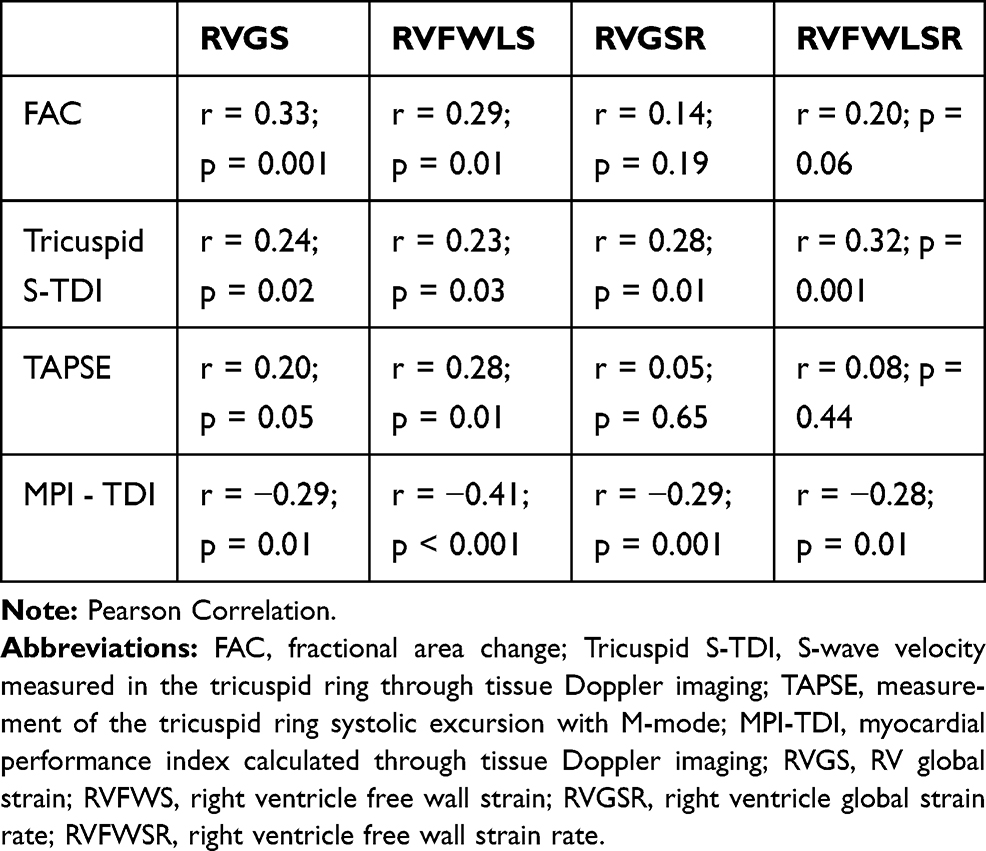 |
Table 5 Correlation Between Myocardial Deformation Parameters of the RV and Classic Echocardiographic Parameters |
To assess the accuracy of RVFWLS as a diagnostic test for RV dysfunction, we plotted an ROC curve using the classic measurements and indices to determine the ground truth diagnosis. The area under the curve was 0.93 (95% CI = 0.87–0.98, and p<0.001) (Figure 2). Using this curve, we determined that the absolute value of RVFWLS < 20% is the optimal cut-off criterion for diagnosis of RV dysfunction.
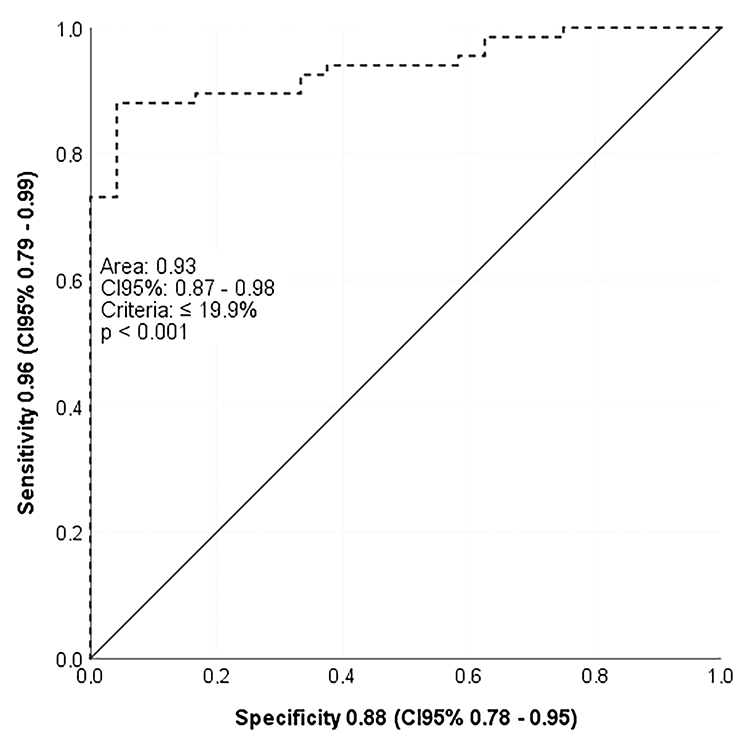 |
Figure 2 ROC curve demonstrated the optimal cut-off criterion for diagnosis of right ventricle dysfunction (RVFWLS < 20%). |
Discussion
In the studied sample, 25% of patients with stable COPD were diagnosed with RV dysfunction based on classic echocardiographic measurements and indices (FAC, TAPSE, S’-TDI, and MPI-TDI). We can justify the satisfactory correlation of right ventricular function with clinical, spirometric and echocardiographic measurements and indices by the fact that the sample consists of clinically compensated patients who do not present significant changes in load conditions. MPI-TDI was the most frequent classic index altered in patients with dysfunction (80%), likely because it evaluates both systolic and diastolic function of the RV. However, there is no consistent data to define the best measurements and indices for use because each of them is highly influenced by loading conditions. These measurements and indices also try to capture the function of a chamber with complex anatomy using analysis of just a small segment.21
Similar to the findings of Gokdeniz et al, we found a higher BODE index in the group of patients with dysfunction, suggesting that the classic measurements and indices were able to identify patients with changes in RV function. Higher values of this multidimensional scale, as demonstrated in other studies, are associated with a higher number of exacerbations, worse quality of life, right ventricular dysfunction, and worse survival with increased mortality from all causes and from respiratory disease.22–25
The value of the estimated PmAP obtained indirectly through the time of acceleration of the pulmonary flow is overestimated when compared with the invasive measures obtained directly through the right cardiac catheterization. In our sample, the PmAP value was higher than that observed in previous studies of pulmonary hypertension in COPD patients. This fact can be attributed to the index chosen in our study, which may not correspond to the real scenario. There was no comparison of this index with an invasive measure in our study, so it is not possible to infer the diagnosis of pulmonary hypertension accurately. What can be inferred comparatively is that for the patients that present at least one classic criterion of right ventricular dysfunction, the estimated values of the PmAP are superior to the value found in patients that do not present any classic criteria of right ventricular dysfunction.26,27
The four studied RV myocardial deformation indices had significantly lower values in the group with dysfunction, consistent with findings showing that in cases of dysfunction, there is worse deformation. Similar to our findings, Smolarek et al and Felix et al concluded that RVGLS (including interventricular septum) is a promising index for RV dysfunction because it is significantly correlated with classic echocardiographic measurements and indices. We also observed that the mean RV free wall (RVFWLS) index was more significantly different between groups with and without dysfunction, thus showing that this index has some superiority to detect RV dysfunction over the others.9,28
When evaluating correlations between classic and deformation indices, we find that RVFWLS is the only deformation index to exhibit significant results with all classic parameters. Da Costa Junior et al found a more significant correlation between RVFWLS and classic parameters compared to our study, likely because their sample consisted of patients who had already been diagnosed with primary pulmonary hypertension, thus indicating greater disease severity. The lower disease severity in the patients included in the present study may explain the more modest correlation found here.29
Multivariate analysis shows that RVFWLS is the index that best correlates with the diagnosis of RV dysfunction in this population. These findings are consistent with those described in the literature, and can be explained by the fact that RV performance depends mainly on myocardial contraction elicited by the longitudinal fibers (80% of them are located on the RV free wall). On the other hand, septal interdependence (produced by the contribution of LV fiber contraction) may explain why we achieve lower accuracy in RV dysfunction diagnosis when the interventricular septum is included in the calculation of global deformation of the RV (RVGLS).9,30,31
Therefore, we confirm that removing the interventricular septum analysis produces a purer index (RVFWLS) with higher predictive power in the diagnosis of right ventricular dysfunction compared to classic measurements and indices. Therefore, we confirm that removing the interventricular septum analysis produces a purer index (RVFWLS) that may even serve as a more accurate diagnostic than the classic measurements and indices. This is probably because the deformation indices can evaluate a moderate amount of myocardial fibers. In contrast, the classic measurements and indices do so in a localized way, inferring that the analysis of a small segment of such a complex anatomical structure can represent its global function. Deformation rates, in turn, reflect the speed at which it occurs and shows more modest results.29,32
The echocardiogram exams obtained in this study were performed on equipment used worldwide; however, there are fewer studies with this manufacturer when compared to GE and Philips. The data presented are close to those recommended by the guidelines, demonstrating the robustness of the method despite the differences in values between the software.33
Park and Lang showed that, in healthy populations, RVGLS values are slightly higher than RVFWLS values. They suggest adopting absolute values between 16% and 20% for RVGLS and between 18% and 22% for RVFWLS as the lower limit of normal.30,34 We define, similarly to these new findings and the recommendations of the last consensus for chamber quantification of the American Society of Echocardiography, the absolute value <20% of RVFWS as a cut-off point for right ventricular dysfunction in patients with clinically stable COPD.35
There was a weaker correlation between RV global (RVGLSR) and free wall (RVFWLSR) strain rate when compared with all classic measurements and indices of right ventricular dysfunction used in this study. Likely, this correlation is weak because RVGLSR and RVFWLSR have better accuracy in evaluating segmental changes, and the analysis carried out encompassed a set of segments. The strain rate requires a higher frame rate than the strain, which is not always easy to achieve, especially in such a complex anatomical structure like RV associated with a limited acoustic window that is usual in patients with COPD.36
There are no guidelines or recommendations for the training requirements to achieve competency in obtaining strain images, but according to Chan J et al, there is a significant learning curve associated with strain analysis and they recommend a minimum of 50 studies for training to achieve competency in GLS analysis.37 Despite the need for additional special software in conventional echocardiogram equipment, this new technology is increasingly available, with modern software that allows the automatic quantification of the myocardium strain with minimal need for correction of border recognition. The technical applicability of the two-dimensional strain depends primarily on the quality of the acquired images, and the correct detection of endocardial border is the primary determinant. Despite the difficulties posed by pulmonary insufflation in COPD, we succeeded in performing strain with acceptable quality in 85% of our sample. This figure is close to that described by Iacoviello et al, Guendouz et al and Rimbas et al, who report that this technique cannot be used in 11% of the general population.31,38,39
Transthoracic echocardiography is a non-invasive, fast, and affordable method, and has gained increasing importance in the process of right ventricular evaluation. Among echocardiographic techniques, myocardial deformation analysis through speckle tracking is subject to low interference from the translational movement of the heart, Doppler angle, and preload and afterload states. The technique also exhibits good correlation with cardiac resonance (gold standard), supporting deformation analysis as a reliable and easy-to-use technique in the diagnosis of right ventricular dysfunction.40
Limitations
The study’s main limitations are the punctual observational methodology of the sample, the absence of magnetic resonance imaging as a gold standard for diagnosis of right ventricular dysfunction, and the absence of intraobserver variability calculation.
The gold standard for evaluating RV dysfunction is analysis of RV volumes and ejection fraction by cardiac resonance, which is a non-invasive, non-radioactive, three-dimensional examination, free of thoracic limitations. Restrictions such as high cost, low availability, long duration of each exam, exclusion of patients with metallic prostheses, and claustrophobia make it impossible to use it routinely in diagnosing or monitoring RV dysfunction.7,8 Unfortunately, we were unable to use this image method because it was not available in our institution.
Conclusion
In patients with stable COPD, RVFWLS is the myocardial deformation index that best correlates with classic echocardiographic indices for the diagnosis of right ventricular dysfunction.
Ethical Approval
The study was approved by the Ethics Committee of the Hospital das Clínicas da Universidade Federal de Goiás (number: 3.099.214; CAAE: 02847918.2.00005078). Before the commencement of the study, a formal letter was given to the Department of Internal Medicine. Written consent was obtained from each study participant after explaining the purpose of the study. All the participants were informed about the confidentiality of their information.
Disclosure
All authors declare no competing financial interests and report no conflicts of interest for this work.
References
1. Hilde JM, Skjorten I, Grotta OJ, et al. Right ventricular dysfunction and remodeling in chronic obstructive pulmonary disease without pulmonary hypertension. J Am Coll Cardiol. 2013;62(12):1103–1111.
2. Zhang WZ, Gomi K, Mahjour SB, Martinez FJ, Shaykhiev R. Update in Chronic Obstructive Pulmonary Disease 2017. Am J Respir Crit Care Med. 2018;197(12):1534–1539.
3. Singh D, Agusti A, Anzueto A, et al. Global strategy for the diagnosis, management, and prevention of chronic obstructive lung disease: the GOLD science committee report 2019. Eur Respir J. 2019.
4. Dutta T, Aronow WS. Echocardiographic evaluation of the right ventricle: clinical implications. Clin Cardiol. 2017;40(8):542–548.
5. Ho SY, Nihoyannopoulos P. Anatomy, echocardiography, and normal right ventricular dimensions. Heart. 2006;92(Suppl 1):i2–13.
6. Haddad F, Hunt SA, Rosenthal DN, Murphy DJ. Right ventricular function in cardiovascular disease, part I: anatomy, physiology, aging, and functional assessment of the right ventricle. Circulation. 2008;117(11):1436–1448.
7. Selton-Suty C, Juilliere Y. Non-invasive investigations of the right heart: how and why?. Arch Cardiovasc Dis. 2009;102(3):219–232.
8. Foschi M, Di Mauro M, Tancredi F, et al. The dark side of the moon: the right ventricle. J Cardiovasc Develo Dis. 2017;4:4.
9. Smolarek D, Gruchala M, Sobiczewski W. Echocardiographic evaluation of right ventricular systolic function: the traditional and innovative approach. Cardiol J. 2017;24(5):563–572.
10. Surkova E, Peluso D, Kasprzak JD, Badano LP. Use of novel echocardiographic techniques to assess right ventricular geometry and function. Kardiol Pol. 2016;74(6):507–522.
11. Fabiani I, Pugliese N, Santini V, Conte L, Di Bello V. Speckle-tracking imaging, principles and clinical applications: a review for clinical cardiologists. 2016.
12. Vogelmeier CF, Criner GJ, Martinez FJ, et al. Global strategy for the diagnosis, management and prevention of chronic obstructive lung disease 2017 report: GOLD executive summary. Respirology. 2017;22(3):575–601.
13. Global Initiative for Chronic Obstructive Lung Disease (GOLD). Global Strategy for the Diagnosis, Management, and Prevention of Chronic Obstructive Pulmonary Disease. GOLD; 2020. Available from: www.goldcopd.org.
14. Ozben B, Eryuksel E, Tanrikulu AM, et al. Acute exacerbation impairs right ventricular function in COPD patients. Hellenic Journal of Cardiology: HJC = Hellenike Kardiologike Epitheorese. 2015;56(4):324–331.
15. Holland A. The BODE index. J Physiother. 2010;56(1):62.
16. SBPT. Diretrizes para testes de função pulmonar. J Pneumol. 2002;28(Suppl 3):S1–S238.
17. ATS statement: guidelines for the six-minute walk test. American journal of respiratory and critical care medicine. Jul. 2002;166(1):111–117.
18. Kovelis D, Segretti NO, Probst VS, Lareau SC, Brunetto AF, Pitta F. Validação do Modified Pulmonary Functional Status and Dyspnea Questionnaire e da escala do Medical Research Council para o uso em pacientes com doença pulmonar obstrutiva crônica no Brasil. Jornal Brasileiro De Pneumologia. 2008;34:1008–1018.
19. Lang RM, Badano LP, Mor-Avi V, et al. Recommendations for cardiac chamber quantification by echocardiography in adults: an update from the American Society of Echocardiography and the European Association of Cardiovascular Imaging. J Am Soc Echocardiography. 2015;28(1):1–39e14.
20. Rudski LG, Lai WW, Afilalo J, et al. Guidelines for the echocardiographic assessment of the right heart in adults: a report from the American Society of Echocardiography endorsed by the European Association of Echocardiography, a registered branch of the European Society of Cardiology, and the Canadian Society of Echocardiography. J Am Soc Echocardiography. 2010;23(7):
21. Venkatachalam S, Wu G, Ahmad M. Echocardiographic assessment of the right ventricle in the current era: application in clinical practice. Echocardiography. 2017;34(12):1930–1947.
22. Celli BR, Cote CG, Marin JM, et al. The body-mass index, airflow obstruction, dyspnea, and exercise capacity index in chronic obstructive pulmonary disease. N Engl J Med. 2004;350(10):1005–1012.
23. Gokdeniz T, Kalaycioglu E, Boyaci F, et al. The BODE index, a multidimensional grading system, reflects impairment of right ventricle functions in patients with chronic obstructive pulmonary disease: a speckle-tracking study. Respiration. 2014;88(3):223–233.
24. Karoli NA, Rebrov AP. [The BODE index as a predictor of unfavourable prognosis in chronic obstructive pulmonary disease (by the results of a prospective study)]. Ter Arkh. 2007;79(3):11–14. Russian.
25. Faganello MM, Tanni SE, Sanchez FF, Pelegrino NR, Lucheta PA, Godoy I. BODE index and GOLD staging as predictors of 1-year exacerbation risk in chronic obstructive pulmonary disease. Am J Med Sci. 2010;339(1):10–14.
26. Fisher MR, Criner GJ, Fishman AP, et al. Estimating pulmonary artery pressures by echocardiography in patients with emphysema. Eur Respir J. 2007;30(5):914–921.
27. Sánchez-Lezama F, Harrison-Gómez C, Arceo-Navarro A, Arredondo-Arzola VM, Armenta-Flores R, Domínguez-Carrillo LG. Mean pulmonary pressure estimation by echocardiography: three equations comparison. Revista mexicana de cardiología. 2015;26:108–112.
28. Strain ASF. 2D como índice promissor para a avaliação da função sistólica do ventrículo direito. Rev Bras Ecocardiogr Imagem Cardiovasc. 2010;23(1):18–25.
29. da Costa Junior AA, Ota-Arakaki JS, Ramos RP, et al. Diagnostic and prognostic value of right ventricular strain in patients with pulmonary arterial hypertension and relatively preserved functional capacity studied with echocardiography and magnetic resonance. Int J Cardiovasc Imaging. 2017;33(1):39–46.
30. Park JH, Choi JO, Park SW, et al. Normal references of right ventricular strain values by two-dimensional strain echocardiography according to the age and gender. Int J Cardiovasc Imaging. 2018;34(2):177–183.
31. Iacoviello M, Citarelli G, Antoncecchi V, et al. Right ventricular longitudinal strain measures independently predict chronic heart failure mortality. Echocardiography. 2016;33(7):992–1000.
32. Focardi M, Cameli M, Carbone SF, et al. Traditional and innovative echocardiographic parameters for the analysis of right ventricular performance in comparison with cardiac magnetic resonance. Eur Heart J Cardiovasc Imaging. 2015;16(1):47–52.
33. Farsalinos KE, Daraban AM, Unlu S, Thomas JD, Badano LP, Voigt JU. Head-to-head comparison of global longitudinal strain measurements among nine different vendors: the EACVI/ASE inter-vendor comparison study. J Am Soc Echocardiography. 2015;28(10):1171–1181,e1172.
34. Muraru D, Onciul S, Peluso D, et al. Sex- and method-specific reference values for right ventricular strain by 2-dimensional speckle-tracking echocardiography. Circ Cardiovasc Imaging. 2016;9(2):e003866.
35. Lang RM. Recommendations for cardiac chamber quantification by echocardiography in adults: an update from the American Society of Echocardiography and the European Association of, Cardiovascular Imaging. Eur Heart J Cardiovasc Imaging. 2016;17(4):412.
36. Silva CES ea. Doppler Tecidual, Tissue Tracking, Strain Rate e Strain. Para que serve isso tudo? Revista Brasileira De Ecocardiografia. 2002;(2):17–27.
37. Chan J, Shiino K, Obonyo NG, et al. Left ventricular global strain analysis by two-dimensional speckle-tracking echocardiography: the learning curve. J Am Soc Echocardiography. 30;11:1081–1090.
38. Guendouz S, Rappeneau S, Nahum J, et al. Prognostic significance and normal values of 2D strain to assess right ventricular systolic function in chronic heart failure. Circulation j. 2012;76(1):127–136.
39. Rimbaş RC, Mihăilă S, Enescu OA, Vinereanu D. A new comprehensive 12-segment approach to right ventricular systolic and diastolic functions by 2D speckle tracking echocardiography in healthy individuals. Echocardiography. 2016;33(12):1866–1873.
40. Longobardo L, Suma V, Jain R, et al. Role of two-dimensional speckle-tracking echocardiography strain in the assessment of right ventricular systolic function and comparison with conventional parameters. J Am Soc Echocardiography. 2017;30(10):937–946e936.
 © 2021 The Author(s). This work is published and licensed by Dove Medical Press Limited. The
full terms of this license are available at https://www.dovepress.com/terms
and incorporate the Creative Commons Attribution
- Non Commercial (unported, 3.0) License.
By accessing the work you hereby accept the Terms. Non-commercial uses of the work are permitted
without any further permission from Dove Medical Press Limited, provided the work is properly
attributed. For permission for commercial use of this work, please see paragraphs 4.2 and 5 of our Terms.
© 2021 The Author(s). This work is published and licensed by Dove Medical Press Limited. The
full terms of this license are available at https://www.dovepress.com/terms
and incorporate the Creative Commons Attribution
- Non Commercial (unported, 3.0) License.
By accessing the work you hereby accept the Terms. Non-commercial uses of the work are permitted
without any further permission from Dove Medical Press Limited, provided the work is properly
attributed. For permission for commercial use of this work, please see paragraphs 4.2 and 5 of our Terms.