
Back to Journals » International Journal of General Medicine » Volume 18
Correlation Analysis of Imaging and Pathological Features of Ependymomas
Received 2 April 2025
Accepted for publication 2 July 2025
Published 21 July 2025 Volume 2025:18 Pages 4001—4009
DOI https://doi.org/10.2147/IJGM.S528992
Checked for plagiarism Yes
Review by Single anonymous peer review
Peer reviewer comments 2
Editor who approved publication: Dr Ching-Hsien Chen
Dengbin Sun, Fei Chen, Zhaoping Wang
Department of Neurosurgery, Jining First People’s Hospital, Jining, Shandong, 272508, People’s Republic of China
Correspondence: Zhaoping Wang, Department of Neurosurgery, Jining First People’s Hospital, No. 269, Mengzi Avenue, High-tech Zone, Jining, Shandong, 272508, People’s Republic of China, Tel +86 13685475152, Email [email protected]
Objective: To summarise and analyse the imaging manifestations and pathological features of patients with ependymoma, and to explore the potential correlation between them.
Methods: The study included 32 patients with ependymoma diagnosed between January 2020 and December 2024, all of whom underwent computed tomography and magnetic resonance imaging examinations. Imaging analysis included lesion diameter, location, morphology, surrounding oedema and enhancement manifestations; pathological analysis included histopathological examination and immunohistochemical detection, with detection indicators including glial fibrillary acidic protein (GFAP), S-100 protein, EMA, Ki-67 and other markers. Statistical analysis was performed using the chi-square test, with p < 0.05 considered statistically significant.
Results: Among the 32 patients, the average age was 40.7 ± 18.4 years, with adults accounting for 90.6% and children 9.4%. Tumours were distributed in multiple locations, most commonly in the spinal canal (31.3%) and the fourth ventricle (18.8%). Imaging features showed that tumours mostly presented low signal on T1WI (87.5%), with high and low signals each accounting for about 45% on T2WI, and all cases showed heterogeneous enhancement on enhanced T1WI. Nineteen cases (59.4%) had restricted diffusion, 19 cases (59.4%) had cystic components and 25 cases (78.1%) had necrosis. Pathological results showed that most tumours were World Health Organization grade II (46.9%), with 12 cases (80.0%) having ZFTA fusion (L1CAM overexpression). Immunohistochemical detection showed a positivity rate of 75.0% for GFAP and 62.5% for Ki-67. Statistical analysis showed that ZFTA fusion tumours were more likely to be located in the fourth ventricle (p = 0.02) and were significantly associated with cystic components, stellate signs and necrosis (p < 0.05). In cases with a Ki-67 index > 10%, 89.5% showed significant enhancement (p < 0.05).
Conclusion: This study confirmed a significant correlation between imaging and pathological features of ependymoma. Imaging examinations can provide important clues for diagnosis but pathological examinations are needed to improve accuracy.
Keywords: ependymoma, correlation, magnetic resonance imaging, MRI, computed tomography, CT, pathology
Introduction
Ependymoma is a central nervous system tumour that originates from the progenitor cells of the ependymal lining of the ventricular system and the central canal of the spinal cord.1–3 It accounts for 3–5% of all adult intracranial gliomas4 and has an annual incidence rate of 0.29 to 0.6 cases per 100,000 people.5 Among all primary central nervous system tumours, ependymomas account for 1.6% to 1.8%, with a higher prevalence in paediatric patients at about 5.2% and an incidence of around 4% in adult patients. Additionally, the incidence rate in men is slightly higher than that in women, with a ratio of approximately 1.3:1.6
The location of the tumour is closely related to the patient’s age: about 90% of paediatric ependymomas occur intracranially, whereas 65% of adult tumours occur in the spinal cord.7 The 2021 World Health Organization (WHO) classification of central nervous system tumours provides a more detailed subdivision of ependymomas, including supratentorial ependymomas, infratentorial ependymomas and spinal ependymomas, each with distinct molecular characteristics and prognostic significance.8
In recent years, with the rapid development of imaging technology – particularly the widespread application of magnetic resonance imaging (MRI) and computed tomography (CT) – the imaging features of ependymomas have been more thoroughly studied.9–11 MRI is the preferred method for diagnosing ependymomas, as it can provide information on the size, location, morphology and boundaries of the tumour, as well as reveal internal structural features such as cystic changes, haemorrhage, necrosis and enhancement patterns.12,13 CT offers an advantage in identifying calcifications, which are especially common in subependymomas.11,14
The correlation between imaging and pathological features has gradually attracted attention. However, this association is not entirely consistent. Therefore, in-depth exploration of the correlation between imaging and pathological features is of great importance for improving diagnostic accuracy, optimising treatment strategies and enhancing patient prognosis.
This study aims to summarise the imaging features of ependymoma cases through retrospective analysis and to explore the correlation between these features and pathological findings, thereby providing a more comprehensive reference for clinical diagnosis and treatment.
Materials and Methods
Participants
This retrospective study reviewed MRI and CT images, clinical details and pathological reports of 32 patients with ependymoma who attended between January 2020 and December 2024. All patients were informed and provided written consent.
The inclusion criteria are as follows: (1) confirmed diagnosis of ependymoma; (2) completed CT and MRI examinations and (3) no congenital malformations.The exclusion criteria were as follows: (1) presence of cardiac pacemakers or defibrillators; (2) incomplete clinical data and (3) history of contrast agent allergy.
Imaging Analysis
A Siemens dual-source CT scanner (SOMATOM Definition Flash) was used, with scan parameters as follows: tube voltage 120 kV, automatic tube current, pitch 1.0, slice thickness 1.0 mm and matrix 512×512. Patients were positioned supine, and the scan range extended from the second cervical vertebra to the top of the head.
MRI scan parameters were as follows: T1-weighted imaging (T1WI) employed a conventional spin-echo (SE) sequence, and T2-weighted imaging (T2WI) used a fast SE sequence. Spin-echo T1WI parameters were: repetition time (TR) 2000 ms, echo time (TE) 9.2 ms, field of view (FOV) 23 cm, slice thickness 5.0 mm and interslice spacing 1.5 mm. T2WI parameters were TR/TE 3220 ms/99 ms, FOV 23 cm, slice thickness 5.0 mm and interslice spacing 1.5 mm. The contrast agent used for enhanced scanning was gadopentetate dimeglumine, administered at a dose of 0.1 mmol/kg.
Computed tomography and MRI results were reviewed independently by two or more experienced radiologists in a double-blind manner, without knowledge of the pathological results, to reach consensus. Observations focused on lesion diameter, location, morphology, surrounding oedema and enhancement patterns.
Pathological Analysis
Pathological analysis included histopathological examination and immunohistochemical detection. Histopathology involved assessing cellular morphology, structural features and tumour grading under light microscopy, based on the WHO classification of central nervous system tumours.15
Immunohistochemical analysis was performed to assess the expression of specific proteins in tumour cells. Detection indicators included, but were not limited to: glial fibrillary acidic protein (GFAP), S-100 protein, epithelial membrane antigen (EMA), vimentin, Ki-67 (cell proliferation marker), p53, IDH1, OLig-2, ATRX, H3K27M and H3K27me3. The expression of these markers helped clarify the subtype, biological behaviour and potential molecular characteristics of the tumour.
The steps for immunohistochemical detection were as follows:
- Section preparation and pretreatment: Paraffin-embedded tissue sections were dewaxed, rinsed with running water and subjected to antigen retrieval based on primary antibody requirements.
- Endogenous peroxidase blocking: If required, sections were treated with an endogenous peroxidase blocker, incubated at room temperature for 10 minutes, then rinsed three times with phosphate-buffered saline (PBS; 3 minutes each).
- Primary antibody incubation: Sections were incubated with the primary antibody at room temperature for 60 minutes, followed by three PBS rinses (3 minutes each).
- Secondary antibody incubation: Sections were incubated with the secondary antibody at room temperature for 15 minutes, followed by three PBS rinses (3 minutes each).
- Staining and counterstaining: Sections were stained using freshly prepared DAB reagent, rinsed with running water to terminate staining, then counterstained with haematoxylin.
- Dehydration and clearing: Sections were dehydrated through a graded ethanol series, cleared with xylene and mounted.
Pathologists recorded the expression of each marker under microscopy, including the proportion of positive cells and staining intensity.
Statistical Analysis
Data were analysed using IBM SPSS Statistics for Windows, version 26.0 (IBM Corp., Armonk, N.Y., USA). Descriptive statistics were used to analyse patient age, sex, tumour distribution, imaging features (eg tumour volume, signal intensity, enhancement patterns) and pathological features (including WHO grading and immunohistochemical marker expression). Continuous variables were expressed as mean ± standard deviation (mean ± SD), and categorical variables were expressed as frequency (n) and percentage (%). The chi-square test was used to assess the relationship between imaging and pathological features, with p < 0.05 considered statistically significant.
Results
Demographic Features
This study included 32 patients with pathologically confirmed ependymoma, with a mean age of 40.7 ± 18.4 years (range: 2–82 years). The sex distribution was balanced, with 15 men (47%) and 17 women (53%). In terms of age stratification, adults (≥18 years) accounted for 90.6% (n = 29) and children (≤18 years) for 9.4% (n = 3), including 2 children under the age of 5 (Table 1). The age, gender, localization of the tumor, surgical technique, extent of resection, imaging and pathohistological characteristics have been presented in the Supplementary Table 1. The complications were as follows: posterior cranial nerve palsy (n = 15), limb dyskinesia (n = 13), rebleeding from the surgical area (n = 9), ventricular hematocele (n = 8), postoperative central hyperthermia (n = 8), seizures (n = 5), intracranial infection (n = 4), and cerebrospinal fluid leakage epidural hematoma (n = 1).
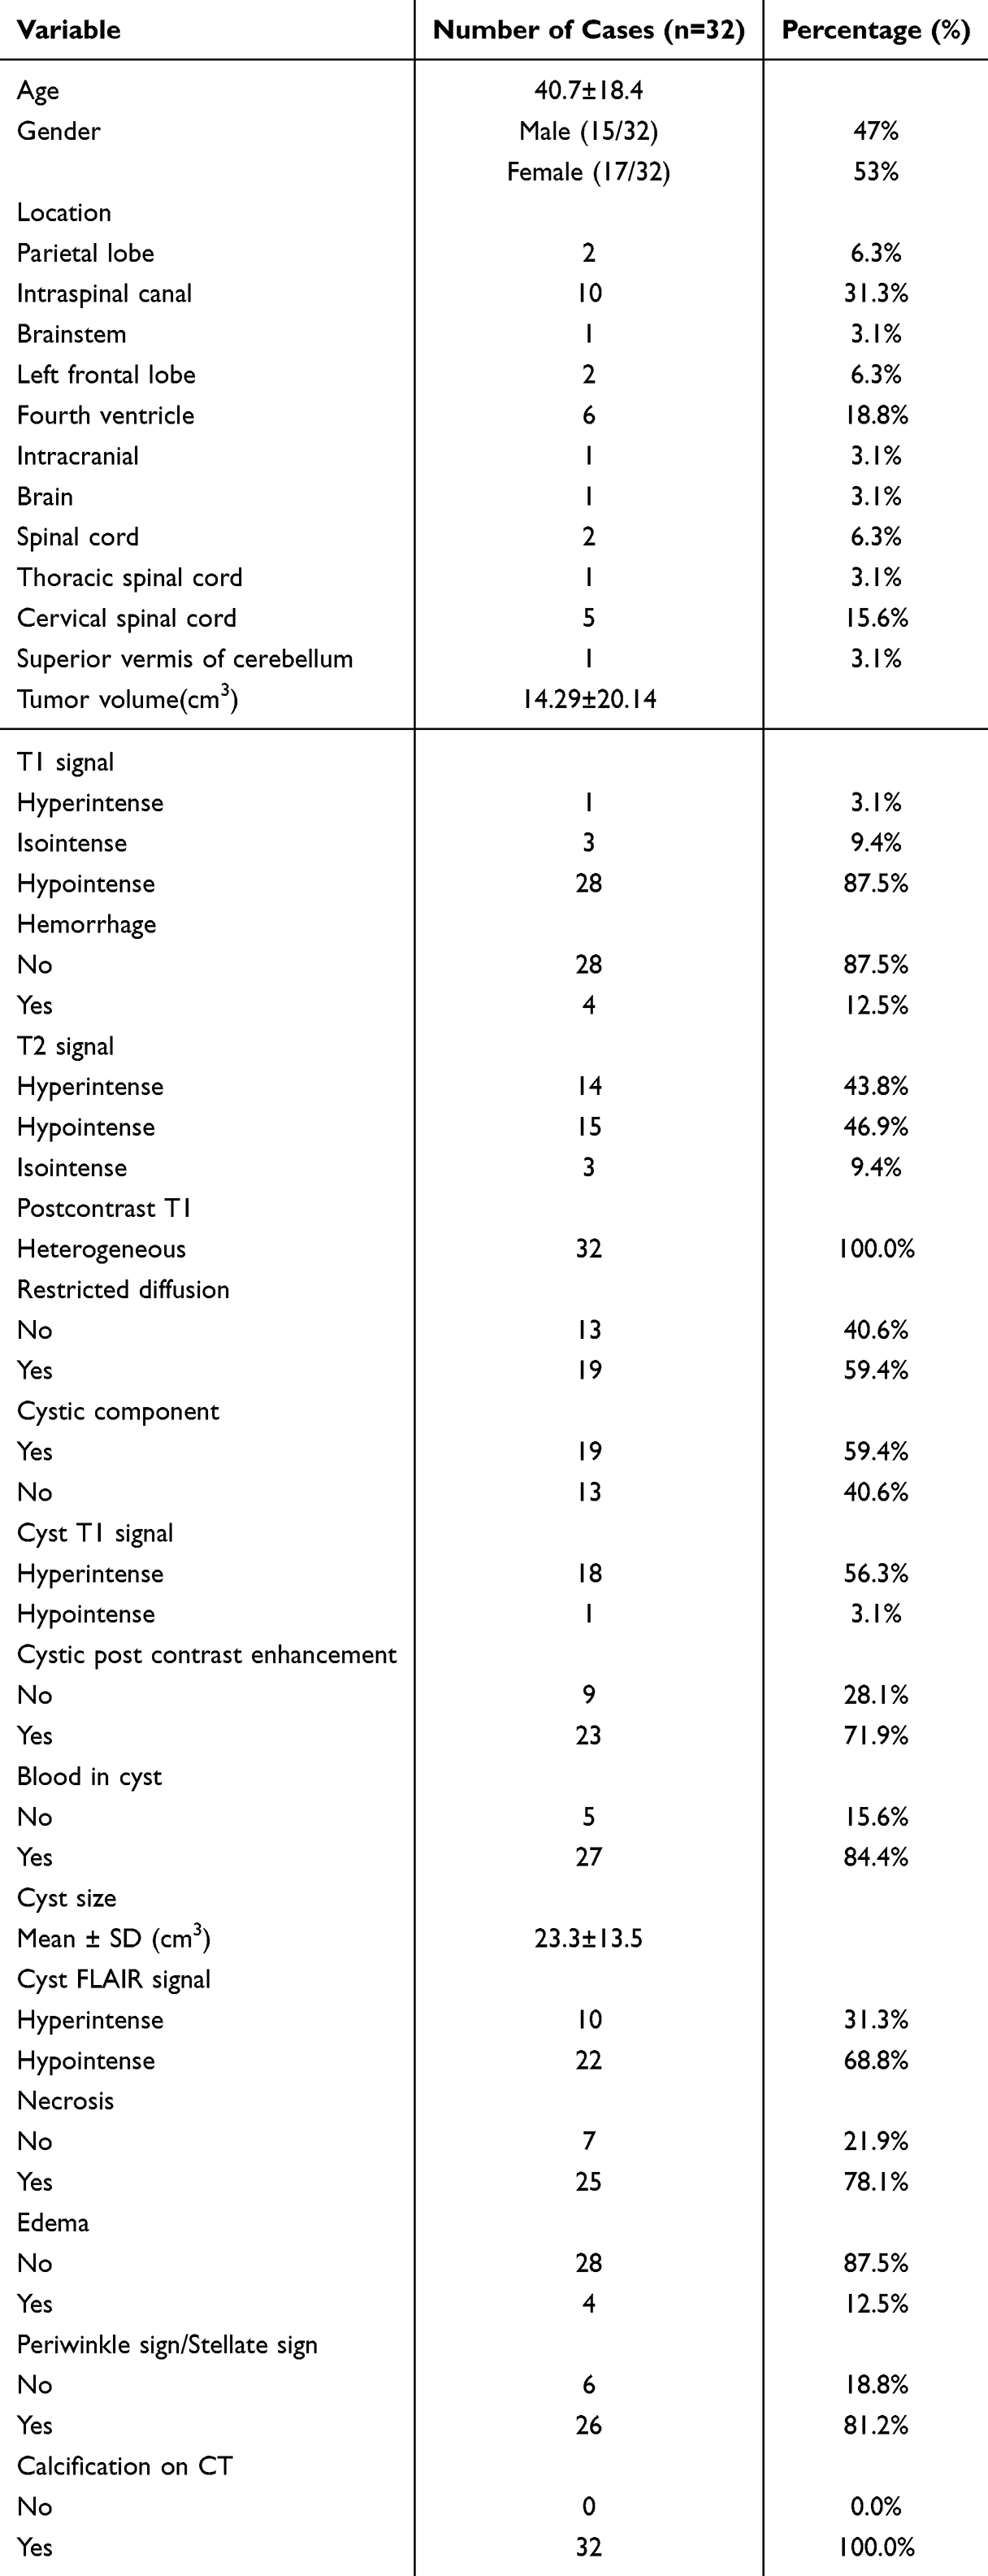 |
Table 1 Demographic and Imaging Features |
Imaging Features
Tumours were located in multiple regions, most commonly in the spinal canal (10 cases, 31.3%), the fourth ventricle (6 cases, 18.8%) and the cervical spinal cord (5 cases, 15.6%). Other locations included the parietal lobe (2 cases, 6.3%), left frontal lobe (2 cases, 6.3%), spinal cord (2 cases, 6.3%), superior vermis of the cerebellum (1 case, 3.1%), brainstem (1 case, 3.1%), intracranial cavity (1 case, 3.1%), brain (1 case, 3.1%) and thoracic spinal cord (1 case, 3.1%).
The average tumour volume was 14.29 ± 20.14 cm³. On T1WI, the majority of tumours (28 cases, 87.5%) presented with low signal intensity, 1 case (3.1%) with high signal intensity and 3 cases (9.4%) with isosignal intensity. Four cases (12.5%) showed evidence of bleeding. On T2WI, 14 cases (43.8%) had high signal intensity, 15 cases (46.9%) low signal intensity and 3 cases (9.4%) isosignal intensity. All cases (100%) showed heterogeneous enhancement on enhanced T1WI.
Restricted diffusion was observed in 19 cases (59.4%), and absent in 13 cases (40.6%). Cystic components were present in 19 cases (59.4%), with an average cyst volume of 23.3 ± 13.5 cm³. On T1-weighted images of cysts, 18 cases (56.3%) showed high signal intensity and 1 case (3.1%) low signal intensity. Cyst enhancement was observed in 23 cases (71.9%), and 27 cases (84.4%) had cystic bleeding.
On FLAIR sequences of cysts, 10 cases (31.3%) showed high signal intensity and 22 cases (68.8%) low signal intensity. Necrosis was present in 25 cases (78.1%), and oedema in 4 cases (12.5%). The violet sign or stellate sign was observed in 26 cases (81.3%). Calcification was observed in 1 case (3.1%) on CT (Table 1).
Pathological and Molecular Features
The majority of tumours were classified as WHO grade II (15 cases, 46.9%), with 3 cases (9.4%) classified as WHO grade III. Seventeen cases (89.5%) were positive for Cyclin D1, and the average MIB labelling index was 13.8 ± 10.9. Twelve cases (80.0%) had ZFTA fusion (L1CAM overexpression).
Immunohistochemical staining showed the following positivity rates: Glial fibrillary acidic protein (24 cases, 75.0%), S-100 (21 cases, 65.6%), Ki-67 (20 cases, 62.5%), vimentin (17 cases, 53.1%), EMA (9 cases, 28.1%), synaptophysin (7 cases, 21.9%), SOX-10 (7 cases, 21.9%), OLig-2 (7 cases, 21.9%), p53 (6 cases, 18.8%) and ATRX (6 cases, 18.8%). Other markers – such as CD34, CD56, D2-40, IDH1, NSE, H3K27me3, NeuN, CK, SSTR2, H3K27M, desmin, PR, SMA, STAT6, mammaglobin, CK20, PAX-8, Tg, MGMT, GATA3, MyoD1, LCK and TTF-1 – were either negative or positive in a minority of cases (Table 2).
 |
Table 2 Pathological and Molecular Features |
Correlation Between Pathological Indicators and Imaging Features
There was a notable relationship between molecular subtypes and imaging features: ZFTA fusion tumours were more likely to be located in the fourth ventricle (p = 0.02) and were significantly associated with cystic components (71.9%), stellate signs (81.3%) and necrosis (78.1%).
A clear association was also observed between proliferative activity and imaging manifestations: in cases with a Ki-67 index > 10%, 89.5% (n = 17/19) showed significant enhancement (p < 0.05).
Additional associations were identified with other immunohistochemical markers: cases positive for GFAP, S-100 and vimentin were distributed across various anatomical locations and were associated with cystic enhancement and necrosis (p < 0.05). Epithelial membrane antigen expression (28.1%) was more common in spinal cord tumours and was associated with restricted diffusion (p = 0.03) (Table 3).
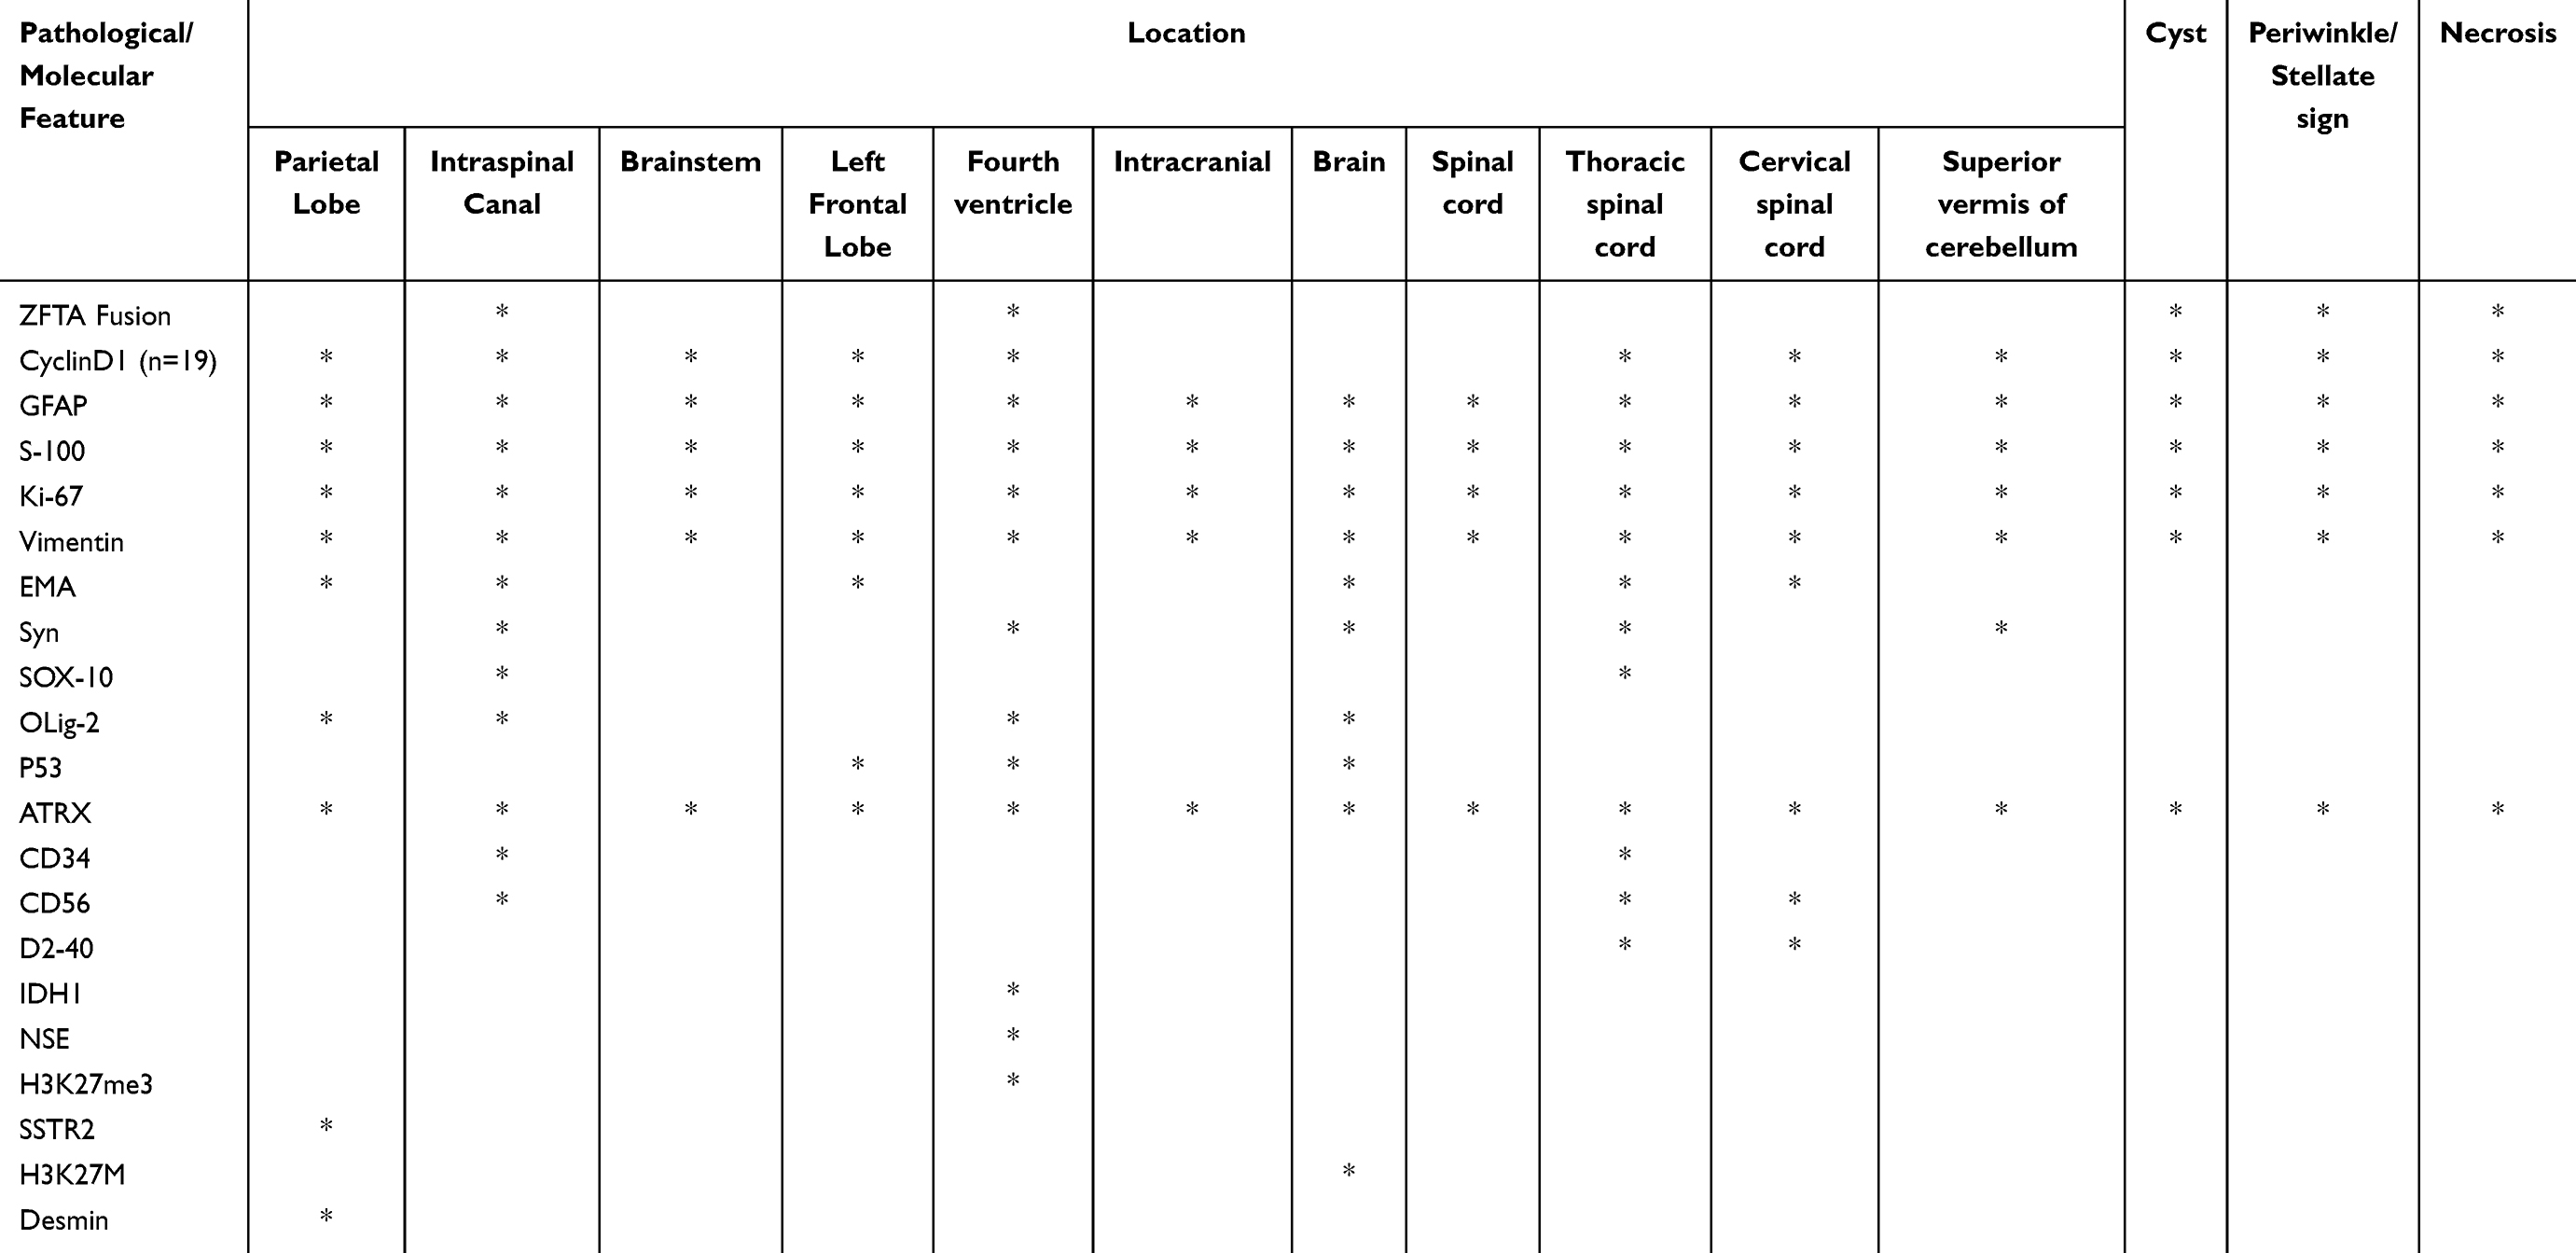 |
Table 3 The Correlation Between Pathological Indicators and Imaging Characteristics |
Discussion
Ependymomas, as central nervous system tumours, have long been a substantial subject in the fields of neurosurgery and neuroimaging. This study retrospectively analysed the imaging and pathological features of 32 patients with ependymoma, revealing correlations between the two and providing valuable references for clinical practice.
Imaging examinations play an irreplaceable role in tumour diagnosis.16,17 First, they confirm the presence and location of the tumour, clearly demonstrating its relationship with surrounding structures within the ventricle or spinal cord. Second, imaging can evaluate the extent and stage of the tumour, accurately measure its size, and assess whether there is invasion of adjacent neural or vascular structures, or the presence of distant metastases. This information provides a crucial foundation for formulating an appropriate treatment plan. Ependymomas have certain characteristic imaging features.18 For example, on MRI, T1-weighted images typically show isosignal to low signal intensity, T2-weighted images often show high signal intensity and there may be varying degrees of contrast enhancement. On CT, tumours may appear as soft tissue components with iso- or low density, often exhibiting calcification or cystic changes. In this study, all cases showed heterogeneous enhancement on enhanced T1WI, likely reflecting the rich blood supply and complex vascular structure of ependymomas. Furthermore, CT has an advantage in identifying calcification. Although only one case showed calcification in this cohort, this finding supports the value of CT in selected cases.
The correlation between imaging and pathological features was a key focus of this study. ZFTA fusion tumours were more likely to be located in the fourth ventricle and were significantly associated with cystic components, stellate signs and necrosis (p = 0.02). This finding aligns with previous research, suggesting that molecular subtypes may have predictive value in imaging presentation.8 Additionally, the Ki-67 index, a marker of tumour proliferative activity, showed notable associations with imaging features. Preusser et al reported that the Ki-67 index is an independent prognostic factor in patients with ependymoma.19 The Ki-67 (MIB-1) labelling index correlates with tumour grade: grade I ependymomas typically show an index of 0%–2%, grade II approximately 1%–4% and grade III often exceeds 10%. Similar to Ki-67, p53 expression is also associated with tumour grade and is considered a poor prognostic indicator, making it useful in staging. In the present study, among cases with a Ki-67 index > 10%, 89.5% demonstrated significant enhancement (p < 0.05), indicating that tumours with higher proliferative activity may exhibit more pronounced enhancement on imaging.
The role of immunohistochemistry in the diagnosis of ependymoma may be limited, as the expression of immunohistochemical markers across different ependymoma variants is heterogeneous. For example, Vege et al studied the expression of several glial and epithelial markers in 52 cases of ependymoma.20 They found that nearly all tumours exhibited an immune reaction to GFAP, S-100 and keratin AE1/AE3. Glial fibrillary acidic protein is prominent in ependymomas with perivascular pseudorosettes, whereas S-100 shows diffuse staining in ependymomas with epithelial features. Notably, GFAP expression is negatively correlated with malignancy, with higher levels seen in low-grade ependymomas. Epithelial membrane antigen is another marker, positive in approximately 70% of ependymomas with epithelial characteristics. Epithelial membrane antigen expression is typically more pronounced in grade II and III ependymomas. Additionally, vimentin is a commonly expressed marker in ependymomas, although expression levels of different cytokeratins vary considerably (5%–40%).
In this study, the positivity rates for GFAP, S-100 and vimentin were relatively high, at 75.0%, 65.6% and 53.1%, respectively. The expression of these markers was associated with the anatomical location of the tumour and certain imaging features. For instance, GFAP- and S-100-positive cases were widely distributed across different anatomical sites and were associated with cystic enhancement and necrosis (p < 0.05). Epithelial membrane antigen expression, which was more frequently observed in spinal cord tumours, was associated with restricted diffusion (p = 0.03), providing a potentially useful marker for the diagnosis of spinal cord ependymomas.
Nonetheless, this study has several limitations. First, the sample size was relatively small, which may affect the statistical power of the findings. Future studies should aim to validate these results in larger cohorts. Second, this study focused primarily on the expression of selected immunohistochemical markers, whereas the molecular characteristics of ependymomas are likely to be more complex. Further research should incorporate additional molecular markers and genetic testing to provide a more comprehensive understanding of the biological behaviour of these tumours.
Moreover, with ongoing advancements in imaging technology, the application of newer modalities such as functional MRI and positron emission tomography may offer additional insights for the diagnosis and prognostic assessment of ependymomas. Future studies could explore the relationship between these advanced imaging techniques and pathological features to enhance diagnostic accuracy and treatment planning.
Finally, this study did not examine the prognostic implications of the identified correlations. Future research should integrate survival data to determine whether these associations influence patient outcomes. This would be essential for translating these findings into clinical practice and improving the management and prognosis of patients with ependymoma.
Conclusion
In summary, this study systematically analysed the correlation between imaging and pathological features of ependymomas, highlighting the crucial role of imaging examinations in diagnosis and the predictive value of molecular subtypes in imaging presentation. Although immunohistochemical detection shows heterogeneity, it remains indispensable for tumour diagnosis, grading and prognostic evaluation. Future studies should further investigate the associations between additional molecular markers and imaging features to provide a more comprehensive foundation for the precise diagnosis and treatment of ependymomas.
Data Sharing Statement
All data generated or analyzed during this study are included in the article.
Ethics Approval and Consent to Participate
This study was conducted in accordance with the Declaration of Helsinki and approved by the Ethics Committee of Jining First People’s Hospital. All patients were informed and provided written consent.
Funding
The authors have received no financial support for the research, authorship, or publication of this manuscript.
Disclosure
None of the authors have any personal, financial, commercial, or academic conflicts of interest in this work.
References
1. Ostrom QT, Price M, Ryan K, et al. CBTRUS statistical report: pediatric brain tumor foundation childhood and adolescent primary brain and other central nervous system tumors diagnosed in the United States in 2014-2018. Neuro Oncol. 24(Suppl 3):iii1–iii38. doi:10.1093/neuonc/noac161
2. Marks JE, Adler SJ. A comparative study of ependymomas by site of origin. Int J Radiat Oncol Biol Phys. 1982;8(1):37–43. doi:10.1016/0360-3016(82)90382-0
3. Santi M, Viaene AN, Hawkins C. Ependymal Tumors. Pediatr Dev Pathol. 2022;25(1):59–67. doi:10.1177/10935266211018928
4. Amirian ES, Armstrong TS, Gilbert MR, Scheurer ME. Predictors of survival among older adults with ependymoma. J Neurooncol. 2012;107(1):183–189. doi:10.1007/s11060-011-0730-2
5. Ostrom QT, Patil N, Cioffi G, Waite K, Kruchko C, Barnholtz-Sloan JS. CBTRUS statistical report: primary brain and other central nervous system tumors diagnosed in the United States in 2013-2017. Neuro Oncol. 2020;22(12 Suppl 2):iv1–iv96. doi:10.1093/neuonc/noaa200
6. Bertero L, Ricci AA, Tampieri C, Cassoni P, Modena PE. Pathologica. 2022;114(6):436–446. doi:10.32074/1591-951X-817
7. McGuire CS, Sainani KL, Fisher PG. Incidence patterns for ependymoma: a surveillance, epidemiology, and end results study. J Neurosurg. 2009;110(4):725–729. doi:10.3171/2008.9.JNS08117
8. Louis DN, Perry A, Wesseling P, et al. The 2021 WHO classification of tumors of the central nervous system: a summary. Neuro Oncol. 23(8):1231–1251. doi:10.1093/neuonc/noab106
9. Leclerc T, Levy R, Tauziède-Espariat A, et al. Imaging features to distinguish posterior fossa ependymoma subgroups. Eur Radiol. 2024;34(3):1534–1544. doi:10.1007/s00330-023-10182-5
10. Perrod V, Levy R, Tauziède-Espariat A, et al. Supra-tentorial Ependymomas with ZFTA fusion, YAP1 fusion, and astroblastomas, Mn1-altered: characteristic imaging features. Clin Neuroradiol. 2024;34(4):939–950. doi:10.1007/s00062-024-01444-w
11. Badary A, Kurdi SZ, Almealawy YF, et al. Intracranial ependymoma: a retrospective analysis of clinical features, treatment modalities, and long-term outcome. Aging Med. 2024;7(6):679–688. doi:10.1002/agm2.12378
12. Yuh EL, Barkovich AJ, Gupta N. Imaging of ependymomas: MRI and CT. Childs Nerv Syst. 2009;25(10):1203–1213. doi:10.1007/s00381-009-0878-7
13. Nowak J, Seidel C, Pietsch T, et al. Systematic comparison of MRI findings in pediatric ependymoblastoma with ependymoma and CNS primitive neuroectodermal tumor not otherwise specified. Neuro Oncol. 2015;17(8):1157–1165. doi:10.1093/neuonc/nov063
14. Soni N, Ora M, Bathla G, Desai A, Gupta V, Agarwal A. ependymal tumors: overview of the recent world health organization histopathologic and genetic updates with an imaging characteristic. AJNR Am J Neuroradiol. 2024;45(11):1624–1634. doi:10.3174/ajnr.A8237
15. Kresbach C, Neyazi S, Schüller U. Updates in the classification of ependymal neoplasms: the 2021 WHO Classification and beyond. Brain Pathol. 2022;32(4):e13068. doi:10.1111/bpa.13068
16. Behzad B, Dianat S. Magnetic resonance imaging of nerve tumors. Semin Musculoskelet Radiol. 2022;26(2):172–181. doi:10.1055/s-0042-1742704
17. Nicolau C, Antunes N, Paño B, Sebastia C. Imaging Characterization of Renal Masses. Medicina. 2021;57(1):51. doi:10.3390/medicina57010051
18. Sahu A, Venkatesh A, Snehil A, et al. Imaging of supratentorial ependymomas with radio-pathological correlation. Explor Target Antitumor Ther. 2024;5(3):766–779. doi:10.37349/etat.2024.00245
19. Preusser M, Heinzl H, Gelpi E, et al. Ki67 index in intracranial ependymoma: a promising histopathological candidate biomarker. Histopathology. 2008;53(1):39–47. doi:10.1111/j.1365-2559.2008.03065.x
20. Vege KD, Giannini C, Scheithauer BW. The immunophenotype of ependymomas. Appl Immunohistochem Mol Morphol. 2000;8(1):25–31. doi:10.1097/00129039-200003000-00004
 © 2025 The Author(s). This work is published and licensed by Dove Medical Press Limited. The
full terms of this license are available at https://www.dovepress.com/terms
and incorporate the Creative Commons Attribution
- Non Commercial (unported, 4.0) License.
By accessing the work you hereby accept the Terms. Non-commercial uses of the work are permitted
without any further permission from Dove Medical Press Limited, provided the work is properly
attributed. For permission for commercial use of this work, please see paragraphs 4.2 and 5 of our Terms.
© 2025 The Author(s). This work is published and licensed by Dove Medical Press Limited. The
full terms of this license are available at https://www.dovepress.com/terms
and incorporate the Creative Commons Attribution
- Non Commercial (unported, 4.0) License.
By accessing the work you hereby accept the Terms. Non-commercial uses of the work are permitted
without any further permission from Dove Medical Press Limited, provided the work is properly
attributed. For permission for commercial use of this work, please see paragraphs 4.2 and 5 of our Terms.