
Back to Journals » Diabetes, Metabolic Syndrome and Obesity » Volume 19
Correlation Analysis Between Obesity Index and Glycosylated Hemoglobin Level in Type 2 Diabetes Patients: A Cross-Sectional Study
Authors Gang P, Zhu J, Zhang B, Zhao Y, Zhao X, Luo B 
Received 23 October 2025
Accepted for publication 20 January 2026
Published 3 February 2026 Volume 2026:19 575126
DOI https://doi.org/10.2147/DMSO.S575126
Checked for plagiarism Yes
Review by Single anonymous peer review
Peer reviewer comments 2
Editor who approved publication: Dr Donald McClain
Pei Gang,1 Jianfeng Zhu,1 Bing Zhang,1 Yanxiao Zhao,1 Xiaowei Zhao,2 Beibei Luo3
1Department of Administration, Nanyang Second General Hospital, Nanyang, Henan Province, 473000, People’s Republic of China; 2Department of Pediatrics, Nanyang Second General Hospital, Nanyang, Henan Province, 473000, People’s Republic of China; 3Clinical Laboratory, People’s Hospital of Yuxi City, the Sixth Affiliated Hospital of Kunming Medical University, Yuxi City, Yunnan Province, 653100, People’s Republic of China
Correspondence: Beibei Luo, Clinical Laboratory, People’s Hospital of Yuxi City, the Sixth Affiliated Hospital of Kunming Medical University, Yuxi City, Yunnan Province, 653100, People’s Republic of China, Email [email protected]
Introduction: The global prevalence of type 2 diabetes mellitus (T2DM) is increasing rapidly. However, the relationship between obesity indexes and Glycosylated hemoglobin (HbA1c) levels remains unclear.
Methods: This cross-sectional study included 3,898 patients with T2DM who were treated in the Department of Endocrinology at Yuxi People’s Hospital between March 2018 and December 2024. Participants were grouped according to whether their HbA1c levels were below 7.0%. Linear regression analysis was performed to evaluate the associations between body mass index (BMI), visceral fat area (VFA), and waist circumference (WC) with glycosylated hemoglobin. In addition, a correlation matrix was generated.
Results: Participants with HbA1c ≥ 7.0% were slightly younger (52.9 ± 11.3 vs 53.9 ± 11.7 years, p = 0.017) and had higher BMI (25.4 ± 3.6 vs 25.1 ± 3.5 kg/m2, p = 0.037), WC (88.9 ± 9.5 vs 88.1 ± 8.8 cm, p = 0.021), and VFA (88.2 ± 39.4 vs 85.1 ± 36.6 cm2, p = 0.029) than those with HbA1c < 7.0%. However, no statistically significant associations were observed between HbA1c and BMI (β = – 0.0029, 95% CI: – 0.0243 to 0.0185, p = 0.79), WC (β = – 0.0037, 95% CI: – 0.012 to 0.0047, p = 0.38), or VFA (β = – 0.0012, 95% CI: – 0.0032 to 0.0008, p = 0.24).
Conclusion: There was no significant correlation between obesity indexes and HbA1c levels among patients with T2DM.
Keywords: BMI, HbA1c, T2DM
Introduction
The global prevalence of type 2 diabetes mellitus (T2DM) is increasing rapidly, posing a serious public health challenge. In recent years, along with China’s rapid economic development, the prevalence of diabetes has also risen markedly. Reports indicate that the prevalence of diabetes among mainland Chinese adults aged 18 years and older increased from 1% in 1980 to 12.4% in 2018.1 One of the primary clinical challenges in managing T2DM is achieving optimal glycemic control to prevent diabetes-related complications.
Glycosylated hemoglobin (HbA1c) is formed through the binding of glucose to hemoglobin in red blood cells, and its level is positively correlated with blood glucose concentration. It serves as a stable indicator of the average blood glucose level over the previous 2–3 months.2 According to the American Diabetes Association, an HbA1c level below 7% indicates good glycemic control.3 Body mass index (BMI), waist circumference (WC), and visceral fat area (VFA) are commonly used anthropometric indicators that are closely associated with insulin resistance and glycemic control.4,5 A study conducted in an American population demonstrated a positive correlation between BMI and HbA1c levels among participants without diabetes; however, this association was not significant in individuals with diabetes.6 In contrast to BMI, which reflects overall adiposity but not fat distribution, VFA provides a direct measure of abdominal obesity and has been shown to be closely associated with a range of metabolic and cardiovascular diseases.7,8
Although numerous studies have examined the relationship between obesity and T2DM, findings remain inconsistent due to differences in study populations and research designs. These inconsistencies hinder the accurate development of individualized glycemic management strategies based on obesity-related indicators in clinical practice.Therefore, based on a cohort of patients with T2DM, this study aims to clarify the relationship between obesity indexes and HbA1c levels. The findings are expected to provide an evidence-based foundation for integrating weight management into precision treatment strategies for diabetes.
Methods
Study Design and Participants
This cross-sectional study retrospectively collected baseline data from 6,240 patients treated in the Department of Endocrinology at Yuxi People’s Hospital between March 2018 and December 2024. After excluding individuals with incomplete data and those younger than 18 years, a total of 3,898 patients were included in the final analysis. Baseline information encompassed lifestyle factors, dietary habits, and a comprehensive set of laboratory tests. The study was approved by the Ethics Committee of the Sixth Affiliated Hospital of Kunming Medical University (No. 2023 KMYKDX6F089) and was conducted in accordance with the Declaration of Helsinki. As this study was a retrospective analysis without direct patient contact, only patients’ examination results were collected. The findings were used solely for analytical and exploratory purposes, without serving as a basis for clinical diagnosis or involving any commercial interests, so the Ethics Committee approved the waiver of informed consent.
Measurements and Definitions
Height and weight were measured using an automated ultrasonic height–weight scale (HNH-318, Omron, China) while participants wore lightweight clothing, stood barefoot with an erect posture, and maintained relaxed abdominal breathing. BMI was calculated as weight in kilograms divided by height in meters squared. WC was measured at the midpoint between the inferior costal margin and the iliac crest using a non-elastic tape during quiet expiration. VFA and subcutaneous fat area (SFA) were assessed using direct segmental multi-frequency bioelectrical impedance analysis (HDS-2000, Omron, China). HbA1c levels were determined via immunoturbidimetric assay on the Cobas c502 analyzer (Roche Diagnostics, Germany). All measurements were conducted by trained technicians following standardized operating procedures to ensure data reliability and consistency.
According to the Chinese guidelines, body mass index (BMI) is classified into four categories: underweight (BMI < 18.5), normal weight (BMI 18.5–<24.0), overweight (BMI 24.0–<28.0), and obesity (BMI ≥ 28.0).9 In accordance with the recommendations of the American Diabetes Association, most non-pregnant adults with diabetes should maintain an HbA1c level below 7%; therefore, patients were grouped based on this criterion.3
Statistical Analysis
In this study, participants were stratified according to BMI and HbA1c levels. Continuous variables with a normal distribution were expressed as the mean ± standard deviation (SD), whereas those with a skewed distribution were reported as the median and interquartile range (IQR). Categorical variables were presented as percentages. Comparisons of continuous variables were performed using Student’s t-test or the Mann–Whitney U-test, while categorical variables were compared using the chi-square test. Linear regression analysis was conducted to assess the relationship between BMI, VFA, WC, and HbA1c. Additionally, a correlation matrix was generated to visualize these associations. P < 0.05 was considered significant. All the analyses were performed with the statistical software packages R (http://www.R-project.org, The R Foundation) and Free Statistics software version 1.9.
Results
Baseline Characteristics
Participants grouped by HbA1c levels showed significant differences in several baseline characteristics. Individuals with HbA1c ≥ 7.0% were slightly younger (52.9 ± 11.3 vs 53.9 ± 11.7 years, p = 0.017) and had higher BMI (25.4 ± 3.6 vs 25.1 ± 3.5 kg/m2, p = 0.037), WC (88.9 ± 9.5 vs 88.1 ± 8.8 cm, p = 0.021), and VFA (88.2 ± 39.4 vs 85.1 ± 36.6 cm2, p = 0.029) compared with participants with HbA1c < 7.0%. No significant differences were observed in gender distribution or SFA between the groups (Table 1).
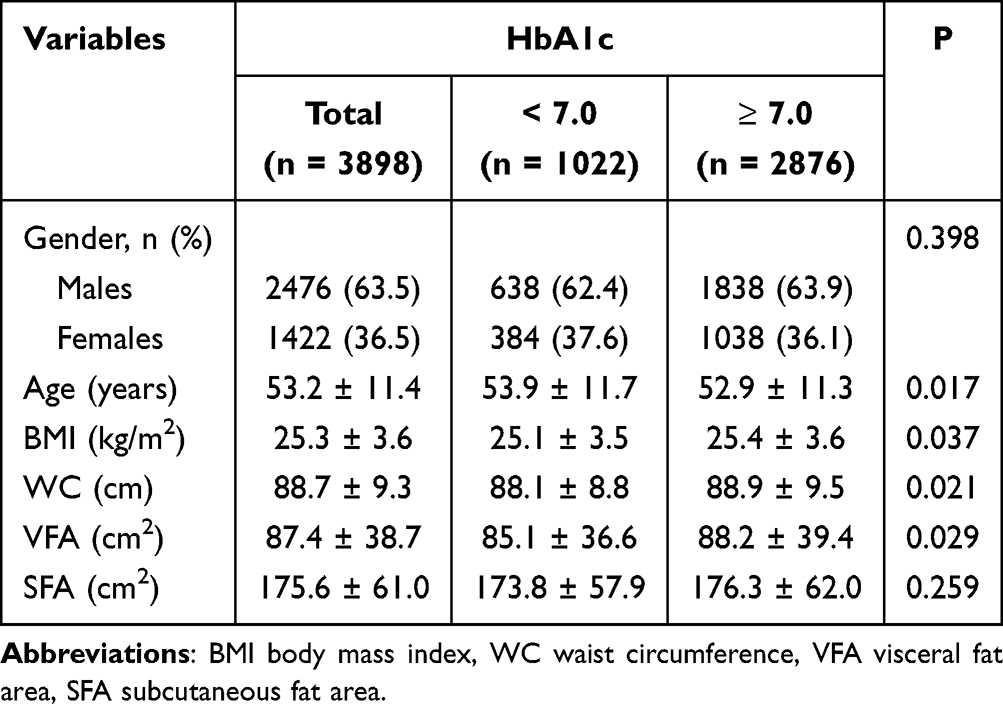 |
Table 1 Baseline Characteristics When Grouped by HbA1c |
When participants were categorized by BMI, significant differences were observed in baseline characteristics. Males were more prevalent in the overweight and obese categories (p < 0.001). Age decreased significantly across BMI groups, with the obese group being the youngest (50.0 ± 12.4 years) and the underweight group the oldest (54.6 ± 14.2 years, p < 0.001). WC, VFA, and SFA all increased progressively with higher BMI (p < 0.001 for all), indicating greater abdominal fat accumulation among heavier individuals. However, HbA1c levels did not differ significantly across BMI categories (p = 0.279) (Table 2).
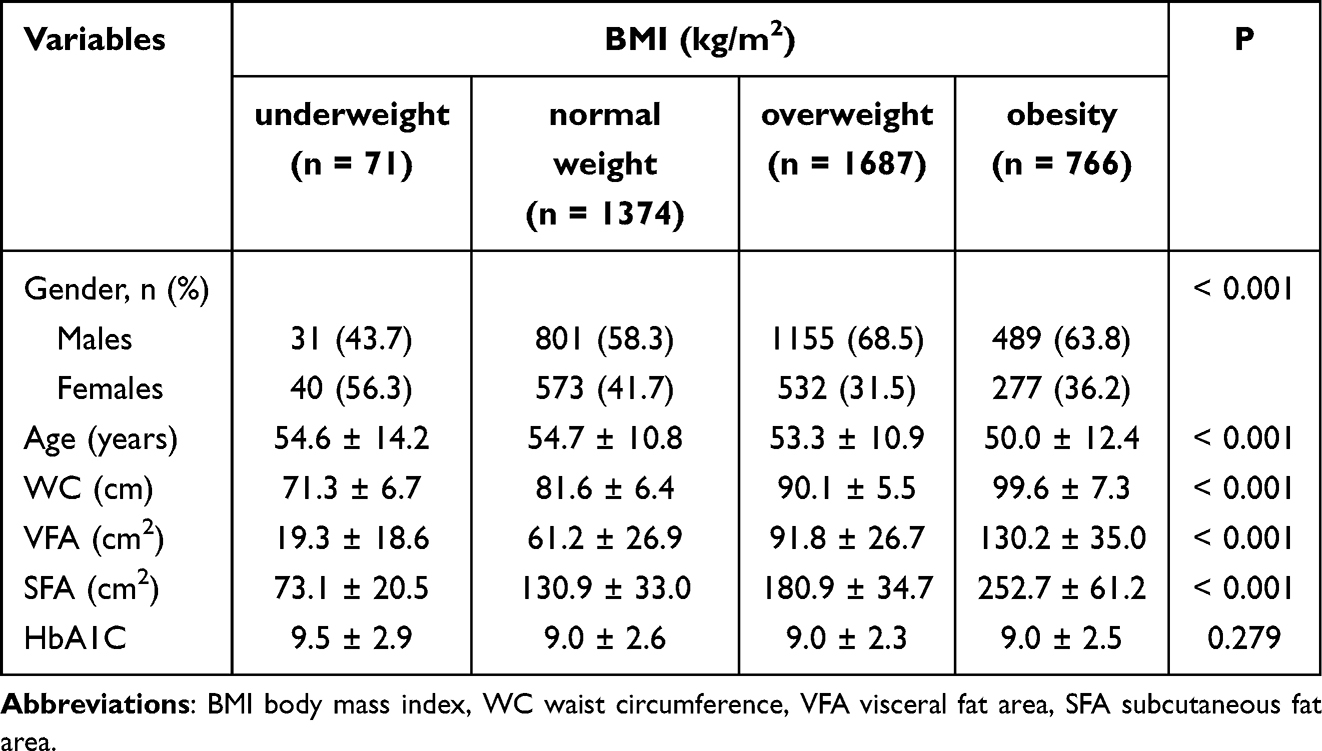 |
Table 2 Baseline Characteristics When Grouped by BMI |
Main Outcomes
Linear regression analysis assessing the effects of BMI, WC, and VFA on HbA1c levels revealed no statistically significant associations. The β coefficients for BMI (−0.0029, 95% CI: −0.0243 to 0.0185, p = 0.79), WC (−0.0037, 95% CI: −0.012 to 0.0047, p = 0.38), and VFA (−0.0012, 95% CI: −0.0032 to 8 × 10⁻⁴, p = 0.24) all indicated non-significant relationships with HbA1c (Table 3). These results suggest that although BMI, WC, and VFA are interrelated and correlate with other health parameters, they may not directly influence HbA1c levels in this study population. Correlation analysis demonstrated no significant associations between HbA1c and several anthropometric parameters (Figure 1).
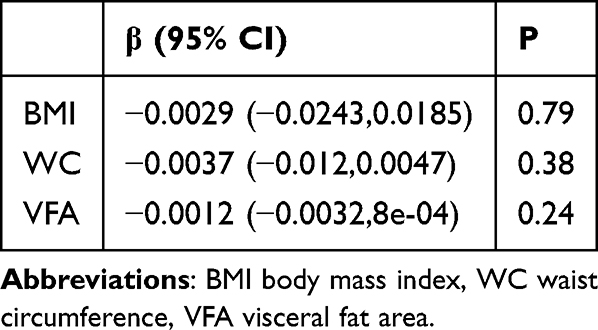 |
Table 3 Liner Regression Analysis for HbA1c |
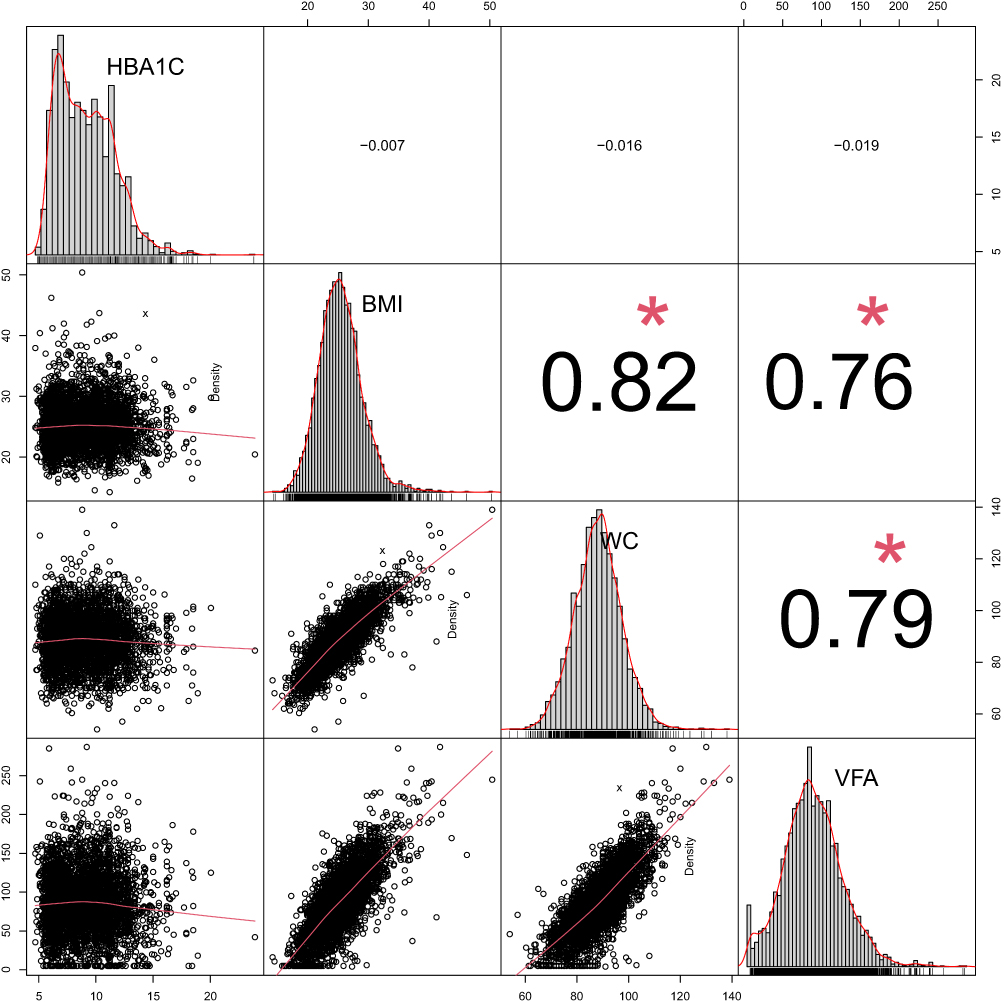 |
Figure 1 Correlation coefficients between the varies. *P values <0.05. |
Discussion
In this study, although BMI, WC, and VFA were significantly correlated in patients with T2DM, linear regression analysis revealed no significant associations between these indexes and HbA1c levels. These findings suggest that BMI, WC, and VFA may not be primary factors directly influencing HbA1c control in patients with T2DM.
The traditional view posits that obesity exacerbates hyperglycemia through insulin resistance, leading to increased HbA1c levels.10–12 However, this study did not observe a direct statistical relationship along this pathway. Previous research has indicated that, in both humans and mice, obesity is associated with insulin resistance, dyslipidemia, and T2DM.13 Additionally, a cross-sectional study of nationally representative data from 685,616 adults demonstrated that increasing BMI is associated with a higher risk of T2DM.14 However, these studies focused on healthy individuals rather than patients with T2DM. A follow-up study of patients with T2DM on a moderately low-carbohydrate diet found that reductions in HbA1c were not related to baseline BMI.15 Similarly, a study of individuals with type 1 diabetes reported no association between BMI and HbA1c levels.16
All participants in this study were diagnosed with T2DM, and most had received varying degrees of therapy prior to the study. This characteristic may obscure the original biological relationship between obesity and blood glucose. Hypoglycemic medications can directly improve glycemic control through mechanisms independent of body weight. For example, metformin lowers blood glucose by inhibiting hepatic glucose production and enhancing insulin sensitivity,17 while SGLT-2 inhibitors reduce glucose load by promoting urinary glucose excretion,18 both effects being independent of body weight changes.
Pharmacological interventions may also alter the natural relationship between obesity and blood glucose. Sulfonylureas, for instance, lower blood glucose by stimulating insulin secretion but may simultaneously promote fat synthesis and weight gain, creating a complex feedback loop of “treatment–weight–blood glucose.”19,20 Although GLP-1 receptor agonists reduce both weight and blood glucose,21 their effects may mask the original influence of obesity on glycemic control in untreated individuals. Furthermore, lifestyle modifications, such as dietary changes and increased physical activity, may confound the evaluation of the relationship between obesity and blood glucose. For example, some patients may voluntarily lose weight after diagnosis, resulting in current weight measurements that do not accurately reflect metabolic status during the early stages of disease.
Although this study provides valuable insights into the relationship between BMI, WC, VFA, and HbA1c in patients with T2DM, several limitations exist in the research design. First, this study employed a cross-sectional design, which can only capture associations at a single time point and cannot clarify causal direction or temporal relationships between variables. Future studies should aim to verify causal relationships through prospective cohort studies or Mendelian randomization analyses. Second, due to the constraints of a retrospective analysis, this study did not collect key confounding factors, including participants’ dietary patterns, exercise frequency, and types and doses of hypoglycemic medications, which may introduce residual bias in evaluating the pathway linking obesity, metabolic indicators, and glycemic control. Finally, as a single-center study, the limited diversity of the sample may restrict the generalizability of the findings. To more comprehensively examine the dynamic relationships between metabolic indexes and glycemic control, future research should incorporate multi-center, large-sample, longitudinal designs with strict control of confounding variables.
Conclusion
No significant correlation was observed between BMI and HbA1c levels in patients with T2DM, nor between WC and VFA. Targeting obesity indices alone may be insufficient for optimal glycemic control in T2DM and should be complemented by regular blood glucose monitoring, pharmacological treatment, and comprehensive lifestyle interventions. Patients with T2DM are encouraged to engage in daily self-monitoring of blood glucose and to communicate promptly with their healthcare providers to adjust treatment plans according to fluctuations in glucose levels, thereby improving overall disease management.
Data Sharing Statement
The datasets generated and/or analyzed during the current study are not publicly available due to privacy concerns, but are available from the corresponding author.
Acknowledgments
We would like to express our sincere gratitude to the Clinical Laboratory Department of Yuxi People’s Hospital for their invaluable contributions to this study, particularly in providing clinical data and offering expert guidance on paper preparation.
Author Contributions
Conceptualization, Pei Gang; formal analysis, Jianfeng Zhu, Bing Zhang; methodology, Yanxiao Zhao, Xiaowei Zhao; writing—original draft, Pei Gang, Jianfeng Zhu, Bing Zhang, Yanxiao Zhao, Xiaowei Zhao; data curation, Beibei Luo; writing–review and editing, Beibei Luo. All authors gave final approval of the version to be published; have agreed on the journal to which the article has been submitted; and agree to be accountable for all aspects of the work.
Funding
The authors declare that no funding was received for this work.
Disclosure
The authors declared no potential conflicts of interest with respect to the research, author- ship, and/or publication of this article.
References
1. Xu Y, Lu J, Li M, et al. Diabetes in China part 1: epidemiology and risk factors. Lancet Public Health. 2024;9(12):e1089–7. doi:10.1016/S2468-2667(24)00250-0
2. Zhou X, Lai W, Zhong J, Yang Y, Chen Z, Zhang C. Point-of-care detection of glycated hemoglobin using a novel dry chemistry-based electrochemiluminescence device. Anal. Chim. Acta. 2023;1279:341829. doi:10.1016/j.aca.2023.341829
3. American Diabetes Association Professional Practice Committee. 2. Classification and Diagnosis of Diabetes: standards of Medical Care in Diabetes—2022. Diabetes Care. 2022;45(Supplement_1):S17–38. doi:10.2337/dc22-S002
4. Tucker LA. Serum, Dietary, and Supplemental Vitamin D Levels and Insulin Resistance in 6294 Randomly Selected, Non-Diabetic U.S. Adults. Nutrients. 2022;14(9):1844. doi:10.3390/nu14091844
5. Cao H, Huang X, Luo B, Shi W, Li H, Shi R. Gender Differences of Visceral Fat Area to Hip Circumference Ratio for Insulin Resistance. <![CDATA[Diabetes, Metabolic Syndrome and Obesity]]>. 2024;17:3935–3942. doi:10.2147/DMSO.S482820
6. Lin W. The Association between Body Mass Index and Glycohemoglobin (HbA1c) in the US Population’s Diabetes Status. International Journal of Environmental Research and Public Health. 2024;21(5):517. doi:10.3390/ijerph21050517
7. Koshizaka M, Ishikawa K, Ishibashi R, et al. Comparing the effects of ipragliflozin versus metformin on visceral fat reduction and metabolic dysfunction in Japanese patients with type 2 diabetes treated with sitagliptin: a prospective, multicentre, open-label, blinded-endpoint, randomized controlled study (PRIME-V study). Diabetes, Obesity & Metabolism. 2019;21(8):1990–1995. doi:10.1111/dom.13750
8. Tran AM, Wander PL, Thomas MK, et al. Plasma amino acid profile, a biomarker for visceral adipose tissue that can substitute for waist circumference in Japanese Americans. Obesity Res Clin Prac. 2021;15(6):557–563. doi:10.1016/j.orcp.2021.10.007
9. WHO Expert Consultation. Appropriate body-mass index for Asian populations and its implications for policy and intervention strategies. Lancet. 2004;363(9403):157–163. doi:10.1016/S0140-6736(03)15268-3
10. Patel SJ, Liu N, Piaker S, et al. Hepatic IRF3 fuels dysglycemia in obesity through direct regulation of Ppp2r1b. Sci Transl Med. 2022;14(637):eabh3831. doi:10.1126/scitranslmed.abh3831
11. Slywitch E, Savalli C, Duarte AC, Escrivão MAMS. Obese Vegetarians and Omnivores Show Different Metabolic Changes: analysis of 1340 Individuals. Nutrients. 2022;14(11):2204. doi:10.3390/nu14112204
12. Winzell MS, Ahrén B. The High-Fat Diet–Fed Mouse. Diabetes. 2004;53(suppl_3):S215–9. doi:10.2337/diabetes.53.suppl_3.S215
13. Emont MP, Jacobs C, Essene AL, et al. A single-cell atlas of human and mouse white adipose tissue. Nature. 2022;603(7903):926–933. doi:10.1038/s41586-022-04518-2
14. Teufel F, Seiglie JA, Geldsetzer P, et al. Body-mass index and diabetes risk in 57 low-income and middle-income countries: a cross-sectional study of nationally representative, individual-level data in 685 616 adults. Lancet. 2021;398(10296):238–248. doi:10.1016/S0140-6736(21)00844-8
15. Sanada M, Kabe C, Hata H, et al. Efficacy of a Moderately Low Carbohydrate Diet in a 36-Month Observational Study of Japanese Patients with Type 2 Diabetes. Nutrients. 2018;10(5):528. doi:10.3390/nu10050528
16. Cummings LAM, Clarke A, Sochett E, et al. Social Determinants of Health Are Associated with Markers of Renal Injury in Adolescents with Type 1 Diabetes. J Pediatr. 2018;198:247–253.e1. doi:10.1016/j.jpeds.2018.03.030
17. Chun M-H, Kim JY, Park E-S, Choi DH. Development of a Robust Control Strategy for Fixed-Dose Combination Bilayer Tablets with Integrated Quality by Design, Statistical, and Process Analytical Technology Approach. Pharmaceutics. 2021;13(9):1443. doi:10.3390/pharmaceutics13091443
18. Zhuo M, Hawley CE, Paik JM, et al. Association of Sodium-Glucose Cotransporter–2 Inhibitors With Fracture Risk in Older Adults With Type 2 Diabetes. JAMA Network Open. 2021;4(10):e2130762. doi:10.1001/jamanetworkopen.2021.30762
19. Hinnen DA. Therapeutic Options for the Management of Postprandial Glucose in Patients With Type 2 Diabetes on Basal Insulin. Clin Diabetes. 2015;33(4):175–180. doi:10.2337/diaclin.33.4.175
20. Mechanisms and Characteristics of Sulfonylureas and Glinides. CTMC. 2020. 10.2174/15680266MTAzgMjAcz.
21. Blundell J, Finlayson G, Axelsen M, et al. Effects of once-weekly semaglutide on appetite, energy intake, control of eating, food preference and body weight in subjects with obesity. Diabetes, Obesity and Metabolism. 2017;19(9):1242–1251. doi:10.1111/dom.12932
 © 2026 The Author(s). This work is published and licensed by Dove Medical Press Limited. The
full terms of this license are available at https://www.dovepress.com/terms
and incorporate the Creative Commons Attribution
- Non Commercial (unported, 4.0) License.
By accessing the work you hereby accept the Terms. Non-commercial uses of the work are permitted
without any further permission from Dove Medical Press Limited, provided the work is properly
attributed. For permission for commercial use of this work, please see paragraphs 4.2 and 5 of our Terms.
© 2026 The Author(s). This work is published and licensed by Dove Medical Press Limited. The
full terms of this license are available at https://www.dovepress.com/terms
and incorporate the Creative Commons Attribution
- Non Commercial (unported, 4.0) License.
By accessing the work you hereby accept the Terms. Non-commercial uses of the work are permitted
without any further permission from Dove Medical Press Limited, provided the work is properly
attributed. For permission for commercial use of this work, please see paragraphs 4.2 and 5 of our Terms.
Recommended articles

Association of Different Obesity Phenotypes with Sarcopenia in Han Chinese Middle-Aged and Elderly with Type 2 Diabetes Individuals
Lu L, Liu B, Ma Y
Diabetes, Metabolic Syndrome and Obesity 2023, 16:841-848
Published Date: 21 March 2023
Analysis of Risk Factors for the Association of Sarcopenia in Patients with Type 2 Diabetes Mellitus
Du Y, Wang Y, Zhang P, Zhong X, Pan T
Diabetes, Metabolic Syndrome and Obesity 2024, 17:1455-1466
Published Date: 27 March 2024
%BF, Rather Than BMI, is Associated with an Increased Risk of Sarcopenia in Hospitalized Postmenopausal Chinese Women with Type 2 Diabetes Mellitus
Lu L, Du G, Qi C, Liu J, Wang X, Fan D, Sun L, Wang N, Liu B
Diabetes, Metabolic Syndrome and Obesity 2024, 17:4223-4231
Published Date: 7 November 2024