Back to Journals » Clinical Ophthalmology » Volume 17
Corneal Epithelial Thickness Changes After Topical Treatment of Dry Eye Disease in Primary Sjögren Syndrome
Authors Loureiro T ![]() , Rodrigues-Barros S, Carreira AR, Gouveia-Moraes F
, Rodrigues-Barros S, Carreira AR, Gouveia-Moraes F ![]() , Carreira P
, Carreira P ![]() , Vide Escada A, Campos P, Machado I, Campos N, Ambrosio Jr R
, Vide Escada A, Campos P, Machado I, Campos N, Ambrosio Jr R ![]() , Archer TJ, Reinstein DZ
, Archer TJ, Reinstein DZ ![]()
Received 24 May 2022
Accepted for publication 11 August 2022
Published 1 April 2023 Volume 2023:17 Pages 993—1005
DOI https://doi.org/10.2147/OPTH.S375505
Checked for plagiarism Yes
Review by Single anonymous peer review
Peer reviewer comments 3
Editor who approved publication: Dr Scott Fraser
Tomas Loureiro,1 Sandra Rodrigues-Barros,1 Ana Rita Carreira,1 Filipe Gouveia-Moraes,1 Pedro Carreira,1 Ana Vide Escada,1 Paul Campos,1 Ines Machado,1 Nuno Campos,1 Renato Ambrosio Jr,2 Timothy J Archer,3 Dan Z Reinstein3
1Ophthalmology Department, Hospital Garcia de Orta, Almada, Portugal; 2Federal University of the State of Rio de Janeiro, Rio de Janeiro, Brazil; 3London Vision Clinic, London, UK
Correspondence: Tomas Loureiro, Ophthalmology Department, Hospital Garcia de Orta, Avenida Torrado da Silva, Almada, 2805-267, Portugal, Tel +351 913 513 175, Email [email protected]
Purpose: To evaluate the changes on epithelial thickness before and after topical treatment in primary Sjögren syndrome-associated dry eye disease (SS-DED).
Methods: This was a prospective study that included referred women with SS-DED and healthy age-matched controls. Corneal epithelial thickness was evaluated using high-definition anterior segment optical coherence tomography (Cirrus 5000 HD-OCT) in the baseline first consultation, and four weeks after treatment with preservative free 1mg/1mL sodium hyaluronate. Schirmer test 1 (ST1), tear break-up time (TBUT), tear meniscus height (TMH), SICCA Ocular Surface Score (SICCA OSS) and Ocular Surface Disease Index (OSDI) were evaluated. Statistical significance was defined as p-value < 0.05.
Results: The study included 40 eyes, 20 with SS-DED and 20 controls. At baseline, SS-DED patients had lower ST1 (11.1 ± 2.2mm vs 14.1 ± 3.1mm, p< 0.01), faster TBUT (9.1 ± 1.8s vs 13.2 ± 1.1s, p< 0.01) and lower TMH (211.2 ± 68.4 μm vs 217.2 ± 60.1μm; p< 0.01) than the control group, whereas SICCA OSS and OSDI were higher (p< 0.01). The superior epithelium was thinner in SS-DED group (41.1 ± 3.2 μm vs 43.1± 2.3 μm, p< 0.01). After treatment, ST1, TBUT, TMH, SICCA OSS, and OSDI improved (p< 0.01), and superior epithelium thickened (p< 0.01) in the SS-DED group.
Conclusion: Treatment with sodium hyaluronate improved ST1, TBUT, TMH, SICCA-OSS, and OSDI score. Superior epithelium tends to be thinner in SS-DED but becomes thicker with treatment. Our results seem to illustrate the morphological changes in the corneal epithelium in DED, which could be further recognized as a clinical biomarker of SS-DED.
Keywords: dry eye disease, Sjogren’s syndrome, epithelial thickness, AS-OCT
Introduction
Dry eye disease (DED) is a multifactorial disorder that results in ocular surface damage. Increased tear film osmolarity activates a cascade of inflammatory events that affect the lacrimal functional unit and impair tear film production.1 The lack of tears or poor-quality tear film leads to ocular surface injury. It may affect epithelial integrity, which is essential to maintain ocular health and maintain the optical quality of the eye.2,3 Clinical consequences of DED include ocular discomfort, photosensitivity, visual acuity compromise, and quality of life impairment.3
Sjögren syndrome associated dry eye is an inflammatory condition characterized by lymphocytic infiltration of the lacrimal glands leading to ocular surface damage. In addition, SS patients often experience a mixed dry eye with an additional evaporative component.4,5
The ocular surface damage is usually evaluated using vital stains such as fluorescein for corneal epithelium. Considering the role of the epithelium in many ophthalmological pathologies, corneal epithelial thickness has been increasingly studied by several imaging techniques, such as very high-frequency (VHF) digital ultrasound, confocal microscopy, and anterior segment optical coherence tomography (AS-OCT). The latter, besides being a non-contact method and with negligible corneal infection risk, provides high resolution, reliable and reproducible epithelial thickness analyses.6 As such, many recent studies have used AS-OCT to measure epithelial thickness in vivo in humans.7–9
Epithelial thickness has been studied in areas including corneal ectasias (keratoconus), after refractive surgery, contact lenses wearing, and DED.7,10–17 Regarding the effect of DED on corneal epithelial thickness, results are conflicting, describing either a localized thinning in the superior epithelium or thickening in overall epithelium.16,18 The studies only agree that there is higher variation in epithelial thickness in DED eyes than controls.19 To the best of our knowledge, there is only one study that aimed to evaluate ocular surface changes in DED associated with Sjögren syndrome, but no one evaluated corneal epithelial thickness profile.20
This study aimed to evaluate the signs, symptoms, and epithelial thickness profile in Sjögren syndrome associated with dry eye disease and the changes related to treatment with sodium hyaluronate.
Methods
This was a prospective study that included women recently diagnosed with Primary Sjögren Syndrome (less than 6 months) according to American College of Rheumatology/European League Against Rheumatism criteria21 with dry eye symptoms (SS-DED group) and a control group of healthy age-matched women without dry eye disease and without treatment with artificial tears over the past 6 months. Exclusion criteria included diabetes mellitus (DM) and thyroid disorders. Patients under anticholinergic drugs and topical glaucoma drops, with a history of contact lenses wear, herpetic ocular infection, ophthalmological surgery, blepharitis, or meibomian gland dysfunction (MGD) were also excluded. The study was conducted by the principles of the Declaration of Helsinki. All participants were informed about the purpose of the study and signed consent was obtained. Approval was obtained from the institutional Research Committee of Hospital Garcia de Orta (Almada, Portugal).
Ophthalmological observations followed the same method at baseline and after treatment, including preservative-free 1mg/1mL sodium hyaluronate, 4 times a day for four weeks. Patients were tested for the uncorrected and corrected distance visual acuity (UDVA and CDVA, respectively) and refractive error presented as spherical equivalent (SE).
Corneal epithelial thickness was measured by anterior segment spectral-domain Cirrus 5000 HD-OCT (Carl Zeiss Meditec, Germany). The software algorithm measures epithelial thickness as the distance between the middle of the first (tear film) and second (anterior surface of the Bowman layer) hyperreflective lines on the B-scan. Two scans were obtained for each eye by one examiner with a minute break, and average values were registered. Data were exported and processed with Cirrus HD-OCT review software (version 10.0) which provides average epithelial thickness in three concentric ring-shaped zones centered on the center of the cornea (central (CET): 0–2 mm, paracentral: 2–5 mm, and mid-peripheral: 5–7 mm). Epithelial thickness was also recorded for specific octants of the cornea: superior (S), inferior (I), temporal (T), nasal (N), superonasal (SN), superotemporal (ST), inferotemporal (IT), and inferonasal (IN) within the paracentral, and midperipheral areas.
Tear meniscus height (TMH) and lipid layer thickness (LLT) were measured with IDRA® – Ocular Surface Analyzer (SBM Sistemi).
Schirmer test 1 (ST1) was performed with appropriate strips without anesthesia and results were read after 5 minutes. Tear break-up time (TBUT) was evaluated.
Sjögren’s International Collaborative Clinical Alliance Ocular Staining Score (SICCA OSS) was calculated to grade dry eye severity.22 Corneal score was given by punctate epithelial erosions (PEE) that stain with fluorescein as: 0, no PEE; 1, 1–5 PEE, 2, 6–30 PEE and 3, >30 PEE. An additional point was added if PEE occurred in the central 4mm diameter of cornea, one or more filaments were seen in the cornea, or if patches of confluent staining were found. The maximum fluorescein score for each eye was 6. The conjunctival score was given by dots of lissamine green staining as: 0, 0–9 dots; 1, 10–32 dots; 2, 33–100 dots; 3, >100 dots. Any area of confluent staining ≥ 4mm2 was considered as grade 3. Nasal and temporal conjunctiva were evaluated separately, with a total maximum score of 6 for each eye. Therefore, the maximum SICCA OSS score was 12 for each eye.
As the application of vital dyes can affect subsequent results, observation followed the recommendations of SICCA group recommendations: ST1 was performed first, followed by instillation of fluorescein dye (eyedrop) to determine TBUT and grade corneal fluorescein staining pattern (one minute after instillation). Lissamine green dye (eyedrop) was applied after 5 minutes, the conjunctiva was quickly examined to grade conjunctival staining pattern (Figure 1).22
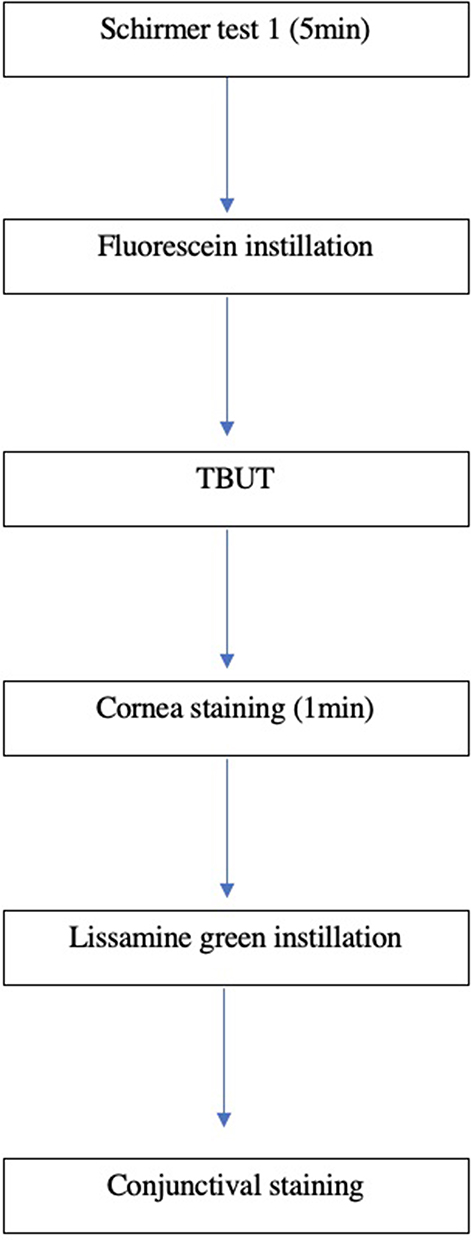 |
Figure 1 Flowchart of ocular surface evaluation. Abbreviation: TBUT, tear break-up time. |
The Ocular Surface Disease Index (OSDI) 12-item questionnaire was given to assess dry eye symptoms and their impact on vision-related function. The 12 items of OSDI were graded on a scale of 0 to 4 and the total score was given on a scale of 0 to 100 with higher scores representing higher disability. According to OSDI score, patients were classified as: normal, 0–12; mild, 13–22; moderate, 23–32 and severe dry eye, 33–100.23–25
SS-DED was considered when OSDI was greater than 12 and associated with tear film disturbance (ST1 < 5mm/5min, TBUT < 10 seconds or any positive staining).26 Controls had OSDI ≤ 12, ST1 > 5mm/5min, TBUT > 10 seconds and no ocular surface positive staining.
A randomization 1:1 scheme was applied to select only one eye of each patient. Qualitative variables are presented as numbers and percentages. Quantitative variables are presented as mean and standard deviation. Wilcoxon tests were performed to compare the results between groups at the baseline to compare the results before and after treatment in DED group. Correlations between average epithelial thickness and tear film measurements were assessed using the Pearson correlation test. Statistical significance was set at p<0.05 (two-sided). IBM® SPSS® Statistics v23.0 was used.
Results
This study included 20 women with SS-DED and 20 female controls. The mean age did not differ between groups [57.2 ± 6.3 (50–62) vs 56.3 ± 4.8 (52–61)] years, p=0.66). Fourteen patients in the SS-DED group (70%) were on hydroxychloroquine treatment with a mean daily dose of 257.1± 85.2 mg (200–400 mg). All eyes included had LLT > 90 nm to exclude evaporative dry eye disease, which may also occur in Sjögren Syndrome, and evaluate only aqueous deficient dry eyes.4,5
The ocular surface evaluation results at baseline are presented in Table 1. There were no statistically significant differences for UDVA (p=0.89), CDVA (p=0.89), SE (p=0.89) or LLT (p=0.42) between groups. The ST1, TBUT, and TMH (p<0.01) were lower in SS-DED than controls. SICCA OSS (5.8 ± 1.2 vs 0.8 ± 0.3, p<0.01) and OSDI score (70.8 ± 9.3% vs 9.1 ± 3.1%, p<0.01) were higher in SS-DED group.
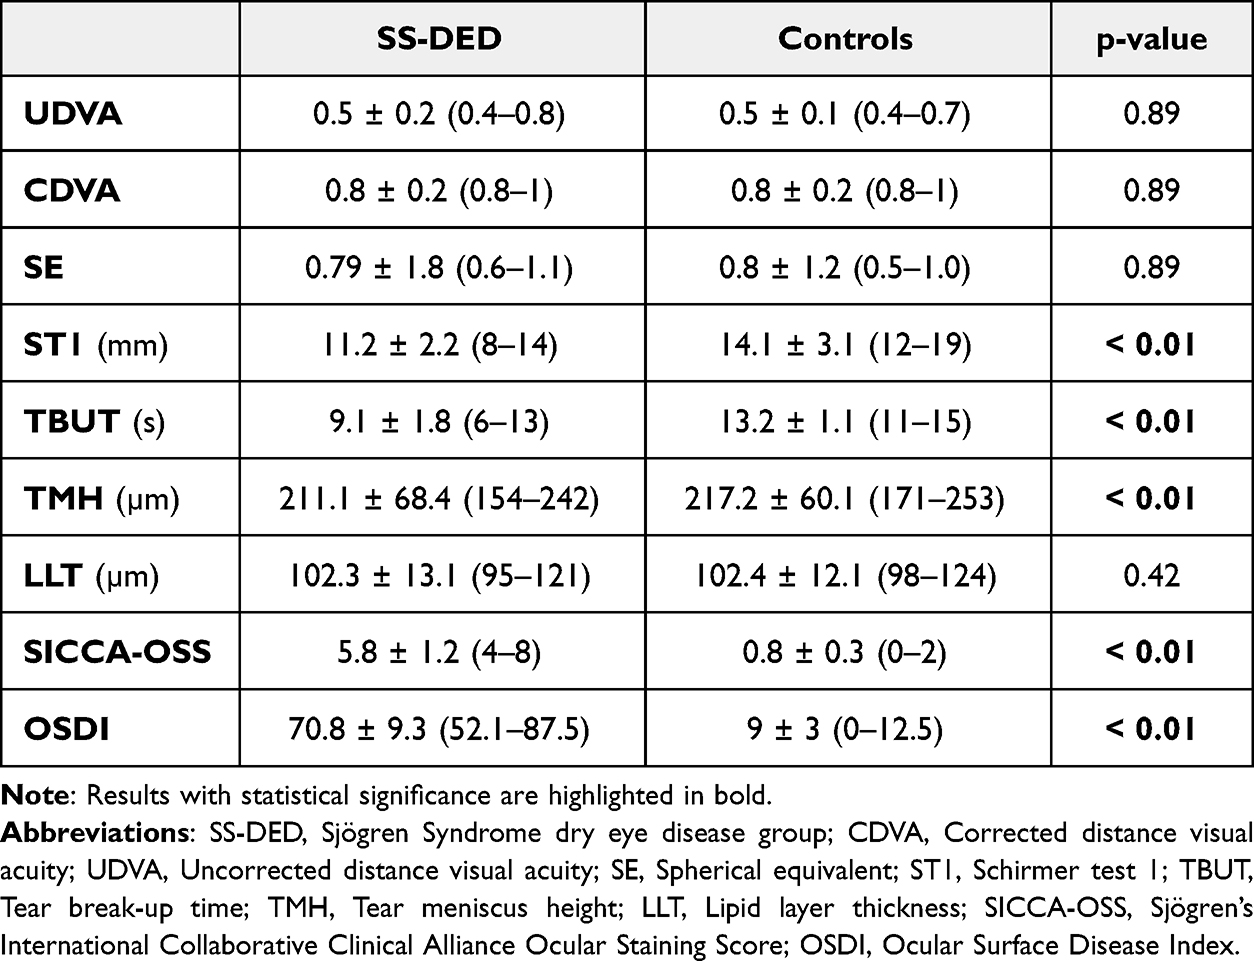 |
Table 1 Baseline Evaluation |
The baseline epithelial thickness profiles are presented in Figures 2 for the SS-DED group and in Figure 3 for the control group. The differences between groups are shown in Table 2. There was no statistically significant difference for central epithelial thickness (46.9 ± 1.1µm vs 47.9 ± 1.2µm, p=0.33). Epithelial thickness was thinner for the SS-DED group in the superior, supero-temporal and supero-nasal octants in both paracentral (p<0.01) and midperipheral areas (p<0.01). Unlike these areas, there were no statistically significant differences for epithelial thickness in the other octants. The difference between inferior and superior octants (I-S) was higher in the SS-DED group (5.6 ± 0.8 µm vs 3.6 ± 0.4µm, p<0.01). Similarly, the difference between the minimum and maximum epithelial thickness (Min-Max) was also greater in the SS-DED group (−10.1 vs −7.4, p < 0.01).
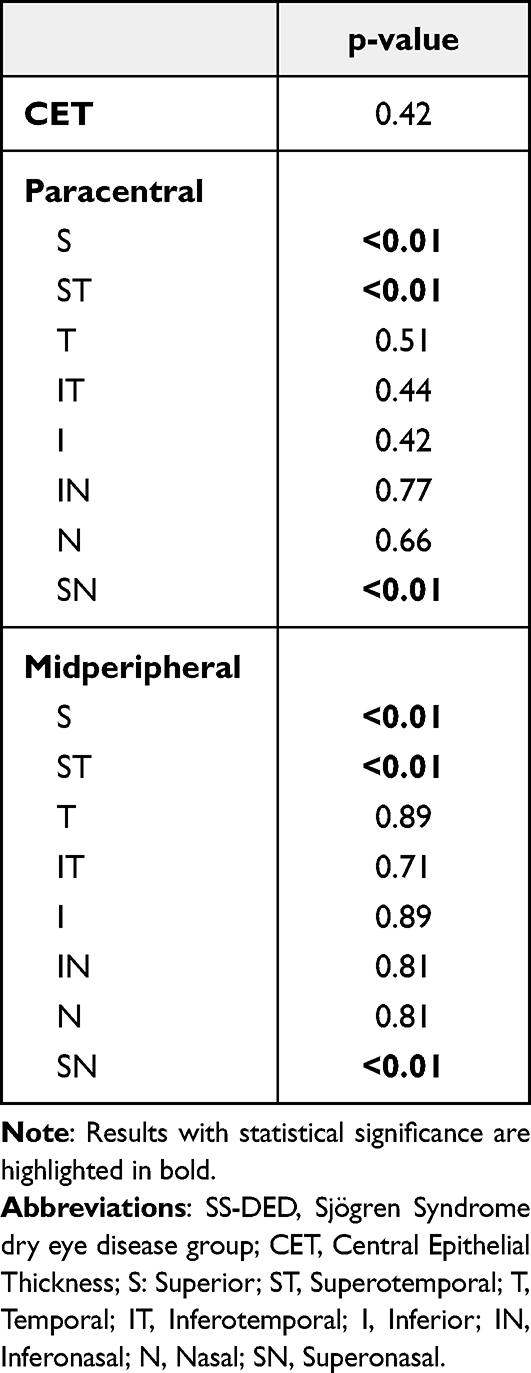 |
Table 2 Epithelial Thickness Comparison Between SS-DED Groups and Controls at the Baseline |
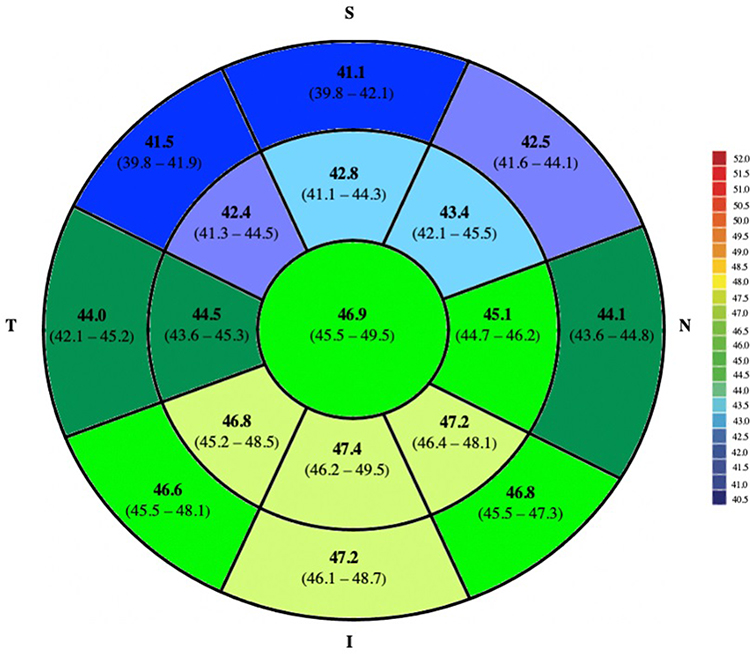 |
Figure 2 Epithelial thickness profile in SS-DED group at the baseline (µm). Abbreviations: SS-DED, Sjögren Syndrome dry eye disease; S, Superior; T, Temporal; I, Inferior; N, Nasal. |
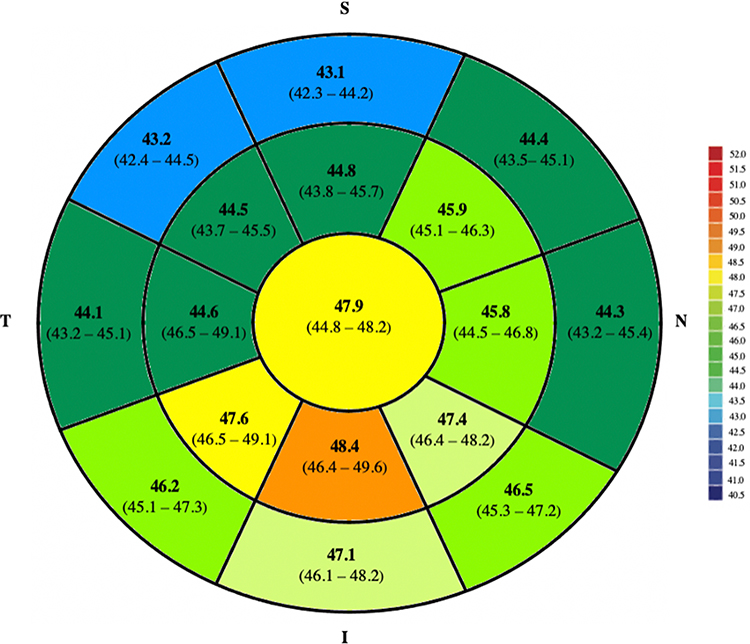 |
Figure 3 Epithelial thickness profile in control group at the baseline (µm). Abbreviations: S, Superior; T, Temporal; I, Inferior; N, Nasal. |
The comparison between baseline and after treatment evaluations in the SS-DED group are presented in Table 3. There was no statistically significant change in UDVA (p=0.89), CDVA (p=0.89), SE (p=0.21) and LLT (p=0.42). However, there was a statistically significant improvement in ST1 (p<0.01), TBUT (p<0.01), TMH (p=0.04) and SICCA OSS (p<0.01). The OSDI score was improved for all patients, with a mean score of 46.9 ± 2.2% (p < 0.01) after treatment, which represented a decrease of 66% on average. The epithelial thickness profile after treatment is presented in Figure 4. In the SS-DED group, the epithelium thickened after treatment in the superior, supero-nasal, and supero-temporal octants in both paracentral and midperipheral areas (p<0.01) (Table 4). There were no statistically significant differences in other areas, including in central epithelial thickness (Figure 5). The I-S difference decreased to 3.9 ± 0.6 µm (p=0.02) and Min-Max to −8.6 µm (p=0.04).
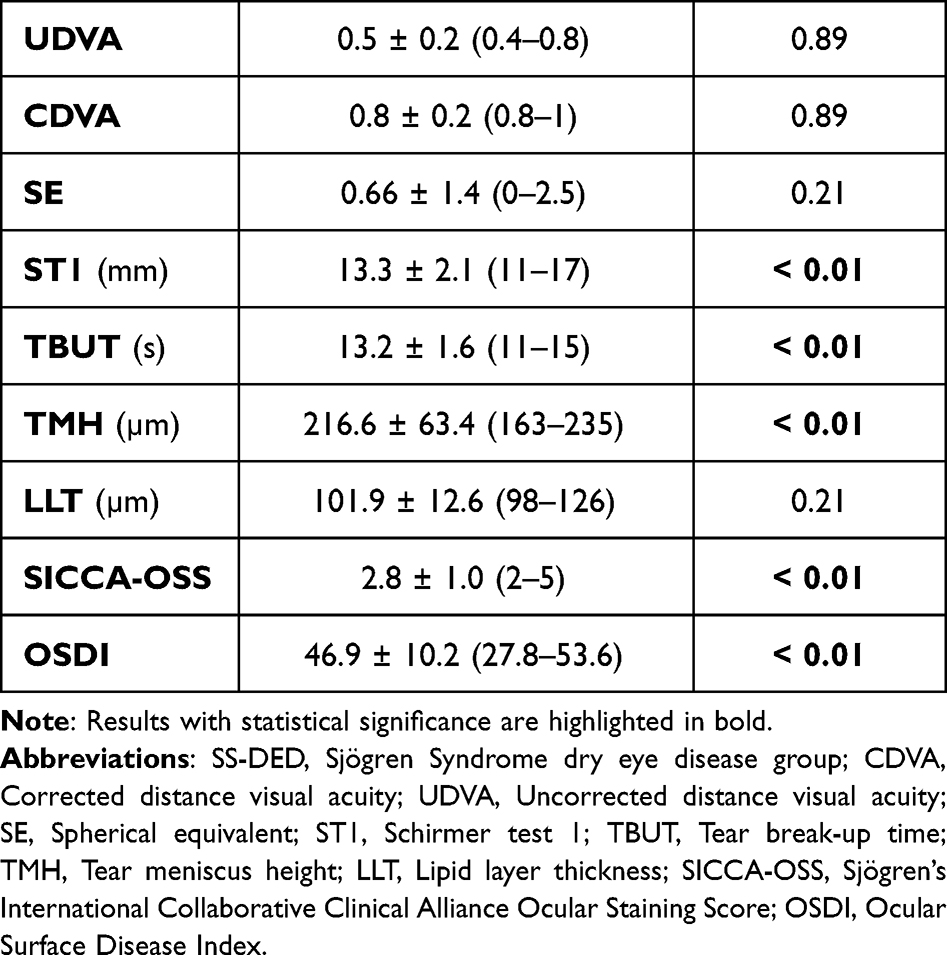 |
Table 3 After Treatment Evaluation in SS-DED Group and Comparison with Baseline |
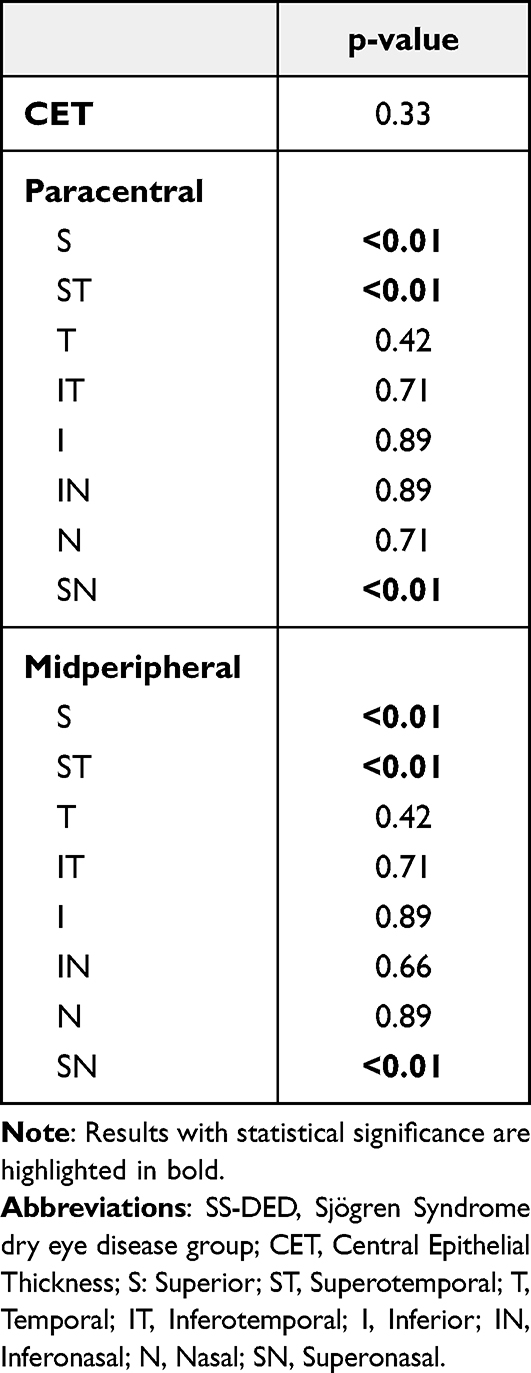 |
Table 4 Epithelial Thickness Comparison Between Baseline and After Treatment in SS-DED Group |
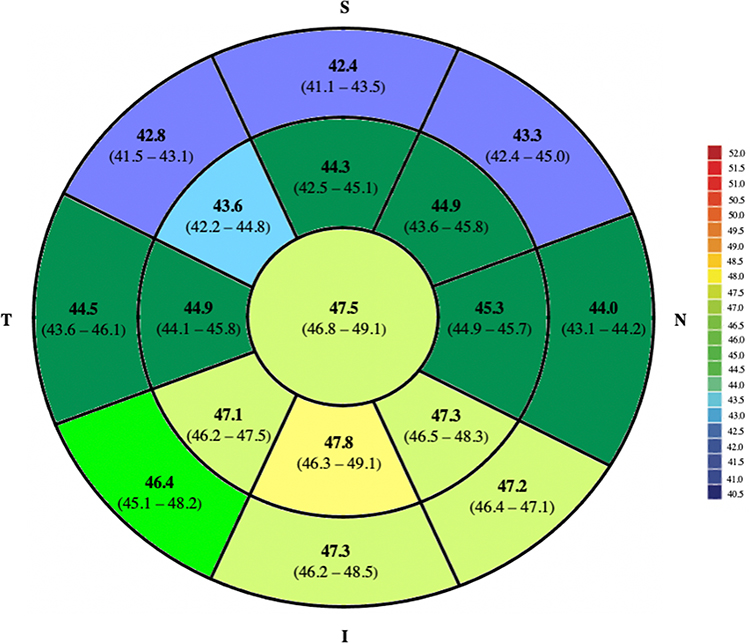 |
Figure 4 Epithelial thickness profile in SS-DED group after treatment (µm). Abbreviations: SS-DED, Sjögren Syndrome dry eye disease; S, Superior; T, Temporal; I, Inferior; N, Nasal. |
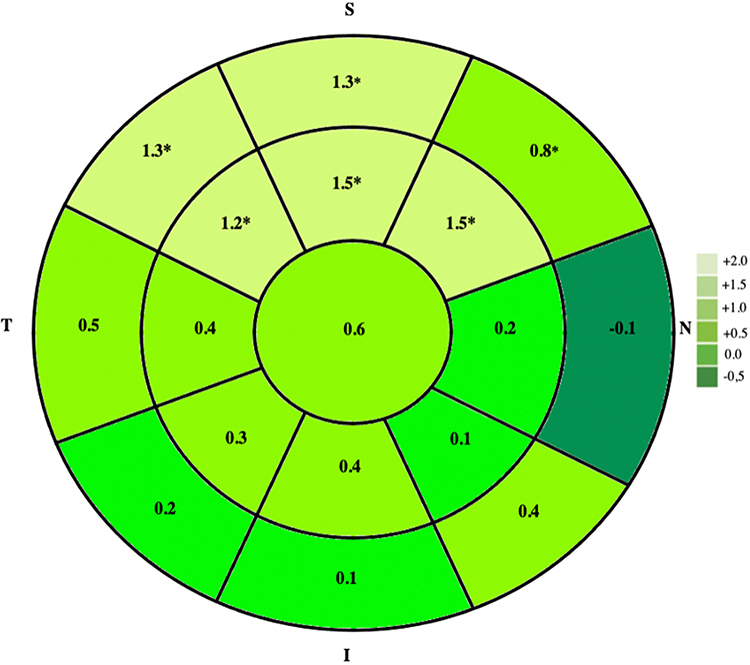 |
Figure 5 Epithelial thickness difference between after treatment and baseline in SS-DED group (µm). An asterisk denotes significant difference in mean epithelial thickness between after treatment and baseline evaluation. Abbreviations: SS-DED, Sjögren Syndrome dry eye disease; S, Superior; T, Temporal; I, Inferior; N, Nasal. |
The comparison between controls and SS-DED after treatment is presented in Table 5. There was no statistically significant difference for UDVA (p=0.89), CDVA (p=0.89), ST1 (p=0.21), TBUT (p=0.66) or LLT (p=0.42). Although the SICCA-OSS and OSDI had increased in the SS-DED group, these did not reach the level in the control group (p<0.01). The epithelial thickness was thinner in the SS-DED group for the midperipheral superior and supero-nasal areas (p=0.03 and p=0.02, respectively).
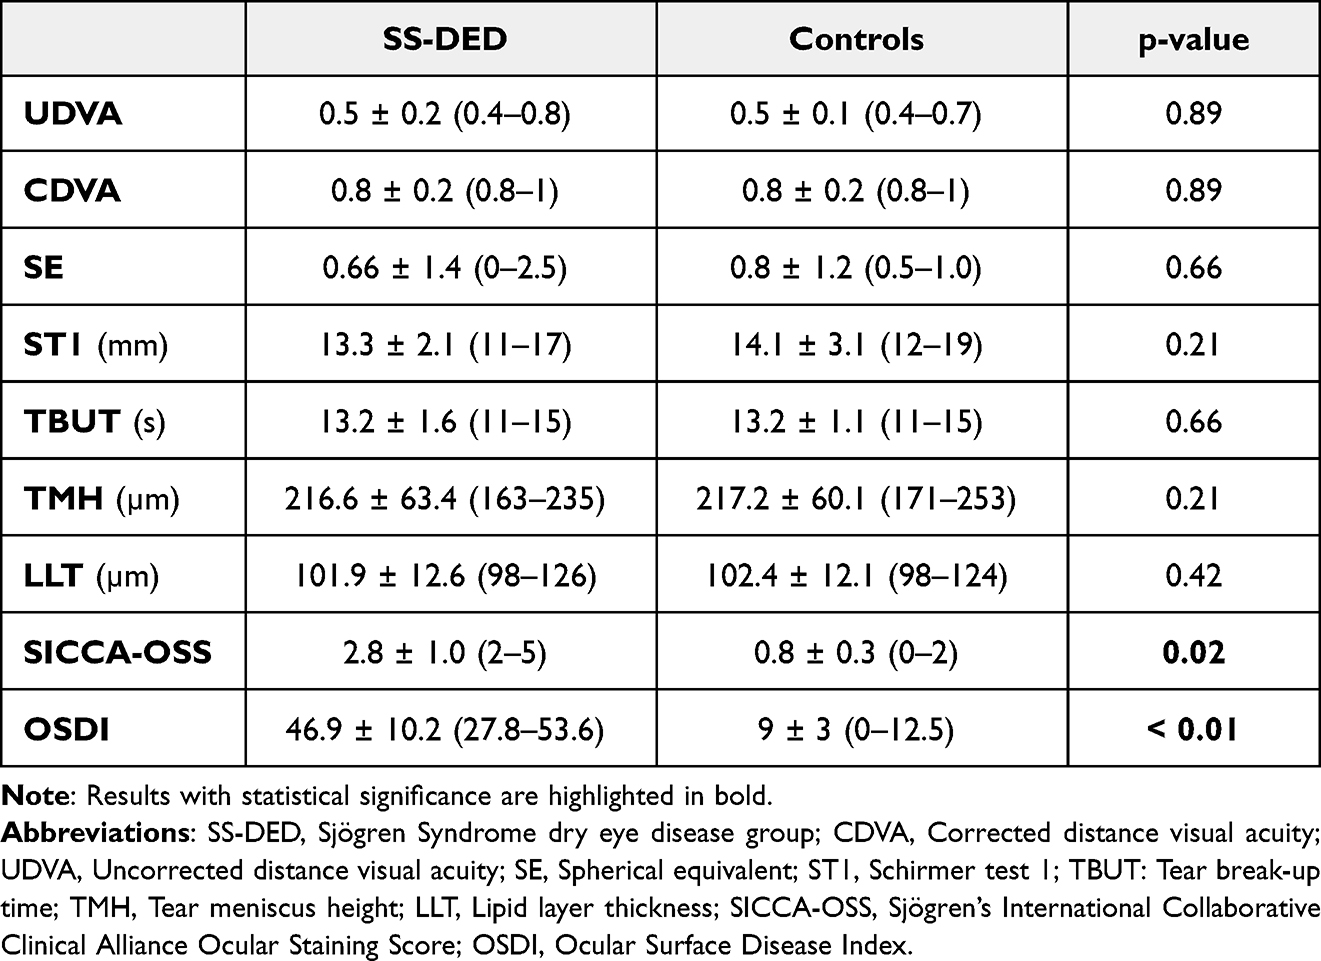 |
Table 5 Comparison Between SS-DED Group After Treatment and Controls |
Our study did not find any correlations between epithelial thickness, ST1 (p=0.52, p=0.33), TMH (p=0.66, p=0.42), SICCA score (p=0.12, p=0.33) and OSDI score (p=0.42, p=0.27) at baseline and after treatment, respectively (Table 6).
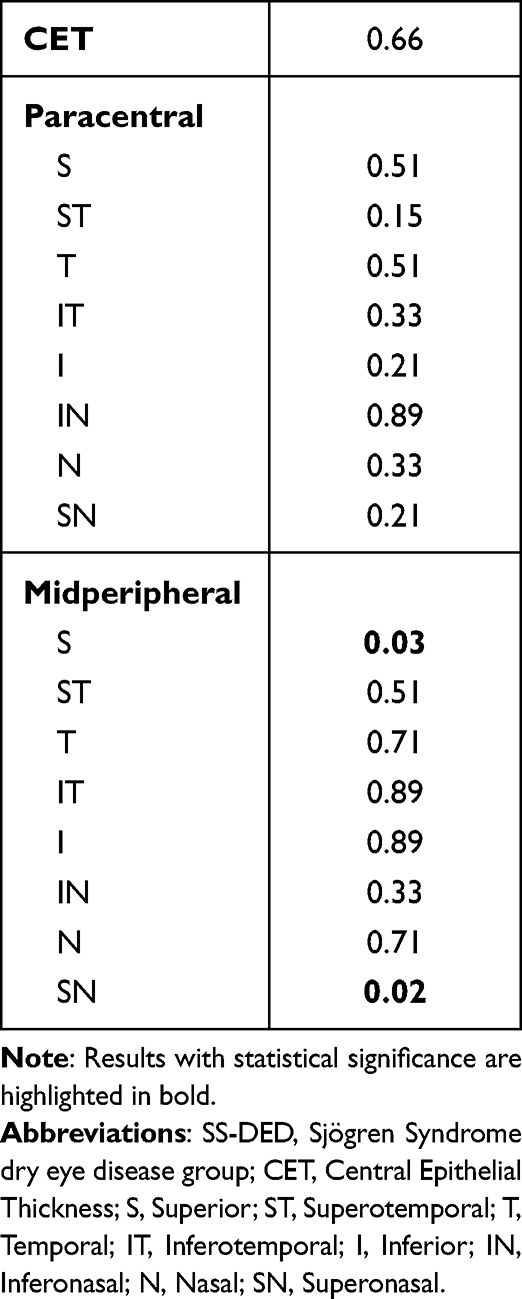 |
Table 6 Epithelial Thickness Comparison Between Controls at Baseline and SS-DED After Treatment |
Discussion
The present study shows that corneal epithelial thickness is thinner in Sjögren syndrome associated dry eye disease, in superior area. Additionally, four-week treatment with artificial tears thickened the superior epithelium and improved tear film measurements.
The role of the corneal epithelium has been recognized in many ocular diseases due to the incremental studies regarding epithelial thickness. The central 3-mm diameter area epithelial thickness was first measured in vivo by Reinstein et al in 1994 using very high frequency (VHF) digital ultrasound.27 The area of epithelial thickness increased to 10-mm and VHF digital ultrasound became the gold standard for epithelial thickness measurement due to its high precision, repeatability, and lack of tear film influence.28
Anterior segment optical coherence tomography (AS-OCT) provides high-resolution images of the corneal epithelium with no need of contact or anesthesia. With a reproducibility of 0.93 and repeatability of 0.8, AS-OCT has been widely used to study epithelial thickness as it does not require the normal saline standoff medium employed with VHF digital ultrasound scanning.6–9 However, AS-OCT measurements include the tear film which can vary between 2 and 7 µm from blink to blink and diurnally.29–31 The gold standard for epithelial measurement is VHF digital ultrasound as it is performed under normal saline immersion and therefore, epithelial measurements are made from front to back of the epithelium itself.32,33 Therefore, the epithelial thickness would be expected to be thicker on OCT. However, studies comparing the two modalities have found these to be similar. For example, Reinstein et al34 reported a mean central epithelial thickness of 54 µm with VHF digital ultrasound compared to 53 µm with RTVue OCT (Optovue, Fremont, CA). They suggest that this may be due to an arbitrary adjustment of the refractive index used in the OCT device to calibrate the mean epithelial thickness to match that of VHF digital ultrasound. In comparison, the central epithelial thickness found in the present study using Cirrus OCT was 48 µm. This tendency for the Cirrus to measure 5–6 µm thinner than the other devices may be related to the refractive index being used for the Cirrus measurements, which may need to be recalibrated to bring the measurements into line with the other devices. The epithelial thickness results reported in the present study should therefore be interpreted in this context. Rather than considering the absolute thickness values as accurate, the main findings of this study are related to the change in epithelial thickness observed after treatment and in comparison, to controls, so these differences can be translated to apply to epithelial measurements with other devices.
At baseline, ST1 and TMH were lower in SS-DED eyes than controls, demonstrating tear film production impairment. On the other hand, SICCA OSS was higher. As SICCA OSS represents damaged ocular surface cells, these results clearly illustrate the epithelial damage that occurs in untreated SS-DED. This epithelial damage seemed to be more pronounced in the superior meridian of the cornea as ET was lower in superior quadrants, which agrees with the study by Cui et al, although this was in non-autoimmune associated dry eyes.16 Although other studies have shown that superior epithelium is thinner than inferior epithelium in normal eyes, we have demonstrated it is even thinner in SS-DED (4.0 vs 5.6 µm),28 and the difference between both meridians is more pronounced than in healthy corneas.35 Many theories have been posed to explain these differences: lower epithelial thickness in the superior cornea of normal eyes seems to result from the larger force applied superiorly, while blinking.36 In dry eye disease, where the ocular surface is damaged and blinking rate is higher, the superior epithelium may be affected even more from higher mechanical friction forces, further thinning the epithelium.37 However, previous studies did not aim to evaluate epithelial thickness in auto-immune associated dry eyes where there is a more pronounced inflammatory process, and the mechanism regarding epithelial thinning may not be the same.
Previous reports in DED are scarce and still do not fully elucidate the natural history of DED regarding central corneal epithelial thickness. There are some possible explanations for epithelial thicknesses variations in DED: higher epithelial thickness due to edema from increased osmolarity and inflammation or lower epithelial thickness due to either epithelial dehydration or thinner tear film, which is not separated from epithelium by OCT. Fabiani et al showed in a rat model that central epithelium become thicker 7 days after the establishment of dry eye disease as a result of the desiccating stress that increases epithelial turnover and thickness.38 Kanellopoulos and Asimellis18,39 using AS-OCT system RTVue-100 reported higher central epithelial thickness, whereas Erdélyi et al (34) reported lower CET in dry eyes patients using confocal microscopy. The present study did not show any difference in central epithelial thickness between SS-DED and controls, which is in agreement with Francoz et al, Cui et al and Tuominen et al.7,16,40 One explanation might be that the peripheral cornea is more prone to damage because mechanical forces are more pronounced in the periphery.7 Moreover, the central cornea is far away from the limbus and benefits from immune privilege. This is remarkable in SS-DED, in which release of inflammatory mediators at the limbus or by the lacrimal gland may further induce changes in peripheral epithelial thickness.
After four weeks of treatment, ST1, TBUT, TMH, and SICCA OSS improved, suggesting that treatment with artificial tears can reestablish tear film homeostasis. Along with this, the corneal epithelium became thickened in the superior zone. These results may be interconnected with tear film improvements which provide ocular surface protection against increased blinking and higher levels of hydration, in particular in the superior epithelium, with lower epithelial damage and consequently lower SICCA OSS. On the other hand, the higher epithelial thickness may also represent the increase in tear film thickness which is not separated from epithelium by AS-OCT. OSDI score also improved after treatment, and this may be in part because of ocular surface parameters improvement but also due to epithelial recovering in thickness and integrity.
The present study also showed that in SS-DED eyes, ST1, TBUT, and TMH after treatment approximated to those of controls at baseline. Moreover, there was a difference in epithelial thickness only for the superior and supero-nasal octants. We postulate that treatment with artificial tears, although not fully, seems to control the inflammatory process behind SS-DED partially. The studies regarding the effect of artificial tears in tear film stability evaluation in aqueous deficient dry eyes are scarce. Molina-Solana et al have reported improvement in TBUT, corneal staining, and OSDI score after treatment with 0.4% hyaluronic acid.41 However, they only included idiopathic aqueous deficient dry eyes, which theoretically have a less pronounced inflammatory process.
Although Cui et al reported a correlation between ST1 and superior epithelial thickness, most studies did not find correlations between epithelial thickness and clinical measures.16 In this study, no correlations were found. In fact, ST1 has shown to be highly variable and not reliable due to the unknown contribution of reflex tearing.42
Limitations of our study are the small sample, the short-term of the observations, the fact that we only included women, and we did not include patients with SS without DED. However, SS affects women in a ratio of 9:1, and up to 90% of SS patients have DED.43,44 Despite this, we believe our results clearly illustrate the benefits of treatment in SS-DED. Although it was not the scope of our study, the epithelial thickness should be evaluated as relevant to understand the role of corneal epithelium in SS-associated dry eye as a possible biomarker of eye severity in SS-DED.
Conclusion
The present study shows that the superior corneal epithelium may be more prone to be thinned and damaged in Sjögren Syndrome associated dry eye disease. Treatment with preservative-free 1mg/1mL sodium hyaluronate (4 times a day for 4 weeks) improved ST1, TMH, TBUT, SICCA-OSS, and OSDI score, and superior epithelial thickness.
Our results seem to illustrate the morphological changes in the corneal epithelium in naïve SS dry eyes, and further investigation could recognize epithelial changes as a clinical biomarker of dry eye disease in SS.
Disclosure
Dr Renato Ambrósio Jr is a consultant for Oculus, Alcon, Zeiss, Essilor, Genom, Mediphacos.
Dr Reinstein is a consultant for Carl Zeiss Meditec (Carl Zeiss Meditec AG) and CSO Italia; has a proprietary interest in the Artemis Insight 100 technology (ArcScan, Inc) through patents administered by the Cornell Center for Technology Enterprise and Commercialization (CCTEC), Ithaca, New York. The authors report no other conflicts of interest in this work.
References
1. Lemp MA, Baudouin C, Baum J, et al. The definition and classification of dry eye disease: report of the definition and classification subcommittee of the international dry eye workShop (2007). Ocular Surface. 2007;5(2):75–92. doi:10.1016/s1542-0124(12)70081-2
2. Montés-Micó R. Role of the tear film in the optical quality of the human eye. J Cataract Refract Surg. 2007;33:1631–1635. doi:10.1016/j.jcrs.2007.06.019
3. Pflugfelder SC. Tear dysfunction and the cornea: LXVIII Edward Jackson memorial lecture. Am J Ophthalmol. 2011;152:900–909.e1. doi:10.1016/j.ajo.2011.08.023
4. Akpek EK, Klimava A, Thorne JE, et al. Evaluation of patients with dry eye for presence of underlying Sjogren syndrome. Cornea. 2009;28:493–497. doi:10.1097/ICO.0b013e31818d3846
5. Foulks GN, Forstot SL, Donshik PC, et al. Clinical guidelines for management of dry eye associated with Sjögren disease. Ocular Surface. 2015;13:118–132. doi:10.1016/j.jtos.2014.12.001
6. Prakash G, Agarwal A, Mazhari AI, et al. Reliability and reproducibility of assessment of corneal epithelial thickness by Fourier domain optical coherence tomography. Investig Ophthalmol Vis Sci. 2012;53:2580. doi:10.1167/iovs.11-8981
7. Francoz M, Karamoko I, Baudouin C, et al. Ocular surface epithelial thickness evaluation with spectral-domain optical coherence tomography. Investig Ophthalmol Vis Sci. 2011;52:9116. doi:10.1167/iovs.11-7988
8. Ma XJ, Wang L, Koch DD. Repeatability of corneal epithelial thickness measurements using Fourier-domain optical coherence tomography in normal and post-LASIK eyes. Cornea. 2013;32:1544–1548. doi:10.1097/ICO.0b013e3182a7f39d
9. Ge L, Yuan Y, Shen M, et al. The role of axial resolution of optical coherence tomography on the measurement of corneal and epithelial thicknesses. Investig Ophthalmol Vis Sci. 2013;54:746. doi:10.1167/iovs.11-9308
10. Reinstein DZ, Archer TJ, Gobbe M. Corneal epithelial thickness profile in the diagnosis of keratoconus. J Refract Surg. 2009. doi:10.3928/1081597X-20090610-06
11. Randleman JB, Woodward M, Lynn MJ, et al. Risk assessment for ectasia after corneal refractive surgery. Ophthalmology. 2008;115:37–50.e4. doi:10.1016/j.ophtha.2007.03.073
12. Ambrósio R, Dawson DG, Salomão M, et al. Corneal ectasia after LASIK despite low preoperative risk: tomographic and biomechanical findings in the unoperated, stable, fellow eye. J Refract Surg. 2010;26:906–911. doi:10.3928/1081597X-20100428-02
13. Klein SR, Epstein RJ, Randleman JB, et al. Corneal ectasia after laser in situ keratomileusis in patients without apparent preoperative risk factors. Cornea. 2006;25:388–403. doi:10.1097/01.ico.0000222479.68242.77
14. Wang J, Fonn D, Simpson TL. Topographical thickness of the epithelium and total cornea after hydrogel and PMMA contact lens wear with eye closure. Investig Ophthalmol Vis Sci. 2003. doi:10.1167/iovs.02-0343
15. Pérez JG, Méijome JMG, Jalbert I, et al. Corneal epithelial thinning profile induced by long-term wear of hydrogel lenses. Cornea. 2003;22:304–307. doi:10.1097/00003226-200305000-00005
16. Cui X, Hong J, Wang F, et al. Assessment of corneal epithelial thickness in dry eye patients. Optom Vis Sci. 2014;91:1446–1454. doi:10.1097/OPX.0000000000000417
17. Liang Q, Liang H, Liu H, et al. Ocular surface epithelial thickness evaluation in dry eye patients: clinical correlations. J Ophthalmol. 2016;2016:1–8. doi:10.1155/2016/1628469
18. Kanellopoulos AJ, Asimellis G. In vivo 3-dimensional corneal epithelial thickness mapping as an indicator of dry eye: preliminary clinical assessment. Am J Ophthalmol. 2014;157:63–68.e2. doi:10.1016/j.ajo.2013.08.025
19. Abou Shousha M, Wang J, Kontadakis G, et al. Corneal epithelial thickness profile in dry-eye disease. Eye. 2020;34:915–922. doi:10.1038/s41433-019-0592-y
20. Semeraro F, Forbice E, Nascimbeni G, et al. Effect of autologous serum eye drops in patients with Sjogren syndrome-related dry eye: clinical and in vivo confocal microscopy evaluation of the ocular surface. In Vivo. 2016;30(6):931–938. doi:10.21873/invivo.11016
21. Shiboski CH, Shiboski SC, Seror R, et al. 2016 American College of Rheumatology/European League against rheumatism classification criteria for primary Sjogren's syndrome: a consensus and data-driven methodology involving three international patient cohorts. Arthritis Rheumatol. 2017;69:35–45. doi:10.1002/art.39859
22. Whitcher JP, Shiboski CH, Shiboski SC, et al. A simplified quantitative method for assessing keratoconjunctivitis sicca from the Sjogren's syndrome international registry. Am J Ophthalmol. 2010;149:405–415. doi:10.1016/j.ajo.2009.09.013
23. Schiffman RM, Christianson MD, Jacobsen G, et al. Reliability and validity of the ocular surface disease index. Arch Ophthalmol. 2000;118:615. doi:10.1001/archopht.118.5.615
24. Hallak JA, Jassim S, Khanolkar V, et al. Symptom burden of patients with dry eye disease: a four domain analysis. PLoS One. 2013;8:e82805. doi:10.1371/journal.pone.0082805
25. Miller KL, Walt JG, Mink DR, et al. Minimal clinically important difference for the ocular surface disease index. Arch Ophthalmol. 2010;128:94. doi:10.1001/archophthalmol.2009.356
26. Craig JP, Nichols KK, Akpek EK, et al. TFOS DEWS II definition and classification report. Ocular Surface. 2017. doi:10.1016/j.jtos.2017.05.008
27. Li HF, Petroll WM, Møller-Pedersen T, et al. Epithelial and corneal thickness measurements by in vivo confocal microscopy through focusing (CMTF). Curr Eye Res. 1997;16:214–221. doi:10.1076/ceyr.16.3.214.15412
28. Reinstein DZ, Archer TJ, Gobbe M, et al. Epithelial thickness in the normal cornea: three-dimensional display with Artemis very high-frequency digital ultrasound. J Refract Surg. 2008;24:571–581.
29. Azartash K, Kwan J, Paugh JR, et al. Pre-corneal tear film thickness in humans measured with a novel technique. Mol Vis. 2011;17:756–767.
30. Chen Q, Wang J, Tao A, et al. Ultrahigh-resolution measurement by optical coherence tomography of dynamic tear film changes on contact lenses. Invest Ophthalmol Vis Sci. 2010;51:1988–1993. doi:10.1167/iovs.09-4389
31. Cui L, Wang J, Perez VL, et al. Visualization of the precorneal tear film using ultrahigh resolution optical coherence tomography in dry eye. Eye Contact Lens Sci Clin Pract. 2012;38:240–244. doi:10.1097/ICL.0b013e318257a108
32. Reinstein DZ, Silverman RH, Trokel SL, et al. Corneal Pachymetric Topography. Ophthalmology. 1994;101:432–438. doi:10.1016/S0161-6420(94)31314-5
33. Reinstein DZ, Silverman RH, Rondeau MJ, et al. Epithelial and corneal thickness measurements by high-frequency ultrasound digital signal processing. Ophthalmology. 1994;101:140–146.
34. Reinstein DZ, Yap TE, Archer TJ, et al. Comparison of corneal epithelial thickness measurement between Fourier-domain OCT and very high-frequency digital ultrasound. J Refract Surg. 2015;31:438–445. doi:10.3928/1081597X-20150623-01
35. Hashmani N, Hashmani S, Saad CM. Wide corneal epithelial mapping using an optical coherence tomography. Invest Ophthalmol Vis Sci. 2018;59:1652. doi:10.1167/iovs.17-23717
36. Reinstein DZ, Gobbe M, Archer TJ, et al. Epithelial, stromal, and total corneal thickness in keratoconus: three-dimensional display with artemis very-high frequency digital ultrasound. J Refract Surg. 2010. doi:10.3928/1081597X-20100218-01
37. Evinger C, Bin BJ, Powers AS, et al. Dry eye, blinking, and blepharospasm. Mov Disord. 2002. doi:10.1002/mds.10065
38. Fabiani C, Barabino S, Rashid S, et al. Corneal epithelial proliferation and thickness in a mouse model of dry eye. Exp Eye Res. 2009;89:166–171. doi:10.1016/j.exer.2009.03.003
39. Kanellopoulos AJ, Asimellis G. In vivo three-dimensional corneal epithelium imaging in normal eyes by anterior-segment optical coherence tomography: a clinical reference study. Cornea. 2013;32:1493–1498. doi:10.1097/ICO.0b013e3182a15cee
40. Tuominen ISJ, Konttinen YT, Vesaluoma MH, et al. Corneal innervation and morphology in primary Sjögren’s syndrome. Investig Ophthalmol Vis Sci. 2003;44:2545. doi:10.1167/iovs.02-1260
41. Molina-Solana P, Domínguez-Serrano FDB, Garrido-Hermosilla AM. Improved tear film stability in patients with dry eye after hyaluronic acid and galactoxyloglucan use. Clin Ophthalmol. 2020;14:1153–1159. doi:10.2147/OPTH.S248949
42. Clinch TE, Benedetto DA, Felberg NT, et al. Schirmer’s test: a closer look. Arch Ophthalmol. 1983;101:1383. doi:10.1001/archopht.1983.01040020385009
43. Patel R, Shahane A. The epidemiology of Sjögren’s syndrome. Clin Epidemiol. 2014;6:247–255. doi:10.2147/CLEP.S47399
44. Fernandez Castro M, Sánchez-Piedra C, Andreu JL, et al. Factors associated with severe dry eye in primary Sjögren’s syndrome diagnosed patients. Rheumatol Int. 2018;38:1075–1082. doi:10.1007/s00296-018-4013-5
 © 2023 The Author(s). This work is published and licensed by Dove Medical Press Limited. The
full terms of this license are available at https://www.dovepress.com/terms
and incorporate the Creative Commons Attribution
- Non Commercial (unported, 3.0) License.
By accessing the work you hereby accept the Terms. Non-commercial uses of the work are permitted
without any further permission from Dove Medical Press Limited, provided the work is properly
attributed. For permission for commercial use of this work, please see paragraphs 4.2 and 5 of our Terms.
© 2023 The Author(s). This work is published and licensed by Dove Medical Press Limited. The
full terms of this license are available at https://www.dovepress.com/terms
and incorporate the Creative Commons Attribution
- Non Commercial (unported, 3.0) License.
By accessing the work you hereby accept the Terms. Non-commercial uses of the work are permitted
without any further permission from Dove Medical Press Limited, provided the work is properly
attributed. For permission for commercial use of this work, please see paragraphs 4.2 and 5 of our Terms.