Back to Journals » Clinical Epidemiology » Volume 15
Controlling for Differential Regression-To-The-Mean via Propensity Scores: A Simulation Study
Authors Latour CD ![]() , McGrath LJ, Clouser M
, McGrath LJ, Clouser M ![]() , Nielson C
, Nielson C ![]() , Yu Y, Balasubramanian A, Breskin A, Brookhart MA
, Yu Y, Balasubramanian A, Breskin A, Brookhart MA ![]()
Received 7 February 2023
Accepted for publication 23 May 2023
Published 1 June 2023 Volume 2023:15 Pages 661—670
DOI https://doi.org/10.2147/CLEP.S406552
Checked for plagiarism Yes
Review by Single anonymous peer review
Peer reviewer comments 2
Editor who approved publication: Professor H Sorensen
Chase D Latour,1,2 Leah J McGrath,2 Mary Clouser,3 Carrie Nielson,3 Ying Yu,2 Akhila Balasubramanian,3 Alexander Breskin,1,2 M Alan Brookhart2,4
1Department of Epidemiology, University of North Carolina at Chapel Hill, Chapel Hill, NC, USA; 2Target RWE, Durham, NC, USA; 3Center for Observational Research, Amgen Inc., Thousand Oaks, CA, USA; 4Department of Population Health Sciences, Duke University, Durham, NC, USA
Correspondence: Chase D Latour, Department of Epidemiology, UNC Gillings School of Global Public Health, University of North Carolina at Chapel Hill, 135 Dauer Drive, 2101 McGavran-Greenberg Hall, CB #7435, Chapel Hill, NC, USA, Tel +1 765 418 2743, Email [email protected]
Purpose: Regression-to-the-mean (RTM) is a statistical phenomenon that may occur in epidemiologic studies where inclusion in the study cohort is contingent upon experiencing a laboratory/clinical measurement beyond a defined threshold. When differential across treatment groups, RTM could bias the final study estimate. This poses substantial challenges in observational studies that index patients upon experiencing extreme laboratory or clinical values. Our objective was to investigate propensity score-based methods as a tool for mitigating this source of bias via simulation.
Methods: We simulated a noninterventional comparative effectiveness study, comparing treatment with romiplostim to standard-of-care therapies for immune thrombocytopenia (ITP), a disease characterized by low platelet counts. Platelet counts were generated from normal distributions according to the underlying ITP severity, a strong confounder of treatment and outcome. Patients were assigned treatment probabilities based upon ITP severity, which created varied levels of differential and non-differential RTM. Treatments were compared via the difference in median platelet counts during 23 weeks of follow-up. We calculated four summary metrics of the platelet counts measured prior to cohort entry and built six propensity score models to adjust for those variables. We adjusted for these summary metrics using inverse probability of treatment weights.
Results: Across all simulated scenarios, propensity score adjustment reduced bias and increased precision of the treatment effect estimator. Adjusting for combinations of the summary metrics was most effective at reducing bias. Adjusting for the mean of prior platelet counts or the difference between the cohort-qualifying platelet count and the largest prior count eliminated the most bias when assessed individually.
Conclusion: These results suggest that differential RTM could be reasonably addressed by propensity score models with summaries of historical laboratory values. This approach can be easily applied to any comparative effectiveness or safety study, though investigators should carefully consider the best summary metric for their data.
Keywords: bias correction, propensity scores, real-world evidence, immune thrombocytopenia
Plain Language Summary
This study focuses on a statistical concept that can cause bias in observational studies aimed at understanding the effectiveness or safety of a drug: regression-to-the-mean (RTM) that differs across two treatment groups. RTM is based on the idea that all laboratory or clinical measures derive from some “true” underlying distribution. It states that if you randomly draw a value that is far from the mean of that distribution, the next value you draw is likely to have regressed closer to the distribution’s mean due to random chance alone. This bias is of particular concern in studies that use routinely collected healthcare data to mimic clinical trials. Trials routinely include patients at extreme clinical values that indicate that the patients are especially sick. This is not a concern in trials because treatments are randomized. However, in observational studies that use real-world data, multiple values inform a provider’s treatment recommendation. We proposed a simple method to address this problem and investigated its performance by simulating an observational study of treatments for immune thrombocytopenia. We included patients in the study upon experiencing a low platelet count and created scenarios where RTM was more and less similar by treatment status. We summarized platelet counts measured prior to study entry and statistically adjusted for these values. This approach successfully eliminated some bias caused by differential RTM across treatments. We suggest that researchers consider using this approach for future non-interventional studies of drug comparative effectiveness or safety.
Introduction
Regression-to-the-mean (RTM) states that when an extreme measure is observed, the next is likely to be closer to the true mean of the value’s distribution, regardless of intervention.1,2 This is salient in drug safety and effectiveness studies that include participants upon experiencing an extreme clinical value and evaluate an outcome that is correlated with it. In randomized trials, this should not bias a comparative effect estimate because randomization balances RTM between treatment arms.3 However, in observational studies, the magnitude of RTM may differ between treatment groups, creating bias – henceforth, we refer to this as differential RTM (by exposure). This can occur in a noninterventional study, for example, because physicians may prefer to initiate a more-aggressive treatment in patients with consistently abnormal lab values than patients with a singular abnormal value. Patients who qualified for study entry based on a singular low value are expected to regress to normal levels more often than patients with consistently low values, due to RTM. This may cause an aggressive treatment to appear less effective than the less-aggressive treatment, regardless of treatment effect.
Current methods that address differential RTM have important limitations for noninterventional studies focused on comparative drug safety and effectiveness. One proposed method requires multiple qualifying laboratory values before a patient enters a study.2,4 However, this changes the study question (eg, the effect after 2 instead of 1 qualifying value). Another method quantifies bias due to RTM2–5 but requires distributional assumptions about the outcome measure that are unreasonable in real-world data with sparsely measured laboratory-based endpoints. Some authors have suggested using a regression discontinuity design,4 but this changes the study question and requires sufficient patients with laboratory values around a cut point. Finally, other methods exist but are not applicable to studies focused on individual health outcomes.6 We are not aware of a method that 1) cleanly fits within classic pharmacoepidemiology study designs (eg, active comparator new user study)7 without 2) changing the study question.
Propensity scores (PSs) are widely used to adjust for confounding. Bias from differential RTM results from a different mechanism than confounding, but similarly impacts treatment selection. As such, PS-based adjustment methods should mitigate bias due to differential RTM in noninterventional studies by balancing RTM across treatment arms, mirroring randomization in trials. However, to our knowledge, no prior work has explored this. Previously, we observed possible evidence of differential RTM in a non-interventional, comparative effectiveness study of two treatments for immune thrombocytopenia (ITP), a chronic disease characterized by low platelet counts.8 In that study, we emulated a planned clinical trial using a treatment-decision design where treatment with romiplostim or standard of care (SOC) was determined upon experiencing one low platelet count (≤30×109/L; cohort entry date).9,10 In this work, we simulated that study and assessed PS-based methods to mitigate bias due to differential RTM.
Materials and Methods
Data Generation
Patient data were generated in two stages. First, weekly platelet counts were generated based upon patients’ ITP severity stratum (ie, more- vs less-severe), with each characterized by a different platelet count distribution. Second, treatment (vs SOC) was assigned to patients based upon their ITP severity to introduce differential and non-differential RTM (Figure 1).
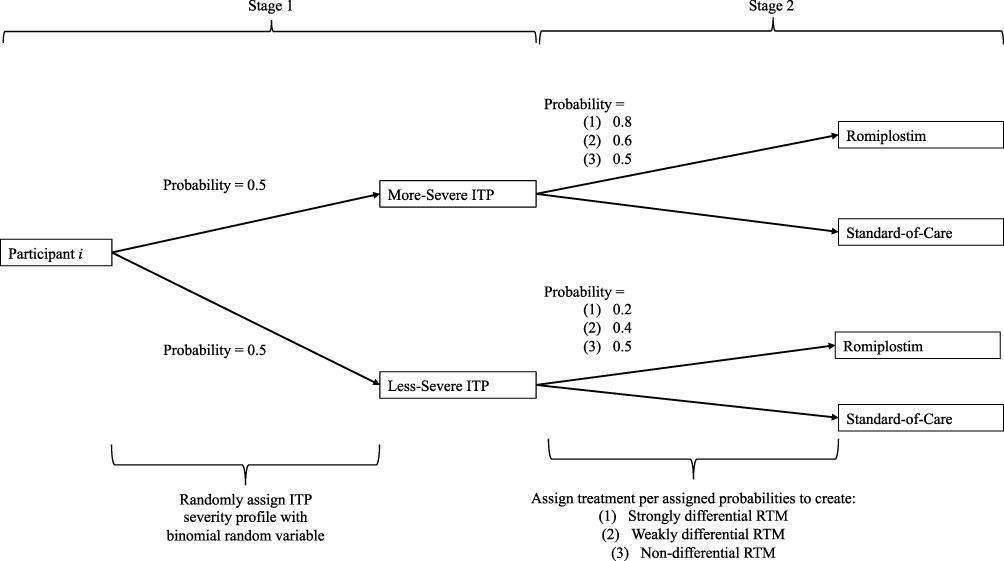 |
Figure 1 Schematic depicting the two-stage data generation process for the ith participant of the n total participants. In the first stage, each participant is randomly assigned to have more- or less-severe immune thrombocytopenia (ITP) with a probability of 0.5. A normal distribution is assigned to each severity profile a priori for generating patient platelet counts. In the second stage, the patient is then assigned to treatment or standard of care using one of three provided probabilities based upon their ITP severity strata to make the regression-to-the-mean (RTM) strongly, weakly, or non-differential by treatment. |
We randomly assigned patients to have “more-severe” or “less-severe” ITP with a probability of 0.5. Two-hundred platelet counts were generated for each patient from normal distributions, with an ITP severity-specific mean and standard deviation (SD). More-severe ITP had a lower mean and SD than less-severe ITP. We considered two parameterizations, which mirrored our real-world study:8
RTM in platelet counts was induced by including individuals in the cohort at their first platelet count ≤30×109/L that occurred after ≥8 platelet count measurements (ie, cohort entry event). The platelet count measured 1 week after treatment or SOC initiation was the index. We recorded the 23 subsequent platelet counts (Supplemental Figure 1).
Treatment was randomly assigned by a patient’s ITP severity to make RTM strongly, weakly, or not differential by treatment. For strongly differential RTM, individuals with more-severe ITP had a 0.8 probability of treatment. This probability was 0.2 for patients with less-severe ITP. The same pattern for weakly differential RTM was 0.6 and 0.4. Non-differential RTM had 0.5 for both.
We defined 6 core scenarios by strength of differential RTM and degree of separation between platelet distributions (Supplemental Figure 2; Supplemental Tables 1 and 2). To explore finite sample properties, we additionally considered two sample sizes – 200 and 10,000 – and a null and non-null treatment effect (created by adding 0×109/L or 50×109/L, respectively, to all treated, post-index platelet counts). Thus, we examined 24 scenarios and simulated 2000 cohorts for each. Justification for each specification is provided in Supplemental Methods 1.
Analysis
We included summary measures of the 8 platelet counts measured prior to cohort entry in the PS analytic model (Supplemental Figure 1). We considered four individual measures – 1) mean, 2) SD, 3) difference between the most recent prior count and the cohort entry event (“most recent platelet difference”), and 4) difference between the largest prior count and the cohort entry event (“largest prior platelet difference”) – and two combinations – (1) The mean and SD and (2) All four measures.
Logistic regression was used to estimate PSs for treatment (Supplemental Methods 2). We estimated six models (four individual measures and two combinations) with the summary metrics as continuous, linear variables. Further, we calculated 1 PS model using the true, underlying ITP severity strata as the explanatory variable: the “gold standard” estimator. This assessed the ability of PS-based methods to adjust for bias due to differential RTM when the mechanism making RTM differential was perfectly measured. Finally, these methods were compared to unadjusted analyses (ie, PS equals 1 for all individuals) to quantify the change in absolute bias after adjustment.
The causal parameter of interest was the difference in the median follow-up platelet counts between the two treatment groups (Supplemental Methods 3). The median platelet count for each group was calculated using the 23 post-index platelet counts. We used inverse probability of treatment weighting to adjust for PSs.11–13 We summarized method performance across the 2000 simulations by calculating the bias (with 95% confidence intervals), empirical standard error, and mean-squared error (Supplemental Methods 4).14
Results
About half of patients were allocated to each ITP severity group. The proportion treated matched the probabilities for strongly, weakly, or not differential RTM (Supplemental Table 2). Platelet counts measured prior to cohort entry were, on average, higher than those measured after (Supplemental Tables 3–6), reflecting that most platelet counts prior to cohort entry were >30×109/L by design. Residual bias was highest when RTM was strongly differential and platelet count distributions were disparate by ITP severity (eg, Scenario B2). Similarly, the smallest residual bias occurred when RTM was weakly differential and the ITP severity-specific platelet count distributions were similar (eg, Scenario B3). Residual bias was not meaningful in scenarios with non-differential RTM.
In all scenarios, PS adjustment led to lower empirical standard errors. Adjusting for “gold standard” PSs eliminated residual bias across scenarios. Adjusting for both the mean and standard deviation or simultaneous adjustment for all four metrics consistently eliminated the most bias of the summary measures (range: 80–84% decrease in absolute bias, compared to unadjusted analyses, across all scenarios with differential RTM in Table 1 [see Supplemental Tables 7–9 for others]). Adjusting for each metric individually eliminated the least. Their rank ordering, by residual bias, was consistent across all scenarios with differential RTM. From least to most, these were: (1) Mean of the prior counts (range: 77–79% decrease in absolute bias across all scenarios with differential RTM in Table 1), (2) Largest prior platelet difference (66–77%), (3) SD of the prior counts (45–60%), and (4) Most recent platelet difference (25–33%). These results held regardless of true treatment effect.
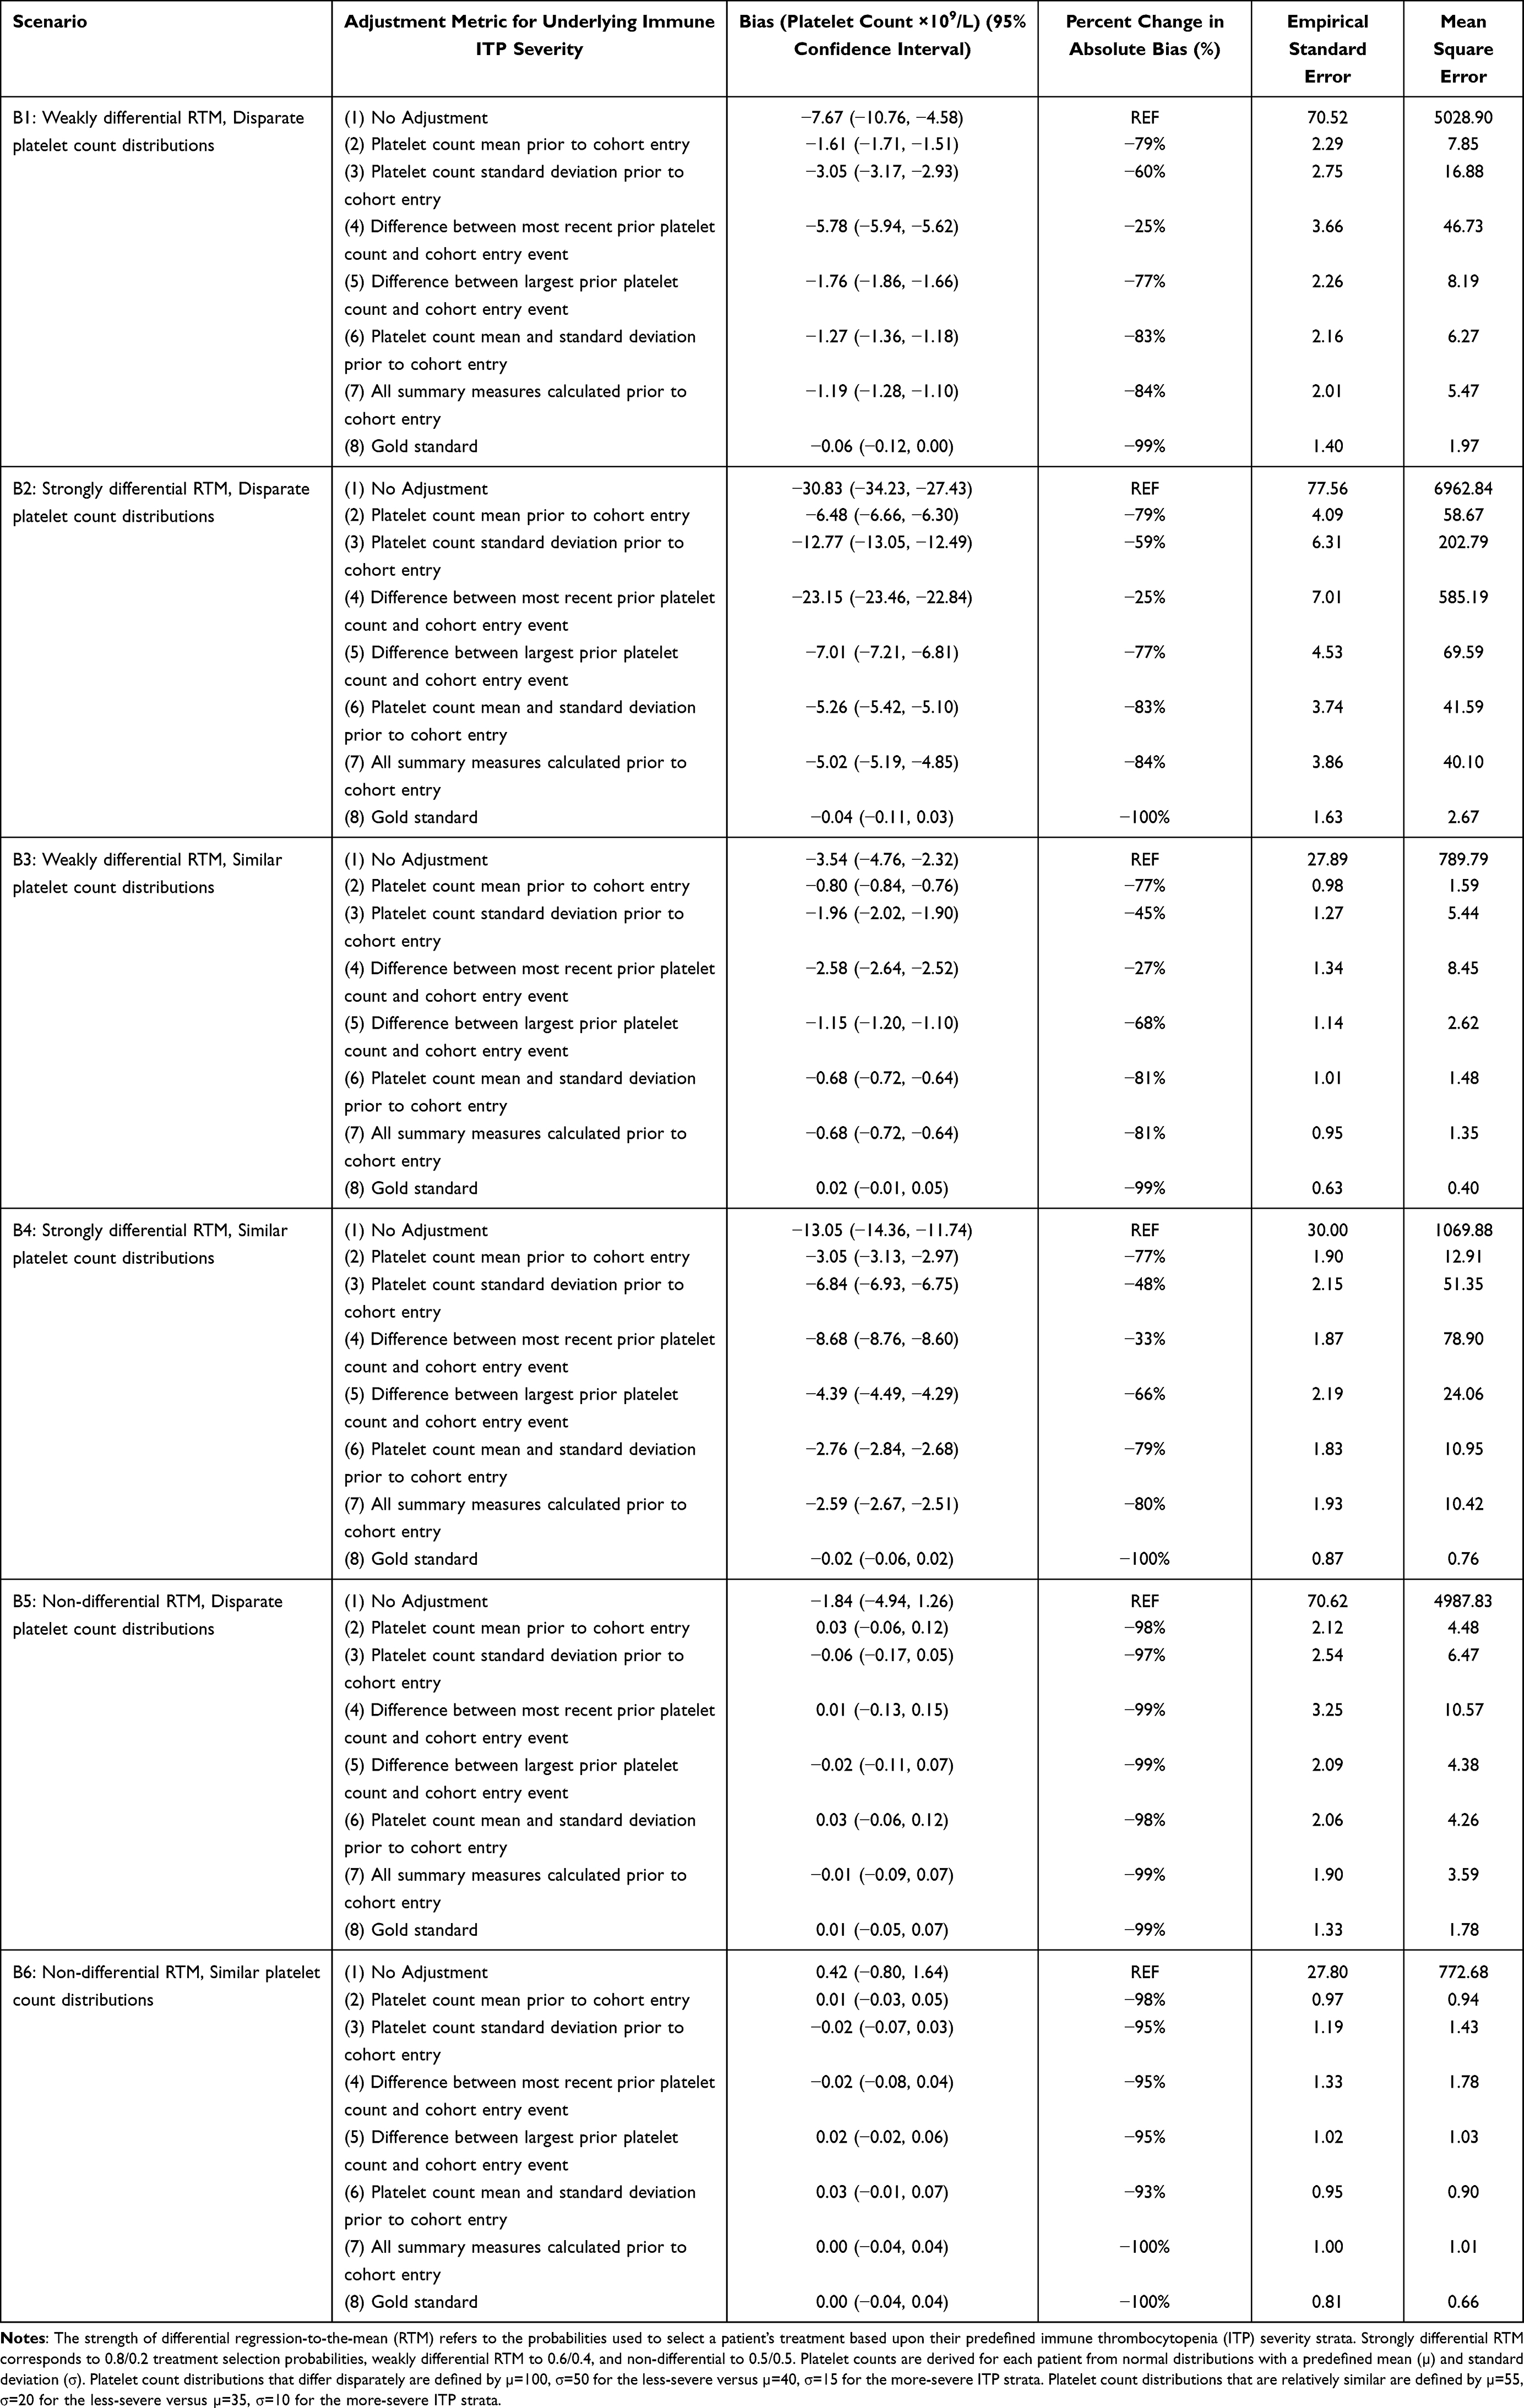 |
Table 1 Simulation Performance Measures for the Difference in Median Platelet Count Over the Two Treatment Groups Across All the Scenarios with n = 200 and a True Null Treatment Effect. Measures Were Calculated Over 2000 Simulated Cohorts for Each Scenario |
As an example, we consider Scenario B2 (strongly differential RTM, disparate platelet count distributions) with a null treatment effect (Figure 2, see Supplemental Figures 3–7 for other scenarios). In the unadjusted analysis, residual bias was −30.83×10⁹/L (95% CI: −34.23, −27.43) platelets. There was substantially less residual bias once we adjusted for both the mean and SD or all summary metrics: −5.26×10⁹/L (−5.42, −5.10) and −5.02×10⁹/L (−5.19, −4.85), respectively. Finally, adjusting for the “gold standard” PSs resulted in non-significant residual bias: −0.04×10⁹/L (−0.11, 0.03).
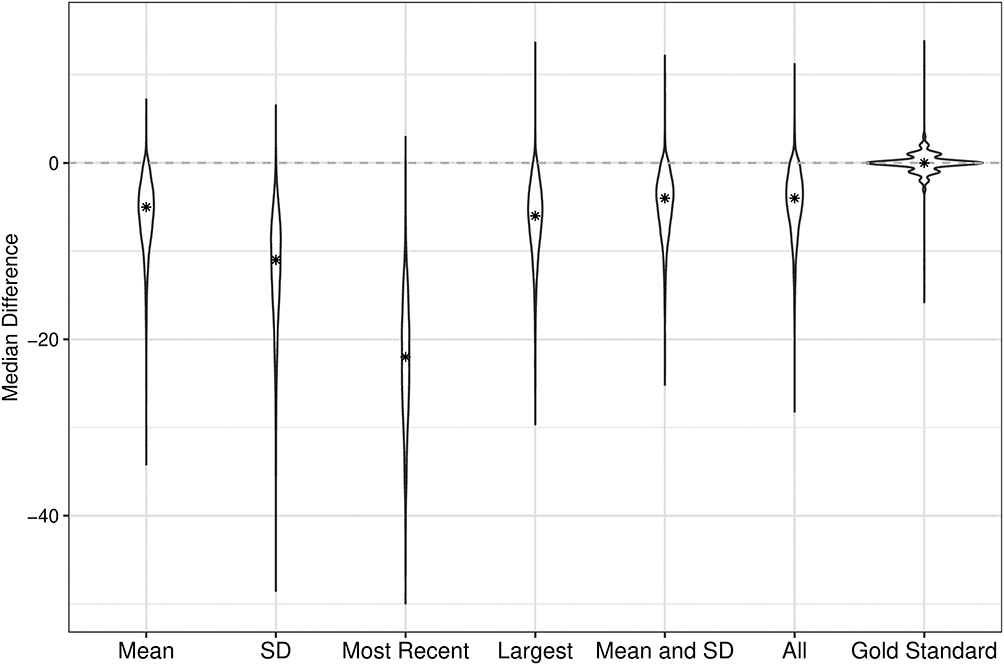 |
Figure 2 Violin plot depicting the adjusted and unadjusted difference in median platelet count between treatment groups for scenario B2, where RTM is strongly differential (0.8/0.2 probability of treatment/standard-of-care in the severe ITP group), and the platelet distributions differ disparately by underlying immune thrombocytopenia (ITP) severity (ie, µ=100 and σ=50 for less-severe ITP versus µ=40 and σ=15 for more-severe ITP). The true change in median platelet count is null, and the initial sample size is n=200. The star indicates the median of the differences between the two treatment groups’ median follow-up platelet counts. Abbreviation: SD, Standard Deviation. |
Scenarios with 10,000 patients yielded more-similar performance results between the null and non-null effects than scenarios with 200 patients, reflecting possible small sample bias in the median platelet count estimator.
Discussion
We simulated a non-interventional comparative effectiveness study of two treatments for ITP. When the selection mechanism inducing differential RTM (ie, ITP severity strata) was identified, PS adjustment eliminated residual bias. The summary metrics (eg, mean, SD) removed increasingly less residual bias; adjusting for more than one summary metric removed the most. These results indicate that PS-based methods are effective at mitigating bias due to differential RTM in non-interventional comparative studies.
To our knowledge, this is the first study to explore the use of PSs to address bias due to differential RTM in noninterventional studies of drug effectiveness and safety. As discussed, current methods have substantial limitations.2–6 They necessitate either changing a study’s question, making strong distributional assumptions about outcome values, or implementing a different study design. PSs, on the other hand, allow investigators to preserve their original study question, complement commonly used approaches (eg, IPTW) for confounding control, and can be applied to multiple study designs. Relatedly, future work should consider if these PS models could be extended to include important covariates and thus simultaneously control for confounding.
This simulation can inform future implementation of these PS-based methods. Most critically, we demonstrated that PS-based methods recover the most bias from differential RTM when the mechanism making RTM differential is perfectly measured. This is not surprising; however, the rank ordering of adjustment metrics found in this study are likely not universal but instead depend upon the underlying data generating mechanism. Researchers should critically assess what metric would be most appropriate in their data. We also found that PS-based adjustment resulted in increased effect estimate precision. Indeed, this aligns with prior findings that PS adjustment for predictors of the outcome improves precision.15 Finally, we have shown that these proposed methods were less effective in small populations, and, although expected, this bias is an issue regardless of whether there is a treatment effect.
Limitations of this study should be noted. Most clearly, our simulated cohort is a simplified version of real-world data. For example, ITP severity drove treatment decisions in the simulation, which is unknown in real data, and was a dichotomous variable. We chose this because provider treatment decisions are driven by unobservable prognostic factors, and we could not reflect the full spectrum of ITP severity. Further, analytic concerns are more complicated outside of our simulation.8 For example, every individual in our simulation had the same number of laboratory values recorded prior to cohort entry. These simplifications made this simulation tractable for illustration.
Bias due to differential RTM is an important concern in noninterventional studies of treatments on biomarker outcomes when inclusion in the study is dependent on subjects having extreme values of those same biomarkers. Failure to account for differential RTM will produce biased results, potentially making a more-aggressive therapy appear less effective than it is.2,3 This could turn patients and stakeholders away from important medical treatments. We have shown that PS adjustment with appropriately specified models can be an effective approach to reduce bias due to differential RTM.
Conclusion
We found the use of PS-based methods to be effective at mitigating bias due to differential RTM in noninterventional studies. This approach fits easily within standard comparative drug effectiveness and safety studies and should be integrated into future research. PS-based methods work best when investigators can adequately capture the mechanism causing RTM to be differential by treatment.
Abbreviation
ITP, immune thrombocytopenia; L, liter; RTM, regression-to-the-mean; SD, standard deviation; SOC, standard of care.
Data Sharing Statement
Data for this study were generated using R statistical software. The code used to generate these data and run analyses can be found on GitHub (https://github.com/chasedlatour/DifferentialRTM).
Ethics Approval and Informed Consent
All data presented in this article were simulated. No data from real individuals were accessed for the analyses presented herein. As such, these analyses do not require approval by an Institutional Review Board.
Consent for Publication
All materials submitted with this publication have been reviewed by the authors – we consent to these being published with the manuscript.
Funding
This work was supported by funding from Amgen Inc. who had the right of commenting on this work. Authors retained the right to accept or reject these comments.
Disclosure
CDL received salary for her work on the project from Target RWE, through funding from Amgen Inc. She further has been paid by Amgen as a guest speaker. LJM was an employee and owned equity in Target RWE for most of the project. LJM is currently an employee for Pfizer Inc. MC is an employee and owns stock in Amgen Inc. The same was true of CN during the course of this work; CN is currently an employee of Gilead Sciences. YY is an employee of and owns equity in Target RWE. ABa is an employee and holds stock in Amgen Inc. ABr was an employee and owned equity in Target RWE for most of the project. ABr is currently an employee for Regeneron Pharmaceuticals. MAB owns equity and received consulting fees from Target RWE. In the past 18 months, he has served as a scientific advisor for AbbVie, American Academy of Allergy, Asthma & Immunology, Amgen, Astellas/Seagan, Atara Biosciences, BlueCross BlueShield North Carolina, Brigham and Women’s Hospital, Gilead / Kite, Merck, NIDDK and Vertex; owns equity from AccompanyHealth and Vertex.
References
1. Bland JM, Altman DG. Regression towards the mean. BMJ. 1994;308(6942):1499. doi:10.1136/bmj.308.6942.1499
2. Barnett AG, van der Pols JC, Dobson AJ. Regression to the mean: what it is and how to deal with it. Int J Epidemiol. 2005;34(1):215–220. doi:10.1093/ije/dyh299
3. Chambless LE, Roeback JR. Methods for assessing difference between groups in change when initial measurement is subject to intra-individual variation. Stat Med. 1993;12(13):1213–1237. doi:10.1002/sim.4780121304
4. Linden A. Assessing regression to the mean effects in health care initiatives. BMC Med Res Methodol. 2013;13(1):1. doi:10.1186/1471-2288-13-119
5. Senn S, Brown R. Maximum likelihood estimation of treatment effects for samples subject to regression to the mean. Commun Stat Theory Methods. 1989;18(9):3389–3406. doi:10.1080/03610928908830099
6. Illenberger N, Small DS, Shaw PA. Impact of regression to the mean on the synthetic control method. Epidemiology. 2020;31(6):815–822. doi:10.1097/ede.0000000000001252
7. Lund JL, Richardson DB, Stürmer T. The active comparator, new user study design in pharmacoepidemiology: historical foundations and contemporary application. Curr Epidemiol Rep. 2015;2(4):221–228. doi:10.1007/s40471-015-0053-5
8. McGrath L, Nielson C, Saul B, et al. Lessons learned using real-world data to emulate randomized trials-a case study of treatment effectiveness for newly diagnosed immune thrombocytopenia. Clin Pharmacol Ther. 2021;110(6):1570–1578. doi:10.1002/cpt.2399
9. Brookhart MA. Counterpoint: the treatment decision design. Am J Epidemiol. 2015;182(10):840–845. doi:10.1093/aje/kwv214
10. Hernán MA, Robins JM. Using big data to emulate a target trial when a randomized trial is not available: table 1. Am J Epidemiol. 2016;183(8):758–764. doi:10.1093/aje/kwv254
11. Stürmer T, Wyss R, Glynn RJ, Brookhart MA. Propensity scores for confounder adjustment when assessing the effects of medical interventions using nonexperimental study designs. J Intern Med. 2014;275(6):570–580. doi:10.1111/joim.12197
12. Yang JY, Webster-Clark M, Lund JL, Sandler RS, Dellon ES, Stürmer T. Propensity score methods to control for confounding in observational cohort studies: a statistical primer and application to endoscopy research. Gastrointest Endosc. 2019;90(3):360–369. doi:10.1016/j.gie.2019.04.236
13. Brookhart MA, Wyss R, Layton JB, Stürmer T. Propensity score methods for confounding control in nonexperimental research. Circ Cardiovasc Qual Outcomes. 2013;6(5):604–611. doi:10.1161/CIRCOUTCOMES.113.000359
14. Morris TP, White IR, Crowther MJ. Using simulation studies to evaluate statistical methods. Stat Med. 2019;38(11):2074–2102. doi:10.1002/sim.8086
15. Brookhart MA, Schneeweiss S, Rothman KJ, Glynn RJ, Avorn J, Stürmer T. Variable selection for propensity score models. Am J Epidemiol. 2006;163(12):1149–1156. doi:10.1093/aje/kwj149
 © 2023 The Author(s). This work is published and licensed by Dove Medical Press Limited. The
full terms of this license are available at https://www.dovepress.com/terms
and incorporate the Creative Commons Attribution
- Non Commercial (unported, 3.0) License.
By accessing the work you hereby accept the Terms. Non-commercial uses of the work are permitted
without any further permission from Dove Medical Press Limited, provided the work is properly
attributed. For permission for commercial use of this work, please see paragraphs 4.2 and 5 of our Terms.
© 2023 The Author(s). This work is published and licensed by Dove Medical Press Limited. The
full terms of this license are available at https://www.dovepress.com/terms
and incorporate the Creative Commons Attribution
- Non Commercial (unported, 3.0) License.
By accessing the work you hereby accept the Terms. Non-commercial uses of the work are permitted
without any further permission from Dove Medical Press Limited, provided the work is properly
attributed. For permission for commercial use of this work, please see paragraphs 4.2 and 5 of our Terms.