Back to Journals » Clinical Ophthalmology » Volume 16
Contrast Sensitivity Testing in Age-Related Macular Degeneration Using Motion Diamond Stimulus
Authors Maganti N, Squires N, Mishra S, Bomdica P ![]() , Nigam D, Shapiro A, Gill MK
, Nigam D, Shapiro A, Gill MK ![]() , Lyon AT, Mirza RG
, Lyon AT, Mirza RG ![]()
Received 2 October 2021
Accepted for publication 14 January 2022
Published 25 February 2022 Volume 2022:16 Pages 507—515
DOI https://doi.org/10.2147/OPTH.S342188
Checked for plagiarism Yes
Review by Single anonymous peer review
Peer reviewer comments 3
Editor who approved publication: Dr Scott Fraser
Nenita Maganti,1 Natalie Squires,1 Shubhendu Mishra,1 Prithvi Bomdica,1 Divya Nigam,2 Arthur Shapiro,2 Manjot K Gill,1 Alice T Lyon,1 Rukhsana G Mirza1
1Department of Ophthalmology, Northwestern University, Chicago, IL, USA; 2Department of Psychology and Department of Computer Science, American University, Washington, DC, USA
Correspondence: Rukhsana G Mirza, Department of Ophthalmology, Northwestern University, Chicago, IL, USA, Tel +1 312-908-8152, Email [email protected]
Purpose: This study was performed to characterize changes in contrast sensitivity (CS) that occur in patients with age-related macular degeneration (AMD) using a novel test, the motion diamond stimulus (MDS).
Methods: This was a cross-sectional study in which 20 subjects with unilateral exudative AMD (eAMD) and contralateral dry AMD received 3 assessments: the Pelli-Robson (PR) CS Chart, the MDS test, and a visual function questionnaire-25 (VFQ-25). CS results from the PR, and MDS tests were compared across 3 groups: eyes with eAMD vs dry AMD, eAMD vs control, dry AMD vs control. Healthy, undilated eyes from another study served as the control group. Significance was determined using ANOVA analysis for the MDS output parameters (α: overall contrast threshold, β: adaptability of the visual system) and PR logCS. Patients were also administered the VFQ-25 to assess vision-related quality of life.
Results: The ANOVA of the MDS data demonstrated a significant difference in visual function according to the β parameter of the 3 groups, but no significant difference in the α parameter. PR CS results for the 3 groups were significantly different, further supporting the MDS results. Post-hoc analysis showed a significant difference in β and PR log CS between the eAMD and control eyes.
Conclusion: The MDS test is valuable in discerning CS impairments in patients with AMD. It can provide further insight into the visual changes experienced by patients with AMD and has potential to quantify visual function changes that are not found on visual acuity testing alone.
Keywords: age-related macular degeneration, AMD, motion diamond stimulus, MDS, contrast sensitivity, CS
Introduction
Age-related macular degeneration (AMD) is the leading cause of irreversible vision loss above the age of 60.1 Active neovascularization differentiates exudative (wet) AMD from non-exudative (dry) AMD, and both types can impact visual function and vision-related quality of life.2 The number of people with AMD globally is expected to be nearly 300 million by 2040.1 Exudative AMD (eAMD) accounts for 10–15% of the overall prevalence of AMD, but is responsible for 80% of cases of severe vision loss from AMD.3 The introduction of anti-vascular endothelial growth factor (anti-VEGF) therapies to control neovascularization has resulted in visual acuity gains or stabilization in eAMD.4,5
Physicians clinically monitor the progression of AMD via three modalities: funduscopic examination, optical coherence tomography (OCT), and Snellen chart visual acuity. Visual acuity is the standard for visual function, yet, it focuses solely on resolution of letters displayed at high contrasts. Additionally, best-corrected visual acuity (BCVA) is maintained in early AMD; therefore, this does not offer valuable insight on disease progression until late stages.6 Visual acuity is only one aspect of an individual’s overall visual function. Clinicians and scientists widely agree that such tests do not precisely predict visual function required for activities of daily living.7 Alternative methods of assessing visual function, including quality of life questionnaires, were designed for populations with significant vision loss and poorly discriminate between individuals until late-stage AMD.8 Therefore, additional tools are required to accurately assess visual function across all stages of AMD, especially the early stages.
Contrast sensitivity (CS) is widely accepted as a critical aspect of visual function and has been shown to correlate with ability to perform instrumental activities of daily living, including reading a newspaper and finding objects in a room.9 CS is not routinely monitored in clinical practice.10 In patients with AMD, an array of CS scores is found at a given level of visual acuity.11 Additionally, variable levels of visual acuity have no impact on detecting products, faces, or colors when controlling for contrast sensitivity.12 CS was reported to be the best predictor of computer task performance over visual acuity, visual field, and color vision testing.13 Recent studies also report that binocular CS has a stronger correlation with vision-related quality of life than high contrast visual acuity.14 Together, these studies demonstrate the utility of CS measures in patients with visual impairment due to AMD. However, there are little data on whether differences in CS exist between exudative and non-exudative AMD.
The gold-standard Pelli-Robson CS chart is the most widely used CS assessment in research since it was established in 1988.15 However, its use in clinical practice has been limited. Its reliability has been called into question due to misreporting rates and standard deviation in results.16 The motion diamond stimulus (MDS) is a novel digital tool developed at American University for assessing CS.17 It utilizes a stationary diamond that creates an illusion of unidirectional movement.18 Given that the motion of the diamond is generated solely by changes in contrast, the dynamic nature of the test, and opportunity to make changes to the testing program to better identify small changes to CS, the MDS test has the potential to be a valuable tool for measures of spatial contrast, temporal contrast, and contrast gain.
This study assessed CS in patients with AMD using the Pelli-Robson CS Chart and the MDS assessment. Patients with good visual acuity in both eyes treated with anti-VEGF for eAMD in one eye and dry AMD in the other were studied. We hypothesized that the MDS would detect visual impairment in the eAMD eye that could not be characterized by visual acuity alone.
Methods
This cross-sectional study examined 20 patients with unilateral eAMD receiving intravitreal injections and treatment at Northwestern Memorial Hospital. The protocol was approved by the institutional review board at Northwestern University and adhered to the Declaration of Helsinki. All patients provided informed consent before participation in the study.
Patients were recruited between December 2018 and July 2019 from the retina clinic at Northwestern. Participants over 18 years, with BCVA of 20/40 or better in both eyes and symmetric cataract grading no greater than 2+ nuclear sclerosis in both eyes, were considered for the study. Patients with good visual acuity were recruited to reduce the chance of acuity causing difficulty in taking the MDS test. In addition, patients that had a diagnosis, previously determined by their ophthalmologist, of eAMD in one eye and dry AMD in the other eye were invited to participate in this study so the differences in contrast between the two disease states could be studied. Exclusion criteria included BCVA worse than 20/40 in either eye, asymmetric cataracts, and other retinal conditions including diabetic retinopathy, retinal vein or artery occlusions, macular hole, retinal detachment or tear, and epiretinal membrane. Patients who met these criteria were invited to participate in the study, and informed consent was obtained by a team member.
Patients underwent three assessments during their study visit: the Pelli-Robson, the MDS assessment, and the National Eye Institute’s visual function questionnaire-25 (VFQ-25). Patients were undilated for the duration of the assessments.
The Pelli-Robson CS chart assessment was conducted first, one eye at a time, using a standard eye occluder. A patient’s right eye was tested first, followed by the left eye in a well-lit room. The chart was placed 1 meter away from the patient, and the patient was asked to read the lowest line they could see with their right eye and then asked to read the lowest line they could see with their left eye backwards. Patients used their corrective lenses for this test. The log CS score for each eye was gathered as one of the study endpoints.
The MDS assessment followed the Pelli-Robson chart test. The MDS test was displayed on a monitor set at 100% brightness, and the laptop used to administer the test was kept at 30% brightness to minimize any ambient light. The test was performed in a dark room with the display at a distance of 50cm from the patient’s eyes. All patients were adapted to indoor lighting conditions for at least 30 minutes prior to starting the MDS assessment. A portable photometer was used to measure the ambient luminance in the testing room as perceived by the patient in these testing conditions. The luminance of the display monitor was also measured. The ambient luminance of the testing environment ranged from 1 to 4 Lux and the luminance of the display screen ranged from 24 to 39 Lux for all 20 study visits. The test was administered to the eye with dry AMD followed by the eye with eAMD eye for the first 10 patients. The order of testing was reversed for the following 10 patients only for the MDS test. This was done to account for any learning bias that might occur with the MDS test. Each eye was tested individually, with the other eye being patched. Patients were given the option to use or not use their corrective lenses for the MDS test. This option was provided to help with patient comfort and best view of the screen given the test was designed to be administered at an intermediate distance, on a computer screen, and in a dark room. While taking the assessment, patients were not given any indication on whether they were reading the directions of the diamonds accurately or not. On completion of the MDS test, the output obtained was 8 contrast threshold values. One value for each of the 4 contrast modulation ratios at edge-widths of 3 and 6. These served as the endpoints for the MDS assessment.
Lastly, patients completed the VFQ-25 questionnaire which served as the endpoint for patient-reported overall visual health. Following these assessments, no additional study-related follow-up was done or required by the patients. Patients had visual acuity, IOP, and OCT as part of their clinical visit and this data was obtained through the electronic health record for the study.
A similar MDS study was conducted on 20 healthy eyes (Squires et al, in submission), ie, eyes with vision 20/30 or better, minimal cataracts, and without any macular pathology. The MDS test was conducted on eyes pre-dilation and post-dilation. The undilated eyes are referred to as controls from hereon and are used in this study to compare to the eyes with dry AMD and eAMD.
Statistical Analysis
Microsoft Excel and R (version 2.2.1) were used for all the statistical analyses. Table 1 displays this study population’s characteristics as means with the sample standard deviation.
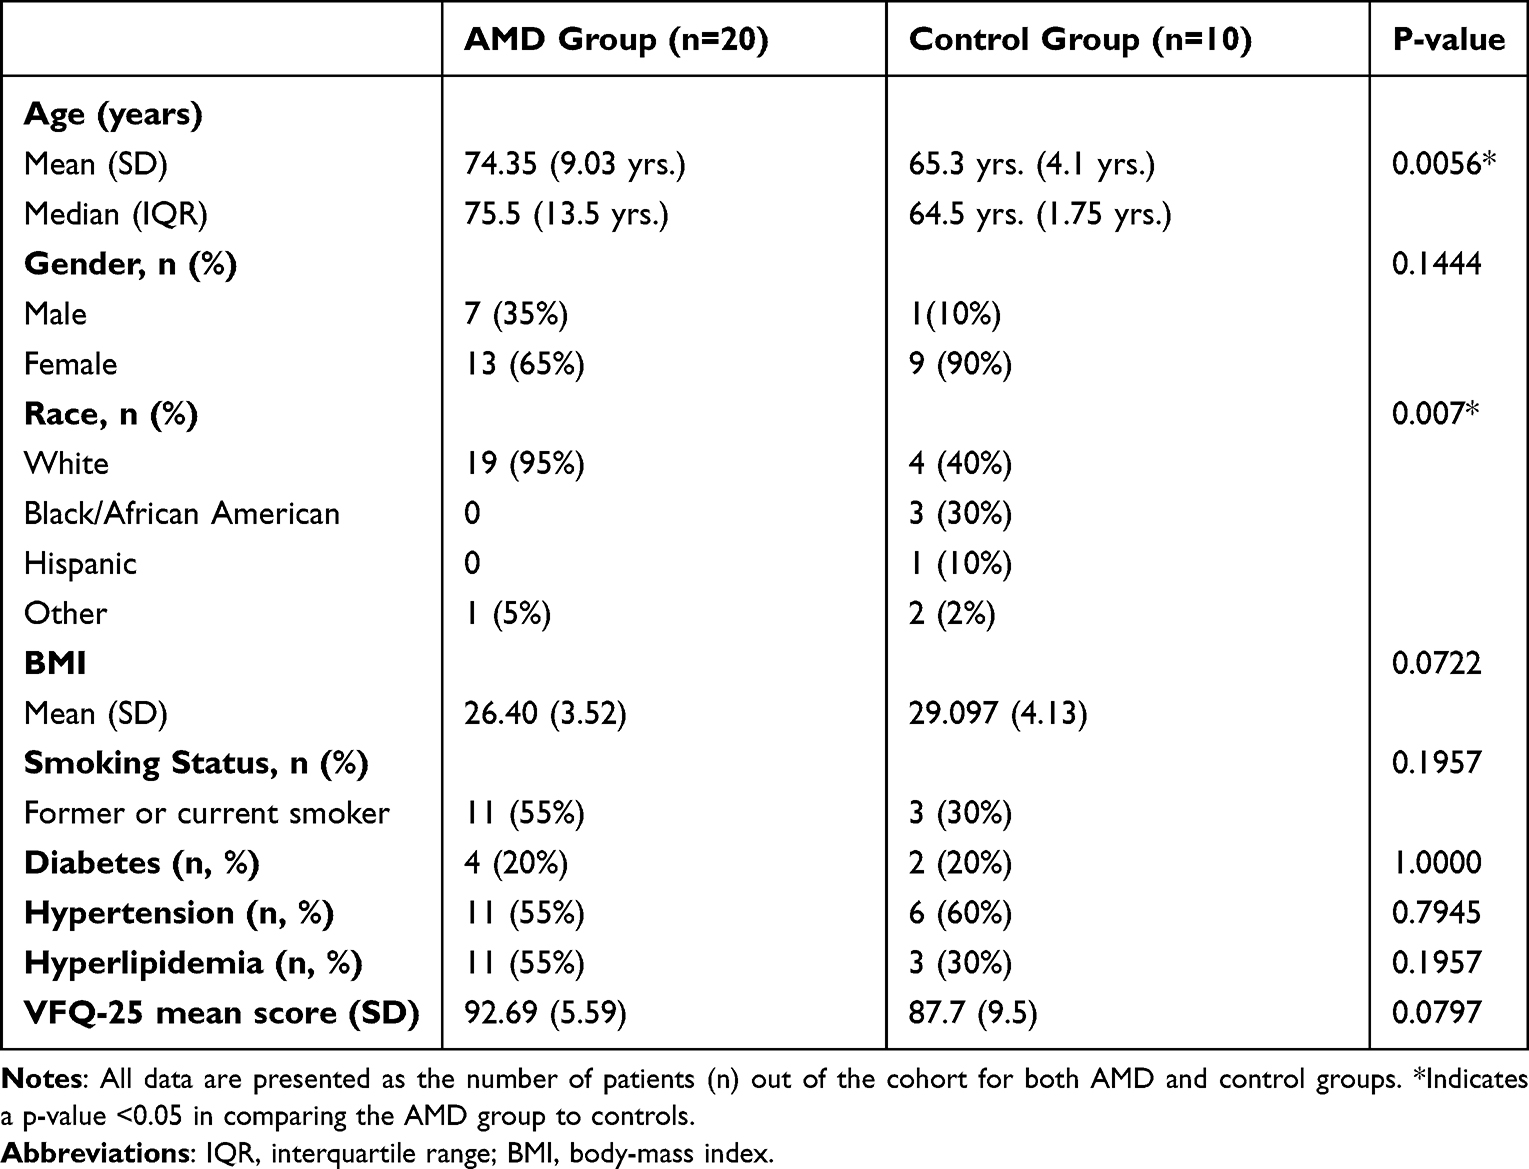 |
Table 1 Patient Demographics and Baseline Characteristics |
Baseline differences were established among 3 sets of eyes: eAMD, dry AMD, and controls (n = 20 for each set) in Table 2. ANOVA or a 2-sample t-test was utilized to establish differences among the 3 sets for quantitative descriptive characteristics (LogMAR BCVA, intraocular pressure (IOP), and central foveal thickness (CFT) established via OCT imaging). Table 2 also displays characteristics of the eyes with eAMD and dry AMD at two different time points—the patient’s initial eAMD diagnosis date at Northwestern’s ophthalmology clinic and the visit most recent to the MDS assessment. It delineates how the AMD eyes have changed throughout the patients’ treatments. The differences between the initial and most recent visits for these sets of eyes were established using paired t-testing.
 |
Table 2 Ocular Comparison of eAMD and Dry AMD Eyes Between Initial Presentation and MDS Study Visit |
MDS data endpoints for each patient were plotted as two separate graphs in Figure 1, one for each edge-width, with contrast modulation ratio as the x-axis and contrast threshold as the y-axis. Next, an exponential best-fit curve was calculated for each graph using Excel’s GROWTH function, y = αeβx, where α corresponds to the threshold level of the curve and β corresponds to the slope of the curve as a function of contrast ratio. Once the α and β values were determined for each patient, the eAMD eye data were compared to the dry AMD and control eyes using ANOVA analysis for variables α, β, as well as the Pelli-Robson log CS output values. Table 3 displays the aforementioned ANOVA analysis.
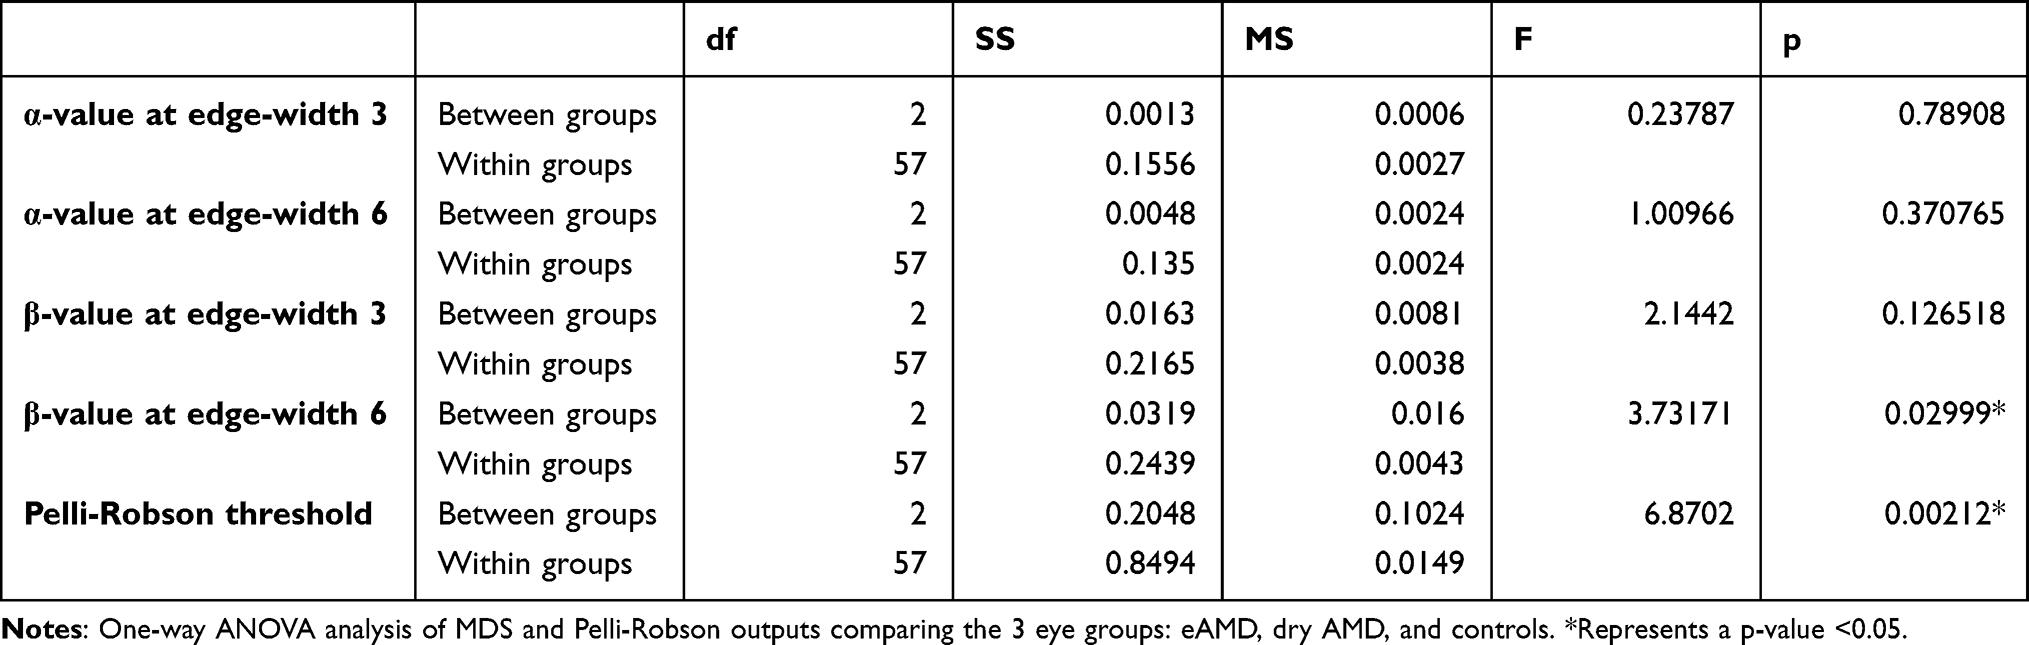 |
Table 3 ANOVA Analysis of MDS & Pelli-Robson Outputs Comparing eAMD, Dry AMD, and Controls |
 |
Figure 1 Comparison of average contrast sensitivity thresholds (y-axis) as a function of contrast modulation ratio (x-axis) for all three groups of eyes: exudative age-related macular degeneration (eAMD), dry AMD, and controls. Threshold values are plotted in a logarithmic fashion and inversely on the y-axis. ie, performance decreases at increased contrast modulation ratios. The dots represent four contrast modulation ratios. The best-fit lines represented are exponentially fitted regressions using Excel’s GROWTH function. |
The NEI VFQ-25 scores were calculated according to published guidelines.19
Results
Twenty patients were included in the analysis to make up a total of 20 eyes with eAMD receiving anti-VEGF treatment and 20 eyes with dry AMD receiving no anti-VEGF treatment. The AMD patient cohort was 65% female, 95% Caucasian, and was 74.4 years old on average at the time of enrollment. Table 1 outlines the demographic data in detail.
Demographic data for a control cohort (n = 20 eyes) obtained from a previous study conducted by Squires et al are also included in Table 1. Patients were 90% female, 40% Caucasian, and 65.3 years old on average at the time of enrollment.
A significant difference was found between the average age of the AMD group compared to the control group (p-value = 0.0056), whereas no significant difference was found in body mass index between the two groups (p-value = 0.0722).
Chi-square analysis demonstrated a significant difference in race distribution between the AMD and control groups (p-value = 0.007). No other significant differences were observed in demographic characteristics between the two groups.
Characteristics of the Eyes with eAMD, Dry AMD, and Controls
The mean logMAR BCVA and IOP for the 3 groups of eyes at the MDS assessment were compared using ANOVA analysis. ANOVA analysis demonstrated a significant difference between the mean logMAR BCVAs of the 3 groups of eyes (p-value = 0.0143). However, no significant differences were observed when comparing the mean IOP values among the 3 groups. Additionally, no significant difference was observed in CFT between the eAMD and dry AMD eyes.
Baseline comparisons were performed to compare the ocular characteristics of the eyes with AMD from their first visit (for eAMD, this is the time of first anti-VEGF injection) to the time when they took the MDS assessment (shown in Table 2). The average time between the first visit and the MDS visit in the eyes with exudative and dry AMD was 40 months (± 36 SD). There was a significant difference (p-value = 0.013) in the mean logMAR BCVA from the first visit (mean = 0.258 ± 0.22) to the MDS visit (mean = 0.115 ± 0.11) in the eyes with eAMD. There was also a significant difference (p-value = 0.003) in CFT at the first injection visit (mean = 347 ± 85) compared to the MDS date (mean = 282 ± 34) in the eyes with eAMD. 95% of the eyes with eAMD had subretinal fluid at their first visit, and only 30% of these eyes had evidence of subretinal fluid at the MDS visit. No significant difference in IOP was observed in the eAMD eyes from the initial visit to the MDS date. No significant differences were found in the eyes with dry AMD from the first visit to the MDS visit with respect to average logMAR BCVA, IOP, or CFT. Both the eAMD and dry AMD eyes showed no significant difference in cataract distribution (eAMD p-value = 0.162, dry AMD p-value = 0.526) or proportion of pseudophakic eyes (eAMD p-value = 0.079, dry AMD p-value = 0.130) eyes. Other ocular imaging data are outlined in Table 2.
Contrast Sensitivity Among the Eyes with eAMD, Dry AMD, and Controls
Figure 1 shows the MDS data for the 3 eye groups plotted with mean threshold values (y-axis) against contrast modulation ratios (x-axis) at the 2 different edge widths. A best-fit exponential regression is shown for the 6 datasets (3 groups of eyes, each at edge-width of 3 and 6). The above mentioned best-fit exponential regression was utilized to determine the α and β MDS output parameters.
CS parameters (α and β) were calculated for the 3 groups of eyes using the MDS and Pelli-Robson assessments (Table 4). The results of a one-way ANOVA analysis are displayed, comparing differences in mean CS parameters among the 3 groups (Table 3). At an edge-width of 3, no significant difference was observed in overall threshold levels (α for eAMD = 0.0337, α for dry AMD = 0.0247, α for controls = 0.0231, p-value = 0.789). Similarly, at an edge-width of 6, no significant difference was observed in overall threshold levels (α for eAMD = 0.0163, α for dry AMD = 0.0264, α for controls = 0.0046, p-value = 0.371). At an edge-width 3, no significant difference was observed in the slope of contrast thresholds as a function of contrast modulation ratios (β for eAMD = 0.0687, β for dry AMD = 0.0849, β for controls = 0.1088, p-value = 0.1265). However, at an edge-width of 6, there was a significant difference in the slope of contrast thresholds as a function of contrast modulation ratios (β for eAMD = 0.0722, β for dry AMD = 0.0937, β for controls = 0.128, p-value = 0.030). There was a statistically significant difference in the Pelli-Robson log CS scores among the 3 groups (log CS for eAMD = 1.4325, for dry AMD = 1.515, for controls = 1.575, p-value = 0.0021).
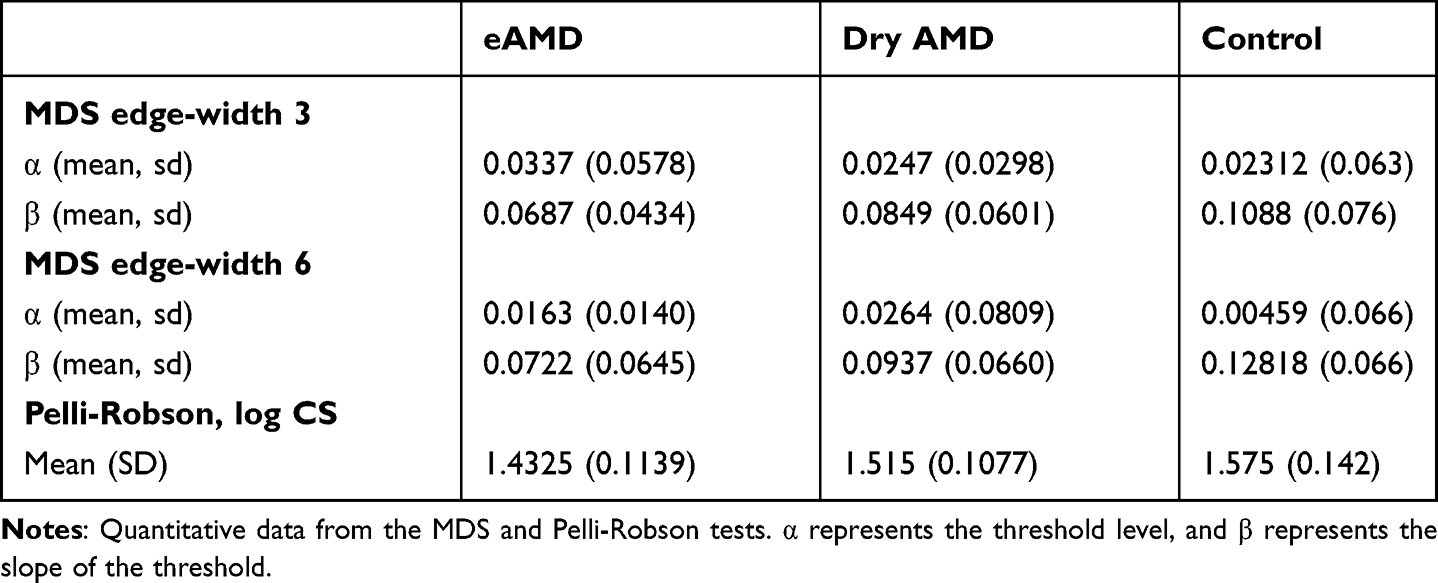 |
Table 4 Contrast Sensitivity Parameters for MDS and Pelli-Robson for eAMD, Dry AMD, and Control Cohorts |
A Tukey HSD posthoc analysis was performed to delineate differences in the CS parameters among the 3 eye groups (Table 5). The analysis showed no differences in the α values between the 3 eye groups. A significant difference was noted between the eAMD and controls at edge-width 6 (p-value = 0.0238) with respect to the β parameter. In addition, the Pelli-Robson log CS scores between the eAMD and controls were significantly different (p-value = 0.0014). Of note, neither the PR nor the MDS showed any differences between dry and exudative AMD eyes. Similarly, neither the PR nor the MDS showed any differences between dry AMD and control eyes.
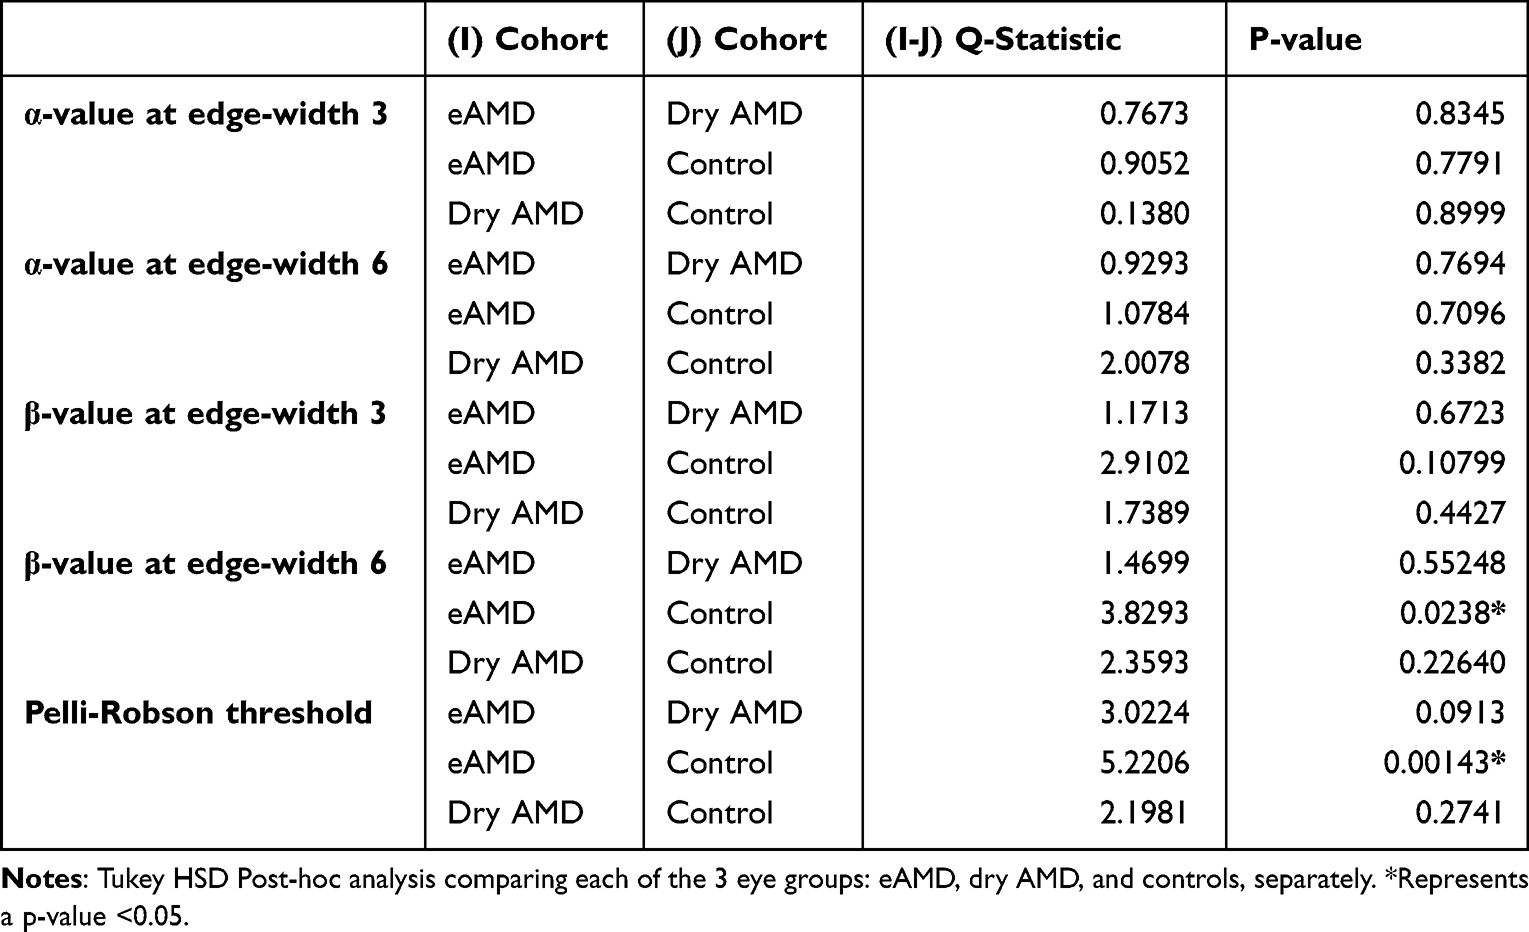 |
Table 5 Tukey HSD Post-Hoc Analysis Among eAMD, Dry AMD, and Controls |
NEI VFQ-25 Among Patients with AMD vs Controls
Patients with AMD had a mean overall composite score of 92.69 ± 5.59 on the NEI VFQ-25, and that of the patients who served as controls was 87.7 ± 9.5. The difference was not statistically significant (p-value = 0.0797).
Discussion
Vision is a highly complex neural function comprising many variables. One of them is CS, which relates spatial frequency to the contrast required to differentiate patterns at that specific spatial frequency and is better correlated with visual quality of life.10 Reading material, such as a Snellen chart, measures visual function at 100% contrast (most commonly black letters on a white background), while objects in the real world consist of varying contrasts and require adaptability. Measuring CS can provide valuable insight into retinal conditions and patients’ perceived vision that may not be revealed by visual acuity testing alone.9 The utility and accuracy of the gold standard Pelli-Robson CS test has been challenged,16 and limitations of the PR include static field testing, influence of lighting, reflection, and fading on the physical chart, learning effect on repeat testing, and the necessity for patients to recognize letters.18 Alternate CS tests such as the MDS have been developed to account for the above-mentioned limitations. The MDS tests CS in a dynamic field, is a digital rather than physical tool, has randomized directions on repeat testing, and does not require letter recognition. Analysis of the MDS, a novel CS testing method in development, is discussed in detail in prior studies.18 This is the first study to test the MDS assessment in patients with AMD. CS can be helpful in early detection, monitoring, and assessing treatment response in several ocular conditions.9
Significant improvement in logMAR BCVA, CFT, and subretinal fluid was noted in the eAMD group on the MDS recruitment visit compared to their baseline on their initial visit. This corroborates prior studies that have shown a strong correlation between BCVA and CFT in macular edema and anti-VEGF-associated improvement in BCVA with a decline in CFT and subretinal fluid.20,21 A significant difference was noted in the Pelli-Robson scores between the 3 groups of eyes. There was no significant difference in the Pelli-Robson scores between the eyes with eAMD and dry AMD when further analyzing this. The preservation and minimal deterioration of CS in eAMD could be due to regular and effective treatments with anti-VEGF injections, although further study evaluating MDS performance in eAMD eyes prior to treatment should be conducted. The significant difference in Pelli-Robson scores between the control eyes and those with eAMD highlights that CS is affected by this disease and cannot be monitored using visual acuity testing alone. The dynamic nature of the MDS test versus the static nature of the Pelli-Robson test could explain these differences in the results.
The MDS results demonstrated no significant differences in the overall contrast threshold value (α) between the 3 groups at either edge-widths. This could again be due to the effective anti-VEGF treatments that patients were receiving. While there was no significant difference in the adaptability of the visual system (β) at an edge-width of 3, there was a difference at an edge-width of 6 between the 3 groups. The larger edge-width of 6 likely eliminated the possibility of BCVA being a confounding variable present at an edge-width of 3; therefore, a significant difference was seen. The significant difference in β between the eAMD and control eyes is an important finding. Prior studies have used visual evoked potentials and pattern electroretinograms to study contrast adaptability.22–24 Visual adaptability increases when light input signals are weak and decreases when signals are strong, a function of the retinal ganglion cells.21 Both the PR and MDS results show significant CS impairments specifically when comparing eAMD to control eyes; thus, no conclusions can be made regarding which test performs better. However, while contrast threshold can be acquired through the Pelli-Robson test, other aspects of visual contrast, such as adaptability may be unanswered through just the Pelli-Robson. Further, the size of the letters on the Pelli-Robson chart could allow patients to interpret the shape of the letter and provide a guess, and needing only 2 correct letters per triplet, and patients could potentially achieve a higher score on the test. Although there is no study that correlates contrast adaptability obtained using visual evoked potentials or pattern electroretinograms to those from the MDS test yet, the MDS test provides more information regarding visual contrast and detects more minor differences in contrast. The data thus far demonstrate the potential of the MDS program and underscore the importance of early and treatment of eAMD with anti-VEGF.
The relationship between CS and quality of life suggests that the benefits of ophthalmic treatments may be underestimated if CS is not considered.25 This point is emphasized by the high average composite VFQ-25 score noted in patients with AMD who received anti-VEGF treatments. Thus, improvement in visual acuity, among other aspects such as CS and subretinal fluid that contribute to overall vision, likely resulted in a better quality of life for this study’s AMD patients.
This study had some limitations. The first is a limited sample size due to the strict exclusion criteria. This prevented us from drawing definitive conclusions on the CS changes and the utility of the MDS assessment in patients with AMD. The MDS test has a few inherent limitations as discussed in prior studies, such as time burden of the test and the unique β parameter.18 The small sample size also led to a non-diverse cohort, which was dissimilar with respect to gender and age. One of the inclusion criteria was good visual acuity, which is not representative of the entire AMD population. Administering the MDS test before initiating anti-VEGF treatments in patients with AMD and comparing them to the test results post-treatment would provide further meaningful insight into the changes in CS at various stages of AMD. An additional future direction includes testing the MDS program on other retinal conditions to validate the MDS outputs and understand the effect on CS in other diseases. This study is among the first steps into getting a deeper understanding of CS and its effect on AMD. Building on this study and modifying the MDS test with aspects learned from this study will be valuable for early interventions, considering contrast changes, and improving quality of life.
The MDS is a contrast-generated illusory motion that can be useful in assessing the CS of patients with AMD. In addition, a shortened version of the test would be beneficial for testing patients in ophthalmology clinics that usually tend to be busy. Lastly, the MDS assessment can provide insight into patients’ perceived visual deficits not currently measured by traditional visual acuity.
Funding
This work was supported by the Department of Ophthalmology at Northwestern University.
Disclosure
Arthur Shapiro, PhD, and American University were awarded a patent for the Motion Diamond Stimulus, which falls under patent “Directional illusions based on motion pixels and uses thereof” (Patent No.: 10,426,333). The remaining authors have no proprietary or commercial interest in any of the materials discussed in this article.
References
1. Wong WL, Su X, Li X, et al. Global prevalence of age-related macular degeneration and disease burden projection for 2020 and 2040: a systematic review and meta-analysis. Lancet Glob Health. 2014;2(2):e106–e116. doi:10.1016/S2214-109X(13)70145-1
2. Mitchell J, Bradley C. Quality of life in age-related macular degeneration: a review of the literature. Health Qual Life Out. 2006;4:97. doi:10.1186/1477-7525-4-97
3. Jager RD, Mieler WF, Miller JW. Age-related macular degeneration. N Engl J Med. 2008;358(24):2606–2617. doi:10.1056/NEJMra0801537
4. Gillies MC, Hunyor AP, Arnold JJ, et al. Effect of ranibizumab and aflibercept on best-corrected visual acuity in treat-and-extend for neovascular age-related macular degeneration: a randomized clinical trial. JAMA Ophthalmol. 2019;137(4):372–379. doi:10.1001/jamaophthalmol.2018.6776
5. Boyer DS, Antoszyk AN, Awh CC, et al. Subgroup analysis of the MARINA study of ranibizumab in neovascular age-related macular degeneration. Ophthalmology. 2007;114(2):246–252. doi:10.1016/j.ophtha.2006.10.045
6. Wu Z, Ayton LN, Luu CD, Guymer RH. Longitudinal changes in microperimetry and low luminance visual acuity in age-related macular degeneration. JAMA Ophthalmol. 2015;133(4):442–448. doi:10.1001/jamaophthalmol.2014.5963
7. Ross C, Stelmack JA, Stelmack TR, Fraim ME. Preliminary examination of the reliability and relationship to clinical state of a measure of low vision patient functional status. Optom Vis Sci. 1990;68:918–923. doi:10.1097/00006324-199112000-00002
8. McGuinness MB, Finger RP, Wu Z, et al. Properties of the impact of vision impairment and night vision questionnaires among people with intermediate age-related macular degeneration. Transl Vis Sci Technol. 2019;8(5):3. doi:10.1167/tvst.8.5.3
9. Owsley C, McGWIN GE, Sloane ME, Stalvey BT, Wells J. Timed instrumental activities of daily living tasks: relationship to visual function in older adults. Optom Vis Sci. 2001;78(5):350–359. doi:10.1097/00006324-200105000-00019
10. Dorr M, Elze T, Wang H, Lu ZL, Bex PJ, Lesmes LA. New precision metrics for contrast sensitivity testing. IEEE J Biomed Health. 2017;22(3):919–925. doi:10.1109/JBHI.2017.2708745
11. Alexander MF, Maguire MG, Lietman TM, Snyder JR, Elman MJ, Fine SL. Assessment of visual function in patients with age-related macular degeneration and low visual acuity. Arch Ophthalmol. 1988;106:1543–1547. doi:10.1001/archopht.1988.01060140711040
12. McClure ME, Hart PM, Jackson AJ, Stevenson MR, Chakravarthy U. Macular degeneration: do conventional measurements of impaired visual function equate with visual disability? Br J Ophthalmol. 2000;84(3):244–250. doi:10.1136/bjo.84.3.244
13. Scott IU, Feuer WJ, Jacko JA. Impact of visual function on computer task accuracy and reaction time in a cohort of patients with age-related macular degeneration. Am J Ophthalmol. 2002;133(3):350–357. doi:10.1016/S0002-9394(01)01406-4
14. Roh M, Selivanova A, Shin HJ, Miller JW, Jackson ML. Visual acuity and contrast sensitivity are two important factors affecting vision-related quality of life in advanced age-related macular degeneration. PLoS One. 2018;13(5):e0196481. doi:10.1371/journal.pone.0196481
15. Pelli DG, Robson JG, Wilkins AJ. The design of a new letter chart for measuring contrast sensitivity. Clin Vis Sci. 1988;2:187–199.
16. Arditi A. Improving the design of the letter contrast sensitivity test. Investig Ophthalmol Vis Sci. 2005;46(6):2225–2229. doi:10.1167/iovs.04-1198
17. Flynn OJ, Shapiro AG. The perpetual diamond: contrast reversals along thin edges create the appearance of motion in objects. I-Perception. 2018;9(6):2041669518815708.
18. Mishra S, Maganti N, Squires N, et al. Contrast sensitivity testing in retinal vein occlusion using a novel stimulus. Transl Vis Sci Technol. 2020;9(11):29. doi:10.1167/tvst.9.11.29
19. Mangione CM. NEI VFQ-25 Scoring Algorithm. Rockville, MD: National Eye Institute; 2000.
20. Özdek ŞC, Erdinç MA, Gürelik G, Aydin B, Bahçeci U, Hasanreisoglu B. Optical coherence tomographic assessment of diabetic macular edema: comparison with fluorescein angiographic and clinical findings. Ophthalmologica. 2005;219(2):86–92. doi:10.1159/000083266
21. Brown DM, Regillo CD. Anti-VEGF agents in the treatment of neovascular age-related macular degeneration: applying clinical trial results to the treatment of everyday patients. Am J Ophthalmol. 2007;144(4):627–637. doi:10.1016/j.ajo.2007.06.039
22. Demb JB. Functional circuitry of visual adaptation in the retina. J Physiol. 2008;586(18):4377–4484. doi:10.1113/jphysiol.2008.156638
23. Porciatti V, Bosse B, Parekh PK, Shif OA, Feuer WJ, Ventura LM. Adaptation of the steady-state PERG in early glaucoma. J Glaucoma. 2014;23(8):494. doi:10.1097/IJG.0b013e318285fd95
24. Tebartz van Elst L, Greenlee MW, Foley JM, Luecking CH. Contrast detection, discrimination and adaptation in patients with Parkinson’s disease and multiple system atrophy. Brain. 1997;120(12):2219–2228. doi:10.1093/brain/120.12.2219
25. Bansback N, Czoski-Murray C, Carlton J, et al. Determinants of health related quality of life and health state utility in patients with age related macular degeneration: the association of contrast sensitivity and visual acuity. Qual Life Res. 2007;16(3):533–543. doi:10.1007/s11136-006-9126-8
 © 2022 The Author(s). This work is published and licensed by Dove Medical Press Limited. The
full terms of this license are available at https://www.dovepress.com/terms
and incorporate the Creative Commons Attribution
- Non Commercial (unported, 3.0) License.
By accessing the work you hereby accept the Terms. Non-commercial uses of the work are permitted
without any further permission from Dove Medical Press Limited, provided the work is properly
attributed. For permission for commercial use of this work, please see paragraphs 4.2 and 5 of our Terms.
© 2022 The Author(s). This work is published and licensed by Dove Medical Press Limited. The
full terms of this license are available at https://www.dovepress.com/terms
and incorporate the Creative Commons Attribution
- Non Commercial (unported, 3.0) License.
By accessing the work you hereby accept the Terms. Non-commercial uses of the work are permitted
without any further permission from Dove Medical Press Limited, provided the work is properly
attributed. For permission for commercial use of this work, please see paragraphs 4.2 and 5 of our Terms.