Back to Journals » International Journal of Chronic Obstructive Pulmonary Disease » Volume 11 » Issue 1
Continuous quantitative measurement of the proximal airway dimensions and lung density on four-dimensional dynamic-ventilation CT in smokers
Authors Yamashiro T ![]() , Moriya H, Tsubakimoto M, Matsuoka S, Murayama S
, Moriya H, Tsubakimoto M, Matsuoka S, Murayama S
Received 17 November 2015
Accepted for publication 19 February 2016
Published 13 April 2016 Volume 2016:11(1) Pages 755—764
DOI https://doi.org/10.2147/COPD.S100658
Checked for plagiarism Yes
Review by Single anonymous peer review
Peer reviewer comments 3
Editor who approved publication: Prof. Dr. Richard Russell
Supplementary video presented by Yamashiro et al.
Views: 512
Tsuneo Yamashiro,1 Hiroshi Moriya,2 Maho Tsubakimoto,1 Shin Matsuoka,3 Sadayuki Murayama1
On behalf of ACTIve Study Group
1Department of Radiology, Graduate School of Medical Science, University of the Ryukyus, Nishihara, Okinawa, 2Department of Radiology, Ohara General Hospital, Fukushima-shi, Fukushima, 3Department of Radiology, St Marianna University School of Medicine, Kawasaki, Kanagawa, Japan
Purpose: Four-dimensional dynamic-ventilation computed tomography (CT) imaging demonstrates continuous movement of the airways and lungs, which cannot be depicted with conventional CT. We aimed to investigate continuous changes in lung density and airway dimensions and to assess the correlation with spirometric values in smokers.
Materials and methods: This retrospective study was approved by the Institutional Review Board, and informed consent was waived. Twenty-one smokers including six patients with COPD underwent four-dimensional dynamic-ventilation CT during free breathing (160 mm in length). The mean lung density (MLD) of the scanned lung and luminal areas (Ai) of fixed points in the trachea and the right proximal bronchi (main bronchus, upper bronchus, bronchus intermedius, and lower bronchus) were continuously measured. Concordance between the time curve of the MLD and that of the airway Ai values was expressed by cross-correlation coefficients. The associations between these quantitative measurements and the forced expiratory volume in 1 second/forced vital capacity (FEV1/FVC) values were assessed by Spearman’s rank correlation analysis.
Results: On the time curve for the MLD, the Δ-MLD1.05 values between the peak inspiratory frame to the later third frame (1.05 seconds later) were strongly correlated with the FEV1/FVC (ρ=0.76, P<0.0001). The cross-correlation coefficients between the airway Ai and MLD values were significantly correlated with the FEV1/FVC (ρ=–0.56 to –0.66, P<0.01), except for the right upper bronchus. This suggested that the synchrony between the airway and lung movement was lost in patients with severe airflow limitation.
Conclusion: Respiratory changes in the MLD and synchrony between the airway Ai and the MLD measured with dynamic-ventilation CT were correlated with patient’s spirometric values.
Keywords: computed tomography, chronic obstructive pulmonary disease, emphysema, airflow limitation, mean lung density
Introduction
A 320-row multidetector computed tomography (MDCT) scanner can continuously scan the thorax under free breathing conditions (maximum 160 mm in length). Using an iterative reconstruction technique, dynamic-ventilation computed tomography (CT) that covers longer respiratory cycles over longer scan times is possible.
There are a few papers that have described the advantages of four-dimensional (4D) dynamic-ventilation CT for observing airway or pulmonary diseases.1–7 However, no published studies have reported quantitative measurements of the lung or airways using dynamic-ventilation CT. This may be due to a lack of software or workstations that can measure 4D-CT data. Recently, novel research software was developed that can track and measure an airway point throughout the dynamic-ventilation CT scan.8 Although the scanned lung is limited to a part of the whole lung (≤160 mm in length), the continuous mean lung density (MLD) values of the dynamic CT are also measurable using different software that can separate the airways and lungs.
In patients with pulmonary emphysema or COPD, both the quantitatively measured lung density and the airway luminal area (Ai) are predictors of airflow limitation.9–14 Among the various quantitative indices of lung density, the MLD is most associated with lung volume (LV), whereas the percent low attenuation area (LAA%) or 15th percentile mostly reflects pulmonary emphysema.9–11 There are multiple studies that have indicated strong correlations between the MLD and LV, which implies that changes in the MLD value would be a good index reflecting respiratory changes in LV.9–11 Although there is no published information on continuous measurements of lung density or airway dimensions, it can be predicted that dynamic-ventilation CT during respiration would bring novel perspectives regarding airway and lung movement to better understand the airflow limitation in patients with COPD.
Thus, as a preliminary study using dynamic-ventilation CT, we aimed to investigate continuous changes in the quantitative luminal dimensions of the proximal airways and in lung density and to assess the correlation to spirometric values in smokers with and without COPD.
Materials and methods
This study was also approved by the Institutional Review Board at Ohara General Hospital, and written informed consent from enrolled patients was waived. This retrospective study was arranged as part of the Area-Detector Computed Tomography for the Investigation of Thoracic Diseases (ACTIve) Study, an ongoing multicenter research project in Japan. Based on the agreement with the research committee of the ACTIve Study Group, this study was planned as a preliminary research for investigating the potential of dynamic-ventilation CT using 320-row MDCT scanners.
Subjects
Twenty-one smokers (eleven ex-smokers and ten current smokers; four females and 17 males; mean age 69±8 years) underwent spirometry and a chest CT. They were scanned for preoperative assessment of resectable thoracic neoplasms (n=17) or for an assessment of COPD (n=4). No patients had large thoracic tumors (>3 cm in diameter) with severe invasion of the chest wall or proximal airways. For the patients with the thoracic neoplasms, the dynamic-ventilation CT was performed to investigate tumor invasion or adhesion to the pleura. For the patients with COPD, the dynamic CT was performed to detect possible central airway obstructions, which would cause airflow limitations and can be treated by bronchoscopic interventions. Six patients were diagnosed with COPD according to the criteria of the American Thoracic Society and European Respiratory Society.15 The patient’s characteristics are summarized in Table 1.
 | Table 1 Clinical characteristics of 21 patients |
CT scan
All patients were scanned on a 320-row MDCT scanner (Aquilion ONE; Toshiba Medical Systems, Otawara, Tochigi, Japan) for both conventional static and dynamic-ventilatory scans. Using the wide volume mode (nonhelical mode),16 dynamic scanning was performed at a fixed point without bed movement, resulting in a CT fluoroscopy of 160 mm in length. Scanning field of view (FOV) was selected from two settings based on patient’s body habitus: 320 (medium, n=11) or 400 mm (large, n=10). Other scanning and reconstruction parameters for the dynamic-ventilatory scan were as follows: tube currents =40 mA, tube voltage =120 kVp, rotation time =0.35 seconds; total scanning time =2.8–4.55 seconds (8–13 gantry rotations); imaging FOV =320 mm, collimation =0.5 mm, slice thickness =1 mm (without image interval or overlapping), reconstruction kernel = FC15 (for mediastinum), reconstruction interval =0.35 seconds/frame, and reconstruction method = half reconstruction. Scan data were converted to CT images using an iterative reconstruction method (Adaptive Iterative Dose Reduction using Three Dimensional Processing [AIDR3D], “mild” setting).17,18 Before the dynamic-ventilatory scan, patients were trained to repeat deep breathing. Radiologic technologists monitored patient’s respiratory movement and started the scan just before the peak inspiration. Thus, at least one cycle from inspiratory to expiratory phases was included in the scan (Video S1).
A conventional static chest CT was also performed using helical scanning to image the whole thorax. The parameters for the conventional chest CT were as follows: tube currents = automatic exposure control, tube voltage =120 kVp, scanning method = helical scanning, rotation time =0.35 seconds, beam pitch =0.828, imaging FOV =320 mm, collimation =0.5 mm ×80 row, slice thickness =1 mm, reconstruction kernel = FC17 (for mediastinum), iterative reconstruction = AIDR3D (“mild” setting).
Image analysis – quantitative airway measurement on dynamic-ventilation CT
All scan data were anonymized and stored in a research computer. Using a commercially available research software (4D Airways Analysis; Toshiba Medical Systems), the continuous image data (320 images/frame × total 8–13 frames, by every 0.35 seconds) were synthesized for the cine-CT series. Detailed information of the software was described in our technical note.8 In brief, the software automatically created a tree of the centerlines from the trachea to all traceable peripheral bronchi throughout the cine-CT, on which the anatomical information of the measurement point was sustained and reproduced in each frame. Thus, once the operator set a measurement point on the airway centerline in a single frame, the corresponding measurement points in other frames were simultaneously determined (Figure 1; Video S2). In this study, airway Ai was continuously measured at a single point of the following airways: intrathoracic trachea, right main bronchus, right upper bronchus (RUB), bronchus intermedius, and right lower bronchus. In each of these regions, the approximate middle point of the airway was selected by the operator (TY, 14 years of experience in thoracic radiology) and no manual correction was applied for the automatic measurement. Due to the caudal scanning location, the CT data of one patient did not include the trachea or the RUB. All other proximal airways were measurable in all patients.
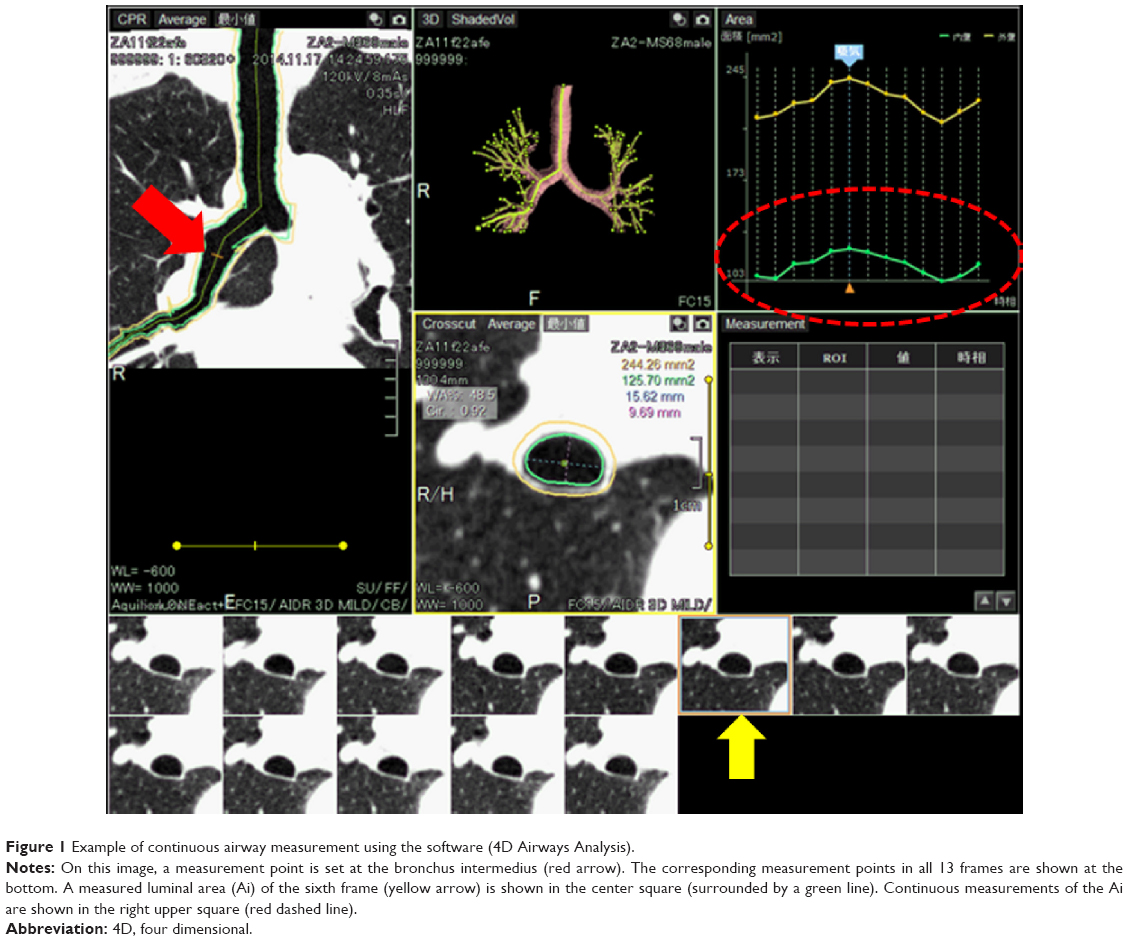 | Figure 1 Example of continuous airway measurement using the software (4D Airways Analysis). |
On the time curve of the airway Ai, the inspiratory Ai at the peak inspiratory frame and the expiratory Ai at the peak expiratory frame were recorded. The collapsibility of the airways was calculated as the expiratory/inspiratory ratio of the Ai measurements.
Image analysis – lung density measurement on dynamic-ventilation CT
Using different commercially available software (Lung Volume Measurement; Toshiba Medical Systems), the MLD was measured automatically in each frame, and the time curve of the MLD on the dynamic-ventilatory scans was created. On the time curve, the peak inspiratory (minimum) MLD, peak expiratory (maximum) MLD, and the ΔMLD1.05 values were obtained (Figure 2). The ΔMLD1.05 values were calculated between the peak inspiratory frame and the later third frame (1.05 seconds).
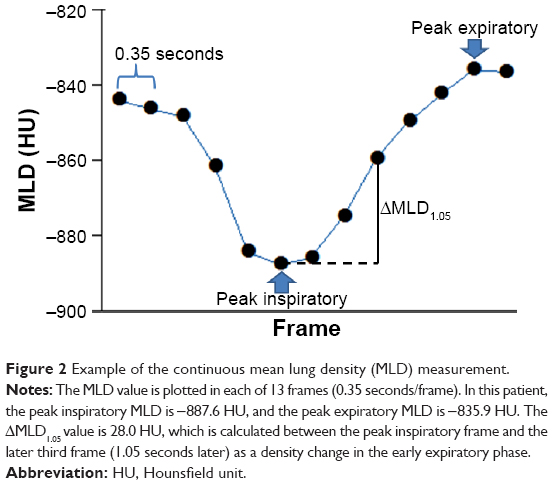 | Figure 2 Example of the continuous mean lung density (MLD) measurement. |
Since the whole lung could not be scanned within the 160-mm-scan length, the LV was not measured in this experiment. The close correlation between changes in the MLD and those of LV was reported in a previous publication.9
Image analysis – emphysema measurement on conventional chest CT
On the conventional helical CT scans, an emphysema measurement was performed using the same software as the MLD measurement. The LAA% (≤950 Hounsfield unit) of the whole lung was obtained automatically.
Spirometry
All subjects performed spirometry, including forced expiratory volume in 1 second (FEV1) and forced vital capacity (FVC), according to American Thoracic Society standards.15 The spirometric values from the study participants are shown in Table 1.
Statistical analysis
Cross-correlation coefficients (−1≤R≤1) were calculated between the time curves of the MLD and the airway Ai in each of the measured airways. If the two time curves were completely opposite in direction over time, the coefficient approached −1 (Figure 3). Spearman’s rank correlation analysis was used to evaluate the associations between the CT indices and the FEV1/FVC.
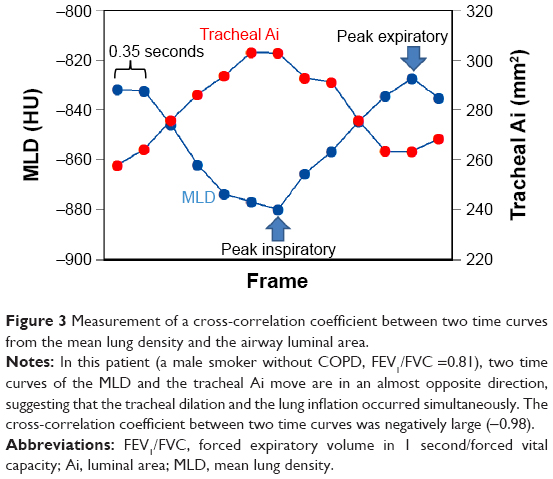 | Figure 3 Measurement of a cross-correlation coefficient between two time curves from the mean lung density and the airway luminal area. |
A P-value of <0.05 was considered significant. All statistical analyses were performed using JMP 8.0 software (SAS Institute, Cary, NC, USA).
Results
Radiation dose assessment for dynamic-ventilation CT
For a single gantry rotation of 160 mm (0.35 seconds), the CT dose index volume was 1.28 mGy for the medium scanning FOV or 1.41 mGy for the large FOV. The dose-length product value for a single rotation was 20.4 mGy·cm (medium FOV) or 22.5 mGy·cm (large FOV). The total estimated radiation exposure for the dynamic-ventilation CT for 2.8–4.55 seconds varied from 2.52 to 4.10 mSv (3.57±0.60 mSv).
Dynamic MLD and static LAA% measurements
During dynamic scanning, the MLD changed by a mean value of 61.0 Hounsfield unit. The ΔMLD1.05 demonstrated the highest correlation coefficient with the FEV1/FVC (ρ=0.76, P<0.0001) compared to the other MLD values (Table 2). The correlation coefficient between the FEV1/FVC and the LAA% on the conventional chest CT (ρ=−0.64, P<0.01) was smaller than that of the ΔMLD1.05 or the expiratory MLD.
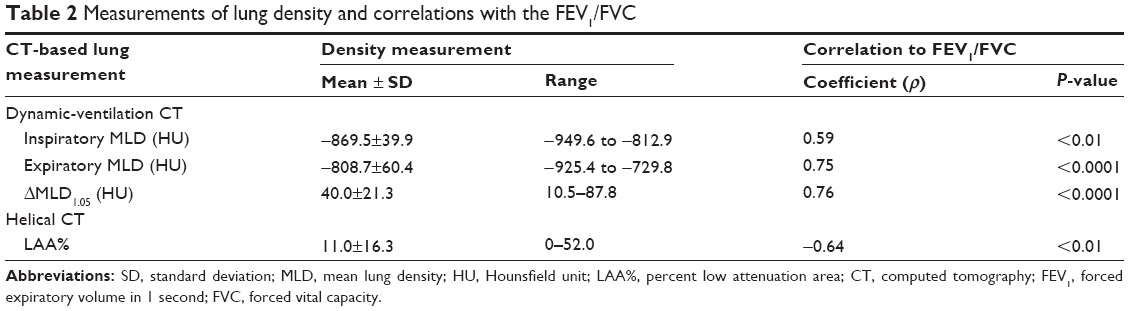 | Table 2 Measurements of lung density and correlations with the FEV1/FVC |
Dynamic airway measurement
During the dynamic CT, all airways increased in size at inspiration and decreased in size at expiration. The mean expiratory/inspiratory ratios of the measured airways ranged from 0.71 (RUB and right lower bronchus) to 0.78 (trachea). All airway values, including the inspiratory Ai, the expiratory Ai, and the E/I ratios, were not correlated significantly with the FEV1/FVC (Table 3).
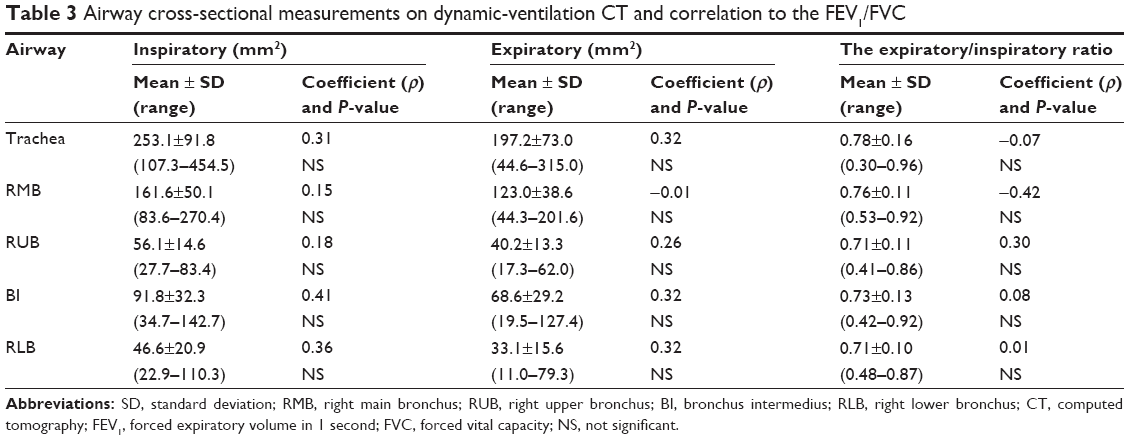 | Table 3 Airway cross-sectional measurements on dynamic-ventilation CT and correlation to the FEV1/FVC |
Cross-correlation between MLD and airway Ai
The cross-correlation coefficients between the airway Ai and the MLD were significantly correlated with the FEV1/FVC (ρ=−0.56 to −0.66, P<0.01), except for in the RUB (Table 4; Figure 4). This suggested that the synchrony between the airway and lung movements was lost in patients with severe airflow limitation, except for in the RUB.
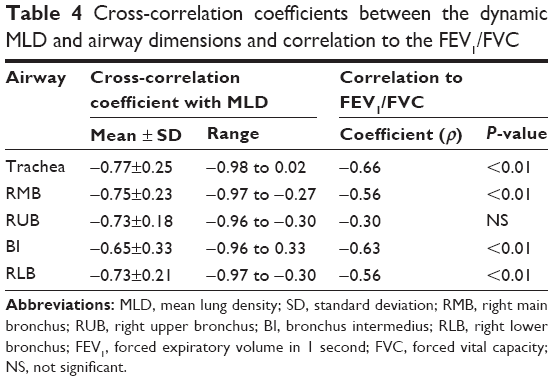 | Table 4 Cross-correlation coefficients between the dynamic MLD and airway dimensions and correlation to the FEV1/FVC |
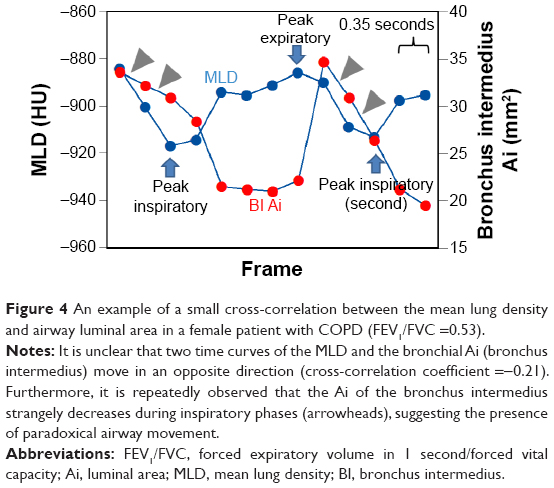 | Figure 4 An example of a small cross-correlation between the mean lung density and airway luminal area in a female patient with COPD (FEV1/FVC =0.53). |
Discussion
In this study, we first analyzed the dynamic-ventilation CT quantitatively and found that 1) the continuous MLD measurement, particularly the MLD change at the early expiratory phase (within 1.05 seconds), reflected the airflow limitation of the spirometry and that 2) although the simple dimensions or collapsibility of the proximal airways did not correlate with the airflow limitation, the synchrony between the Ai of the proximal airways and the MLD was correlated with patient’s spirometric values. These observations, which can be exclusively observed using a dynamic-ventilation CT, suggest that the disconnection between the lung and airway movements would increase in patients with more severe COPD. Based on the results found in this study, we strongly believe that observation of the continuous, respiratory movements of lung and airways by dynamic-ventilation CT would produce novel insights into the pathophysiology of COPD.
Among several quantitatively measured CT indices for COPD studies, the MLD is the most classic parameter in addition to the LAA% and the 15th percentile measurements. The outstanding characteristic of the MLD measurement is its sensitivity to the LV change.9–11 Compared to the LAA% or the 15th percentile, which basically reflects the extent of emphysema, the MLD measurement directly correlates to LV and its change. From early COPD studies that utilized nonvolumetric CT data, the MLD has been known as a good predictor of air trapping or overinflation of the lung, particularly when used as an expiratory/inspiratory ratio of the MLD measures.9,19–21 After utilizing volumetric CT data, it has been verified that there is a strong correlation between the MLD change and that of the LV.9–11 Although we could not measure the MLD or the LV of the whole lung on the dynamic-ventilation CT due to the limited scan length in the z-axis (≤160 mm), a strong correlation between the ΔMLD1.05 and the FEV1/FVC was observed. Therefore, we believe that measurement of the continuous MLD values within the scanned lung would reflect the change in LV and further can indicate an airflow limitation. Also, a continuous MLD measurement could be expanded to observe more detailed, abnormal lung movement in patients with COPD. For example, it has been suggested previously by several groups that the respiratory movement of the lung or diaphragm might be heterogeneous in patients with COPD or emphysema, which has been seen on cine-magnetic resonance (MR) scans or xenon-enhanced CT scans.22–29 Although no previous dynamic CT study has directly depicted a heterogeneous lung movement during ventilation, we strongly believe that dynamic-ventilation CT and a continuous MLD measurement could be the best imaging technique to identify heterogeneous respiratory movement between or within the lungs. Presently, we have started to enhance the software for application to the continuous MLD measurements in separated right and left lungs, or in more specific lung regions. Future studies using dynamic-ventilation CT and the MLD measurement may bring more precise insights regarding abnormal respiratory movement in the lung.
This study also revealed that asynchrony between the proximal airway dimensions and the MLD measurements during ventilation was increased in patients with a more severe airflow limitation (except for in the RUB), suggesting that the connection between lung and airway movements is lost in severe patients with COPD. To the best of our knowledge, no previous publication has reported a similar phenomenon with any imaging modality, and thus we believe that this observation is the most unique finding from dynamic-ventilation CT. Although it is very difficult to hypothesize a reason for the observed asynchrony, we speculate that possible explanations are as follows. The first probable reason would be an uneven time curve of the MLD. The respiratory lung movement would be very heterogeneous in patients with COPD. This has been suggested by previous studies that evaluated the respiratory movement of the diaphragm on MR22–26 and the regional lung densities on combined inspiratory–expiratory CT scans.30,31 Iwasawa et al reported that paradoxical movements of the diaphragm, which are observed as a mixed upward and downward diaphragmatic motion during lung ventilation on cine-MR, are frequently observed in patients with emphysema or COPD.22–24 On combined inspiratory–expiratory CT scans, Salito et al found that the heterogeneity of the gas volume change among bronchopulmonary regions was significantly higher in patients with COPD than in healthy subjects.30 Based on these observations and other previous publications describing the heterogeneity of the air distribution on MR in patients with COPD,32–35 it is logical that respiratory lung movement would be heterogeneous in patients with more severe airflow limitation, which would appear as an uneven time curve of the MLD in this study. In fact, when compared to a smoker without COPD (Figure 3), some severe patients with COPD demonstrated uneven MLD curves during ventilation in this study (Figure 4). This uneven time curve of the MLD itself would result in smaller synchronization with curves of proximal airway dimensions. Another possible explanation for the asynchrony between the airway and lung movements would be the heterogeneous airway movements. Although no previous publication has indicated abnormal movement of the proximal bronchi in COPD, the continuous measurement of the airway Ai in this study revealed strange, paradoxical movements of the proximal airways in severe patients with COPD, which was seen as a decrease in the airway Ai during inspiration or an increase in the Ai during expiration (Figure 4). These paradoxical movements make the time curve of the airway Ai uneven or skewed, resulting in a less synchronized time curve of the airway Ai with that of the MLD. Although it has been reported that an abnormal, excessive collapse of the proximal airways (tracheomalacia or tracheobronchomalacia) is sometimes found in smokers or patients with COPD,36,37 it is currently unclear whether the paradoxical movement of the proximal airways, which was found in this study, universally occurs in severe patients with COPD. This finding should be evaluated in a larger study population with the inclusion of additional physiologic parameters, such as the change in the intra-airway pressure.
While asynchrony of time curves between all other proximal airways and the MLD correlated with the airflow limitation, the asynchrony between the Ai of the RUB and the MLD did not show a significant correlation with the FEV1/FVC. Although the precise reason for this observation cannot be elucidated, one possible explanation would be a decreased respiratory volume change in the right upper lobe. It has been reported that, compared to the lower lobes, the upper lobes do not change volume during ventilation and that the volume change in the upper lobes does not contribute to lung function.38,39 These observations may explain the decreased impact of the asynchrony between the RUB and the MLD on the FEV1/FVC values. Further studies are needed to evaluate differences in the contributions to spirometric values among the various airways.
Although this is the first study to demonstrate the results of dynamic-ventilation CT in the evaluation of obstructive lung diseases, we currently believe that this novel technique can be applied to various research or clinical situations for COPD or other obstructive diseases. For example, compared with conventional inspiratory or expiratory CT scanning,9–13 dynamic-ventilatory scanning can depict continuous airway movement during ventilation, which may include abnormal airway collapses or occlusions that cannot be shown on static CT scans. In the current study that analyzed a limited number of subjects, we found that some patients demonstrated abnormal (paradoxical) movements of the proximal airways (Figure 4). If some specific proximal airway points are occluded during ventilation and are truly considered as responsible points for proximal-type airflow limitation in COPD, these abnormal proximal airways may be a target for bronchoscopic interventions, such as intrabronchial stenting. Furthermore, although no published information is available, dynamic-ventilation CT could be expanded to other airway diseases, such as bronchial asthma or tracheobronchomalacia, for the identification of the most narrowed points during ventilation or at forced expiration. These future applications are currently just hypothetical; however, we strongly believe that dynamic-ventilation CT could be a new, powerful method in research or in the clinical field of obstructive diseases.
This study has several limitations that should be noted. First, because this study was performed as a preliminary study for investigating the potential of dynamic-ventilation CT, the total number of enrolled subjects was small. Also, many enrolled patients underwent the dynamic ventilatory scan as a preoperative assessment for tumor invasion or adhesion to the pleura. Although no patient with a large mass or a severe invasion to the adjacent structures was included in the study, the presence of thoracic neoplasms may have influenced the movement of the lungs or proximal airways. Thus, the results of this study should be reproduced in a larger study population without thoracic neoplasms. Second, the dynamic-ventilation CT could not scan the whole thorax. Although we believed that it was best to utilize the MLD measurement in place of a LV measurement, true respiratory changes in LV could not be measured. Third, we did not measure more peripheral airways due to a technical limitation in the software. The software is now being improved to observe more peripheral airways with a reference plane that shows the selected airway point on original axial CT images, in order to detect precise bronchial generations. It is acknowledged that the airway dimensions or wall thickening of the more peripheral airways reflect airflow limitation more precisely;12–14 therefore, continuous measurement of the peripheral airways should be performed in future studies. Fourth, the degree of inspiration/expiration was not standardized in this study. Although all subjects were coached to continue deep breathing, the level of expiration was not standardized as forced expiration toward the residual volume level or expiration during tidal breathing as the functional residual capacity level. This may have caused the imperfect correlation between the ΔMLD1.05 and the FEV1/FVC values (ρ=0.76). Thus, the level of breathing should be more strictly standardized in the next study. Fifth, both ex- and current smokers were enrolled and analyzed together in this study. However, a recent study has reported that current smoking causes inflammation in the lung parenchyma and has a significant impact on the MLD, which may not be observed in ex-smokers.40 Although there is no report regarding continuous MLD measurement in groups consisting of ex- and current smokers, continuous MLD measurements using dynamic-ventilation CT should be conducted in future studies, which may bring more morphological or pathological knowledge of smoking-related diseases and differences between past and current smoking. Furthermore, the continuous MLD measurement should be expanded to some other pulmonary diseases that may cause heterogeneity of lung densities, such as bronchial asthma or pulmonary embolism in order to clarify the differences with COPD. Sixth, relatively high radiation exposure for dynamic-ventilation CT may lead to a concern regarding the use of the technique in daily clinical care for airway and pulmonary diseases. While we used the tube current setting of 20 mA in this study, a more reduced tube current, such as 10 mA, may be feasible in future studies, particularly in combination with more powerful iterative reconstruction techniques.
Conclusion
In conclusion, using dynamic-ventilation CT, continuous respiratory changes in the MLD and the synchrony between the proximal airway dimensions and the MLD measurement were correlated with patient’s spirometric values. This novel technique can be applied to research on COPD and other obstructive pulmonary diseases, with quantitative measurements for continuous movement of the lung and airways.
Acknowledgments
The authors thank Shinsuke Tsukagoshi, PhD, and Tatsuya Kimoto, MS (Toshiba Medical Systems Corporation), for their technical support.
The ACTIve Study Group currently consists of the following institutions: Ohara General Hospital, Fukushima-shi, Fukushima, Japan (Kotaro Sakuma, MD; Hiroshi Moriya, MD, PhD); Saitama International Medical Center, Saitama Medical University, Hidaka, Saitama, Japan (Fumikazu Sakai, MD, PhD); Shiga University of Medical Science, Otsu, Shiga, Japan (Yukihiro Nagatani, MD; Norihisa Nitta, MD; Kiyoshi Murata, MD); Osaka University, Suita, Osaka, Japan (Osamu Honda, MD, PhD; Noriyuki Tomiyama, MD, PhD); Osaka Medical College, Takatsuki, Osaka, Japan (Mitsuhiro Koyama, MD, PhD); Tenri Hospital, Tenri, Nara, Japan (Yuko Nishimoto, MD; Satoshi Noma, MD, PhD); Kobe University, Kobe, Hyogo, Japan (Hisanobu Koyama, MD, PhD; Yoshiharu Ohno, MD, PhD; Kazuro Sugimura, MD); Okayama University, Okayama-shi, Okayama, Japan (Akihiro Tada, MD); and the University of the Ryukyus, Nishihara, Okinawa, Japan (Tsuneo Yamashiro, MD; Maho Tsubakimoto, MD; Tetsuhiro Miyara, MD; Sadayuki Murayama, MD, PhD).
Disclosure
The University of the Ryukyus and Ohara General Hospital received a research grant from Toshiba Medical Systems. The authors declare no other conflicts of interest in this work.
References
Greenberg SB. Dynamic pulmonary CT of children. Am J Roentgenol. 2012;199(2):435–440. | ||
Lee EY, Zucker EJ, Restrepo R, Daltro P, Boiselle PM. Advanced large airway CT imaging in children: evolution from axial to 4-D assessment. Pediatr Radiol. 2013;43(3):285–297. | ||
Tan JZ, Crossett M, Ditchfield M. Dynamic volumetric computed tomographic assessment of the young paediatric airway: Initial experience of rapid, non-invasive, four-dimensional technique. J Med Imaging Radiat Oncol. 2013;57(2):141–148. | ||
Wielputz MO, Eberhardt R, Puderbach M, Weinheimer O, Kauczor HU, Heussel CP. Simultaneous assessment of airway instability and respiratory dynamics with low-dose 4D-CT in chronic obstructive pulmonary disease: a technical note. Respiration. 2014;87(4):294–300. | ||
Choong CK, Pasricha SS, Li X, et al. Dynamic four-dimensional computed tomography for preoperative assessment of lung cancer invasion into adjacent structures. Eur J Cardiothorac Surg. 2015;47(2):239–243; discussion 243. | ||
Fujimoto R, Sato M, Miyata R, et al. Successful resection of recurrent mediastinal liposarcoma using preoperative evaluation of organ invasion by four-dimensional computed tomography. Gen Thorac Cardiovasc Surg. Epub 2014 Dec 21. | ||
Troupis JM, Pasricha SS, Narayanan H, Rybicki FJ, Pick AW. 4D CT and lung cancer surgical resectability: a technical innovation. J Med Imaging Radiat Oncol. 2014;58(4):469–471. | ||
Yamashiro T, Tsubakimoto M, Nagatani Y, et al. Automated continuous quantitative measurement of proximal airways on dynamic ventilation CT: initial experience using an ex-vivo porcine lung phantom. Int J Chron Obstruct Pulmon Dis. 2015;10(1):2045–2054. | ||
Yamashiro T, Matsuoka S, Bartholmai BJ, et al. Collapsibility of lung volume by paired inspiratory and expiratory CT scans: correlations with lung function and mean lung density. Acad Radiol. 2010;17(4):489–495. | ||
Kundu S, Gu S, Leader JK, et al. Assessment of lung volume collapsibility in chronic obstructive lung disease patients using CT. Eur Radiol. 2013;23(6):1564–1572. | ||
Camiciottoli G, Cavigli E, Grassi L, et al. Prevalence and correlates of pulmonary emphysema in smokers and former smokers: a densitometric study of participants in the ITALUNG trial. Eur Radiol. 2009;19(1):58–66. | ||
Hasegawa M, Nasuhara Y, Onodera Y, et al. Airflow limitation and airway dimensions in chronic obstructive pulmonary disease. Am J Respir Crit Care Med. 2006;173(12):1309–1315. | ||
Matsuoka S, Kurihara Y, Yagihashi K, Hoshino M, Nakajima Y. Airway dimensions at inspiratory and expiratory multisection CT in chronic obstructive pulmonary disease: correlation with airflow limitation. Radiology. 2008;248(3):1042–1049. | ||
Yamashiro T, Matsuoka S, Estépar RS, et al. Quantitative assessment of bronchial wall attenuation with thin-section CT: an indicator of airflow limitation in chronic obstructive pulmonary disease. Am J Roentgenol. 2010;195(2):363–369. | ||
Vestbo J, Hurd SS, Agustí AG, et al. Global strategy for the diagnosis, management, and prevention of chronic obstructive pulmonary disease: GOLD executive summary. Am J Respir Crit Care Med. 2013;187(4):347–365. | ||
Yamashiro T, Miyara T, Takahashi M, et al. Lung image quality with 320-row wide volume CT scans: the effect of prospective ECG-gating and comparisons with 64-row helical CT scans. Acad Radiol. 2012;19(4):380–388. | ||
Yamashiro T, Miyara T, Honda O, et al. Adaptive iterative dose reduction using three dimensional processing (AIDR3D) improves chest CT image quality and reduces radiation exposure. PLoS One. 2014;9(8):e105735. | ||
Yamashiro T, Miyara T, Honda O, et al. Iterative reconstruction for quantitative computed tomography analysis of emphysema: consistent results using different tube currents. Int J Chron Obstruct Pulmon Dis. 2015;10(1):321–327. | ||
Lee YK, Oh YM, Lee JH, et al. Quantitative assessment of emphysema, air trapping, and airway thickening on computed tomography. Lung. 2008;186(3):157–165. | ||
O’Donnell RA, Peebles C, Ward JA, et al. Relationship between peripheral airway dysfunction, airway obstruction, and neutrophilic inflammation in COPD. Thorax. 2004;59(10):837–842. | ||
Kubo K, Eda S, Yamamoto H, et al. Expiratory and inspiratory chest computed tomography and pulmonary function tests in cigarette smokers. Eur Respir J. 1999;13(2):252–256. | ||
Iwasawa T, Takahashi H, Ogura T, et al. Influence of the distribution of emphysema on diaphragmatic motion in patients with chronic obstructive pulmonary disease. Jpn J Radiol. 2011;29(4):256–264. | ||
Iwasawa T, Kagei S, Gotoh T, et al. Magnetic resonance analysis of abnormal diaphragmatic motion in patients with emphysema. Eur Respir J. 2002;19(2):225–231. | ||
Iwasawa T, Yoshiike Y, Saito K, Kagei S, Gotoh T, Matsubara S. Paradoxical motion of the hemidiaphragm in patients with emphysema. J Thorac Imaging. 2000;15(3):191–195. | ||
Suga K, Tsukuda T, Awaya H, et al. Impaired respiratory mechanics in pulmonary emphysema: evaluation with dynamic breathing MRI. J Magn Reson Imaging. 1999;10(4):510–520. | ||
Kiryu S, Loring SH, Mori Y, Rofsky NM, Hatabu H, Takahashi M. Quantitative analysis of the velocity and synchronicity of diaphragmatic motion: dynamic MRI in different postures. Magn Reson Imaging. 2006;24(10):1325–1332. | ||
Chae EJ, Seo JB, Goo HW, et al. Xenon ventilation CT with a dual-energy technique of dual-source CT: initial experience. Radiology. 2008;248(2):615–624. | ||
Park EA, Goo JM, Park SJ, et al. Chronic obstructive pulmonary disease: quantitative and visual ventilation pattern analysis at xenon ventilation CT performed by using a dual-energy technique. Radiology. 2010;256(3):985–997. | ||
Yoon SH, Goo JM, Jung J, et al. Computer-aided classification of visual ventilation patterns in patients with chronic obstructive pulmonary disease at two-phase xenon-enhanced CT. Korean J Radiol. 2014;15(3):386–396. | ||
Salito C, Barazzetti L, Woods JC, Aliverti A. Heterogeneity of specific gas volume changes: a new tool to plan lung volume reduction in COPD. Chest. 2014;146(6):1554–1565. | ||
Aliverti A, Pennati F, Salito C, Woods JC. Regional lung function and heterogeneity of specific gas volume in healthy and emphysematous subjects. Eur Respir J. 2013;41(5):1179–1188. | ||
Ohno Y, Iwasawa T, Seo JB, et al. Oxygen-enhanced magnetic resonance imaging versus computed tomography: multicenter study for clinical stage classification of smoking-related chronic obstructive pulmonary disease. Am J Respir Crit Care Med. 2008;177(10):1095–1102. | ||
Ohno Y, Koyama H, Nogami M, et al. Dynamic oxygen-enhanced MRI versus quantitative CT: pulmonary functional loss assessment and clinical stage classification of smoking-related COPD. Am J Roentgenol. 2008;190(2):W93–W99. | ||
Swift AJ, Wild JM, Fichele S, et al. Emphysematous changes and normal variation in smokers and COPD patients using diffusion 3He MRI. Eur J Radiol. 2005;54(3):352–358. | ||
Mathew L, Kirby M, Etemad-Rezai R, Wheatley A, McCormack DG, Parraga G. Hyperpolarized 3He magnetic resonance imaging: preliminary evaluation of phenotyping potential in chronic obstructive pulmonary disease. Eur J Radiol. 2011;79(1):140–146. | ||
Ochs RA, Petkovska I, Kim HJ, Abtin F, Brown M, Goldin J. Prevalence of tracheal collapse in an emphysema cohort as measured with end-expiration CT. Acad Radiol. 2009;16(1):46–53. | ||
Sverzellati N, Rastelli A, Chetta A, et al. Airway malacia in chronic obstructive pulmonary disease: prevalence, morphology and relationship with emphysema, bronchiectasis and bronchial wall thickening. Eur Radiol. 2009;19(7):1669–1678. | ||
Kitano M, Iwano S, Hashimoto N, Matsuo K, Hasegawa Y, Naganawa S. Lobar analysis of collapsibility indices to assess functional lung volumes in COPD patients. Int J Chron Obstruct Pulmon Dis. 2014;9(1):1347–1356. | ||
Matsuo K, Iwano S, Okada T, Koike W, Naganawa S. 3D-CT lung volumetry using multidetector row computed tomography: pulmonary function of each anatomic lobe. J Thorac Imaging. 2012;27(3):164–170. | ||
Karimi R, Tornling G, Forsslund H, et al. Lung density on high resolution computer tomography (HRCT) reflects degree of inflammation in smokers. Respir Res. 2014;15:23; doi:10.1186/1465-9921-15-23. |
Supplementary materials
Video S1 An example of the dynamic-ventilation CT (78-year-old male).
Abbreviation: CT, computed tomography.
Video S2 An example for continuous measurement of the bronchus intermedius using the software (4D Airways Analysis; 68-year-old male).
 © 2016 The Author(s). This work is published and licensed by Dove Medical Press Limited. The
full terms of this license are available at https://www.dovepress.com/terms
and incorporate the Creative Commons Attribution
- Non Commercial (unported, 3.0) License.
By accessing the work you hereby accept the Terms. Non-commercial uses of the work are permitted
without any further permission from Dove Medical Press Limited, provided the work is properly
attributed. For permission for commercial use of this work, please see paragraphs 4.2 and 5 of our Terms.
© 2016 The Author(s). This work is published and licensed by Dove Medical Press Limited. The
full terms of this license are available at https://www.dovepress.com/terms
and incorporate the Creative Commons Attribution
- Non Commercial (unported, 3.0) License.
By accessing the work you hereby accept the Terms. Non-commercial uses of the work are permitted
without any further permission from Dove Medical Press Limited, provided the work is properly
attributed. For permission for commercial use of this work, please see paragraphs 4.2 and 5 of our Terms.