")
Back to Journals » Therapeutics and Clinical Risk Management » Volume 14
Continuity of care with physicians and risk of subsequent hospitalization and end-stage renal disease in newly diagnosed type 2 diabetes mellitus patients
Authors Chang PY , Chien LN, Bai CH , Lin YF , Chiou HY
Received 1 September 2017
Accepted for publication 12 January 2018
Published 13 March 2018 Volume 2018:14 Pages 511—521
DOI https://doi.org/10.2147/TCRM.S150638
Checked for plagiarism Yes
Review by Single anonymous peer review
Peer reviewer comments 3
Editor who approved publication: Dr Deyun Wang
Po-Ya Chang,1 Li-Nien Chien,2 Chyi-Huey Bai,1 Yuh-Feng Lin,3 Hung-Yi Chiou1
1School of Public Health, College of Public Health, Taipei Medical University, Taipei, Taiwan; 2School of Health Care Administration, Taipei Medical University, Taipei, Taiwan; 3Graduate Institute of Clinical Medicine, Taipei Medical University, Taipei, Taiwan
Purpose: Effective management for type 2 diabetes mellitus (DM) can slow the progression of kidney outcomes and reduce hospital admissions. Better continuity of care (COC) was found to improve patients’ adherence and self-management. This study examined the associations between COC, hospitalization, and end-stage renal disease (ESRD) in DM patients.
Patients and methods: In the cohort study, data from 1996 to 2012 were retrieved from the Longitudinal Health Insurance Database, using inverse probability weighted analysis. A total of 26,063 patients with newly diagnosed type 2 DM who had been treated with antihyperglycemic agents were included. COC is to assess the extent to which a DM patient visited the same physician during the study period. This study categorized COC into 3 groups – low, intermediate, and high, – according to the distribution of scores in our sample.
Results: The number of ESRD patients in the high, intermediate, and low COC groups were 92 (22.33%), 130 (31.55%), and 190 (46.12%), respectively, and the mean follow-up periods for the 3 groups were 7.13, 7.12, and 7.27 years, respectively. After using inverse probability weighting, the intermediate and low COC groups were significantly associated with an increased risk of ESRD compared with the high COC group (adjusted hazard ratio (aHR) 1.36 [95% CI, 1.03–1.80] and aHR 1.76 [95% CI, 1.35–2.30], respectively). The intermediate and low COC groups were also significantly associated with the subsequent hospitalization compared with the high COC group (aHR 1.15 [95% CI, 0.99–1.33] and aHR 1.72 [95% CI, 1.50–1.97], respectively).
Conclusion: COC is related to ESRD onset and subsequent hospitalization among patients with DM. This study suggested that when DM patients keep visiting the same physician for managing their diseases, the progression of renal disease can be prevented.
Keywords: continuity of care, end-stage renal disease, hospitalization, diabetes mellitus
Introduction
Diabetes mellitus (DM) is the most common chronic and progressive noncommunicable disease. The World Health Organization estimated the prevalence of DM in patients aged >18 years to have increased from 108 million (4.7%) to 422 million (8.5%) between 1980 and 2014.1 DM is a severe global public health problem and may result in morbidity, mortality, and economic burden on health care systems.2,3
DM complications can lead to end-stage renal disease (ESRD), lower extremity amputation, cardiovascular disease, and retinopathy, and consequently increase the rate of hospitalization.1,4–7 ESRD is a major complication in patients with DM. The United States Renal Data System Annual Data Report has indicated that 44% of patients with newly diagnosed ESRD have DM.8 In the USA, ESRD treatment ($34.3 billion) accounts for 6.3% of the total Medicare budget.9 Thus, ESRD strongly influences individual finances and social economies.
The management of DM can prevent or delay its progression to ESRD, which consequently reduces hospital admissions.2 Studies have proposed that effective DM management can slow the progression of kidney disease, prevent the onset of ESRD,10,11 and reduce the need for hospitalization.12,13 Therefore, it is crucial to understand the management of DM.
DM management is strongly related to continuity of care (COC).14 The COC level refers to the ongoing care partnership between patients and health care providers15 and is important to build physician–patient relationships.16 A long-term physician–patient sustained relationship facilitates enhancing mutual communication, effectively managing diseases, and improving disease outcomes,15,17 particularly in patients with chronic conditions.
Scholars have indicated that the increased continuity of ambulatory care can reduce cardiovascular mortality, cardiovascular events, and health care utilization and costs for patients with newly diagnosed hypertension, DM, and hypercholesterolemia.18 Hussey et al used the Medicare claims database for analyzing data on chronic diseases. They reported that high COC of patients is associated with lower rates of emergency department visits, complications, and episode costs.19 According to our review of relevant literature, no study has yet examined the association between COC and the subsequent development of ESRD. Therefore, this study investigated the association between COC and the risk of ESRD in patients with newly diagnosed type 2 DM.
High COC levels have been reported to be associated with low hospitalization risk13,20,21 and high medication adherence.22,23 Observational studies did not perform random assignment of different groups; therefore, confounding variables may have affected the health outcomes.24 Using traditional statistical methods to reduce bias results in sample size limitations because of the number of variables.24,25 To reduce the effects of confounders, we performed the inverse probability weighted analysis to induce similar covariate distributions between different COC groups. We examined the associations between COC, hospitalization, and ESRD in patients with newly diagnosed type 2 DM.
Methods
Dataset source
In the observational retrospective cohort study, data from 1996 to 2012 were retrieved from the Longitudinal Health Insurance Database 2005 (LHID 2005), which is provided by the National Health Research Institutes in Taiwan. The LHID 2005 consists of 1 million beneficiaries randomly sampled from the National Health Insurance Research Database (NHIRD) at the end of 2005. The NHIRD includes the enrollees’ demographic data, medical service providers and records, medication use, reimbursement amounts, treatment procedures, and disease diagnoses codes (according to the International Classification of Diseases, Ninth Revision, Clinical Modification; ICD-9-CM). The NHIRD has been widely used in many epidemiological studies in Taiwan.26–29 Gender, age, and average insured payroll-related amount distributions do not differ significantly between the patients in the LHID2005 and NHIRD.30 The NHIRD does not contain the personal information of patients, namely, body weight, height, family history, socioeconomic status, genetic factors, laboratory examination results, smoking, and alcohol consumption. Because LHID dataset is the encrypted secondary data, it does not contain any identified patient information. This study was approved by the TMU-Joint Institutional Review Board (approval number 201204036).
Design and study participants
This study enrolled patients who had received a primary diagnosis of type 2 DM (ICD-9-CM 250.xx, excluding type 1 DM [ICD-9-CM 250.x1 or 250.x3]) and had >3 annual physician visits during the study period under the condition that the visit intervals exceeded 28 days. These patients had been treated with antihyperglycemic agents, such as biguanides, sulfonamides, urea derivatives, α-glucosidase inhibitors, thiazolidinediones, and dipeptidyl peptidase-4 between January 1, 2000, and December 31, 2010. The aforementioned criteria were proposed by American Diabetes Association Clinical Practice Recommendations.31 The patients’ first clinical visit was recognized as the onset of DM (referred as index date hereinafter). The patients who had received dialysis treatment before the index date were excluded.
In this study, we used 1 year as the washout period because patients with newly diagnosed DM could be influenced by psychological factors that might produce misleading results regarding the effects of medical treatment.32 Therefore, we measured the patient’s COC and adherence from the second year of the index date of DM. To ensure that the outcomes were caused by COC and adherence, patients who had ESRD within 2 years of the index date were also excluded. The patients with a history of autoimmune disease or cancer within 1 year of the index date were excluded because these diseases were highly related to renal diseases. The patients with <3 physician visits within 2 years of the index day were excluded because it was inappropriate to use COC indicators for patients with fewer visits.18,22 Patients were followed up from the diagnosis time of type 2 DM to the development of ESRD, death, or the end of the study period (December 31, 2012). The patients were censored based on death or the end of the follow-up period.
COC during follow-up
Considering the variation and higher frequency of physician visits in Taiwan, this study used the COC index developed by Bice and Boxerman for measuring the COC, which is the common measure used in COC-related studies.15,17,19,33,34 The index was only calculated for the COC score on the basis of physician visits to Western-medicine doctors for DM. The COC index reflects the distribution of visits to different physicians and number of visits to each physician. The formula of the COC index is as follows:
|
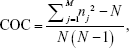
where N is the total number of physician visits, nj is the number of visits to the jth physician, and M is the number of physicians. The COC index value ranges from 0 to 1, with a higher value corresponding to better COC. The COC score of 1 represents the patient visits to the same physician. Consistent with previous studies, we measured DM-related visits’ continuity score from the second to the third year after the first year of the index date and categorized the COC index into 3 equal tertiles (ie, low [0.00–0.43], intermediate [0.43–0.80], and high [0.80–1.00]) according to the distribution of scores across the entire study population because the COC index score lacks inherent clinical relevance.15,21,35,36
Outcome measurements and covariates
The primary outcome was ESRD, defined as patients continuously receiving dialysis treatment for 3 months. The secondary outcome was the first hospitalization caused by DM-related ambulatory care-sensitive condition admissions as defined by the Agency for Healthcare Research and Quality Prevention Quality Indicators, which also state that adequate management and outpatient care can prevent the need for hospitalization.12 Hospitalizations were defined as patients with a hospital stay of >1 day and the main ICD-9-CM diagnosis code for DM with short- or long-term complications (Table S1).
Covariates included age, gender, comorbidities, Charlson comorbidity index, number of antihyperglycemic drugs, number of physician visits, and medication adherence. The identified comorbidities (>3 physician visits; defined using ICD-9-CM codes) with potential influence outcomes in the present study included hypertension, dyslipidemia, gout, and chronic kidney disease (Table S1). The Charlson comorbidity index, which is a scoring system for weighting factors on the important concomitant disease, is defined by the ICD-9-CM.37 The number of antihyperglycemic drugs is a proxy indicator for disease severity; patients used more antihyperglycemic drugs corresponding to more severe disease. All covariates variables were defined in the first year of the index date.
Medication adherence was significantly associated with continuity of care.22,23 Therefore, we also considered the effect of the adherence to antihyperglycemic medication and measured medication adherence from the second to the third year after the first year of the index date. Medication adherence was defined as the medication possession ratio (MPR) to estimate the consumption (prescribed dosage) of antihyperglycemic medication. The MPR was dichotomized: patients with an MPR lower than the cutoff point of 80% were identified as nonadherent.10,38
Statistical analysis
The characteristic data of the study participants were first analyzed. The χ2-tests and one-way analysis of variance test were used to examine the associations between patient characteristics and COC tertiles. Because of the imbalance in the distribution of measured baseline covariates among the COC low, intermediate, and high groups, we applied inverse probability weighting analysis to induce similar covariate distribution between different COC groups’ baseline covariate distributions. Inverse probability weighting is based on the propensity score to receive unbiased estimates of average exposure effects.39,40 Prior evidence suggests that the propensity score model should include the confounders or the covariates affecting outcomes.40,41 Therefore, we included the covariates, such as age, gender, hypertension, dyslipidemia, gout, chronic kidney disease, Charlson comorbidity score, number of antihyperglycemic drugs, number of physician visits, and medication adherence in the propensity score model. In addition, we used the absolute standardized difference to assess the balance of baseline covariates among the 3 COC groups in the inverse probability weighting sample. The absolute standardized mean difference value of ≤10% indicates a negligible difference in covariates.42 We examined the associations between COC, hospitalization, and ESRD in patients with newly diagnosed type 2 DM. To investigate the risk of ESRD and hospitalization, we conducted multivariable analyses with Cox proportional hazards regression with the inverse probability weighting by using propensity scores. To further assess the robustness of our results, we also stratified the study population based on age and the adherence level. Predefined subgroups included age ≤65 years and >65 years and medication adherence and nonadherence. The data were managed using SAS version 9.4 (SAS Institute, Inc., Cary, NC, USA). The results were considered statistically significant when p<0.05.
Results
A total of 26,063 patients with newly diagnosed type 2 DM were included in the cohort (Figure 1). Table 1 presents the baseline characteristics and COC of the study patients. The mean age of the patients was 55.82±11.98 years, and male accounted for 54.02% of the population. The prevalence of comorbidities in the patients was 50.26% for hypertension, 24.26% for dyslipidemia, 8.61% for gout, and 1.97% for chronic kidney disease; 5.29% of the patients used >3 prescriptions of antihyperglycemic drugs, and 71.14% exhibited nonadherence with antihyperglycemic drugs. The mean number of physician visits was 16.96±9.69. The mean COC was 0.61±0.30 of the study patients. With increasing age, the COC tended to decrease. The patients with hypertension, gout, or chronic kidney disease showed lower COC score than did those without hypertension, gout, or chronic kidney disease. The patients with a higher Charlson comorbidity score showed low COC scores. The patients with adherence medication showed a higher COC score than did those with nonadherence medication.
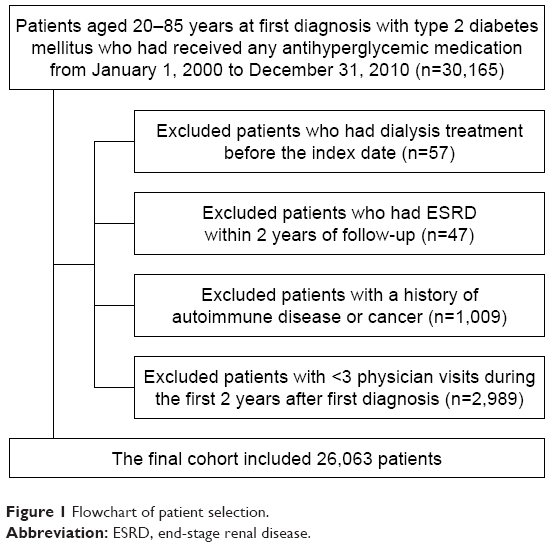 | Figure 1 Flowchart of patient selection. |
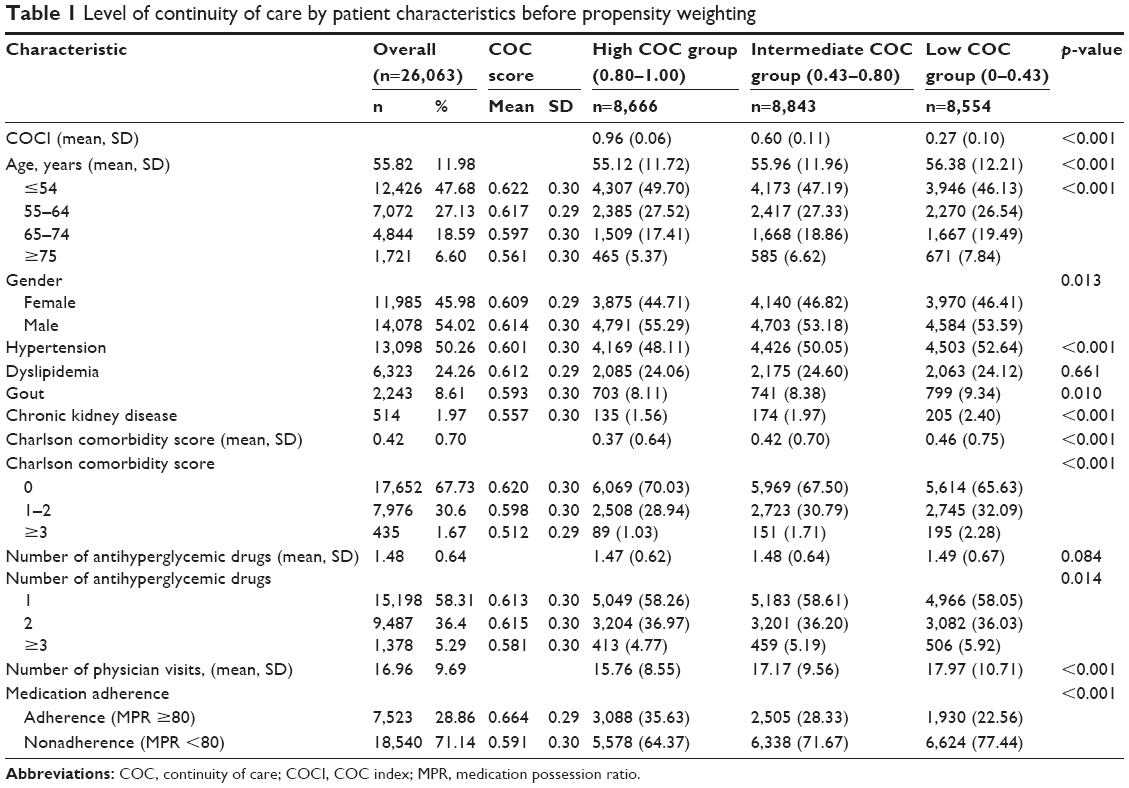 | Table 1 Level of continuity of care by patient characteristics before propensity weighting |
Among 26,063 patients in the overall cohort, 8,666 (33.25%), 8,843 (33.93%), and 8,554 (32.82%) were in the high, intermediate, and low COC groups, respectively. Before applying inverse probability weighting, the patients in the low COC group were older (56.38 [12.21]) than those in the high COC group (55.12 [11.72]) and intermediate COC group (55.96 [11.96]). The lower the COC group is, the higher the proportions of comorbidities (ie, hypertension, gout, and chronic kidney disease) and Charlson comorbidity scores are. Compared with the high and intermediate COC groups, the low COC group had a higher number of physician visits, a higher number of antihyperglycemic drugs, and a higher proportion of medication nonadherence.
After applying inverse probability weighting, the 3 COC groups were well balanced in all covariates (Figure 2). The mean age, gender proportions, hypertension, dyslipidemia, gout, and chronic kidney disease among the 3 COC groups were comparable. Moreover, the mean Charlson comorbidity score, proportions of the number of antihyperglycemic drugs, and medication adherence among the 3 COC groups became similar. On examining the standardized differences among the 3 COC groups (with the high COC group as the reference), the values for all covariates were found to be <10% (Table S2).
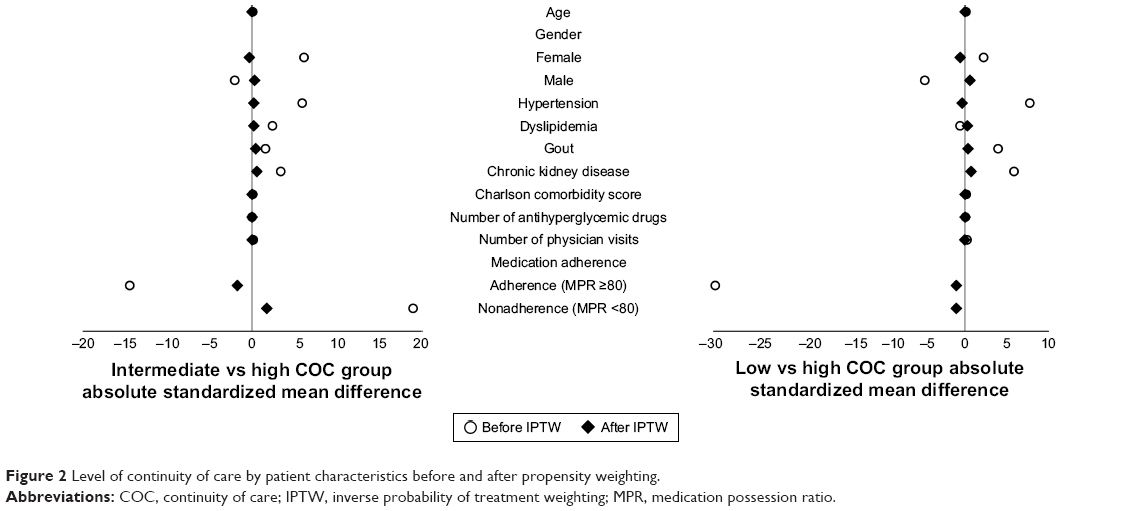 | Figure 2 Level of continuity of care by patient characteristics before and after propensity weighting. |
The number of ESRD patients in the high, intermediate, and low COC groups were 92 (22.33%), 130 (31.55%), and 190 (46.12%), and the mean follow-up periods for the 3 groups were 7.13, 7.12, and 7.27 years, respectively. The number of hospitalization patients for the high, intermediate, and low COC groups were 351 (24.39%), 422 (29.33%), and 666 (46.28%), and the mean follow-up periods were 7.01, 6.95, and 6.99 years, respectively (Table S3).
The Kaplan–Meier analysis showed a significant difference in the ESRD survival and hospitalization survival among the COC groups (Figure 3). After using inverse probability weighting and adjusting for competing risk of death, the intermediate and low COC groups were significantly associated with an increased risk of ESRD compared with the high COC group (adjusted hazard ratio [aHR] for intermediate COC group was 1.36 [95% CI, 1.03–1.80] and low COC group was 1.76 [95% CI 1.35–2.30]). The intermediate and low COC groups were also significantly associated with the subsequent hospitalization before and after adjustment, compared with the high COC group (adjusted HRs for intermediate and low COC groups were 1.15 [95% CI, 0.99–1.33] and 1.72 [1.50–1.97]). The results of inverse probability weighting were very similar to those obtained without inverse probability weighting (Table 2).
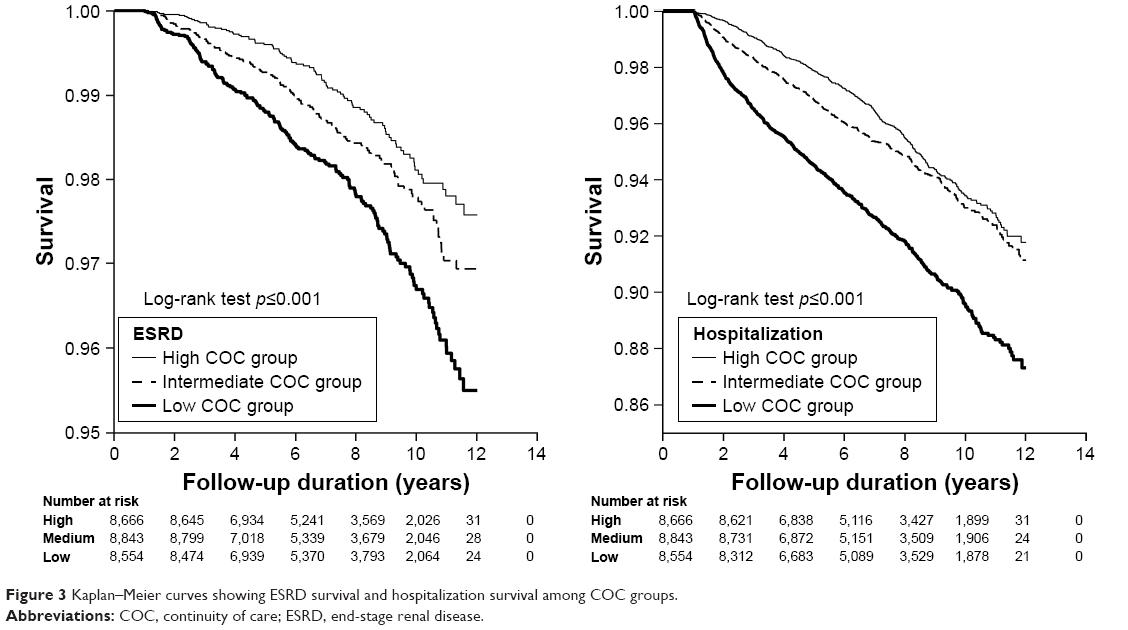 | Figure 3 Kaplan–Meier curves showing ESRD survival and hospitalization survival among COC groups. |
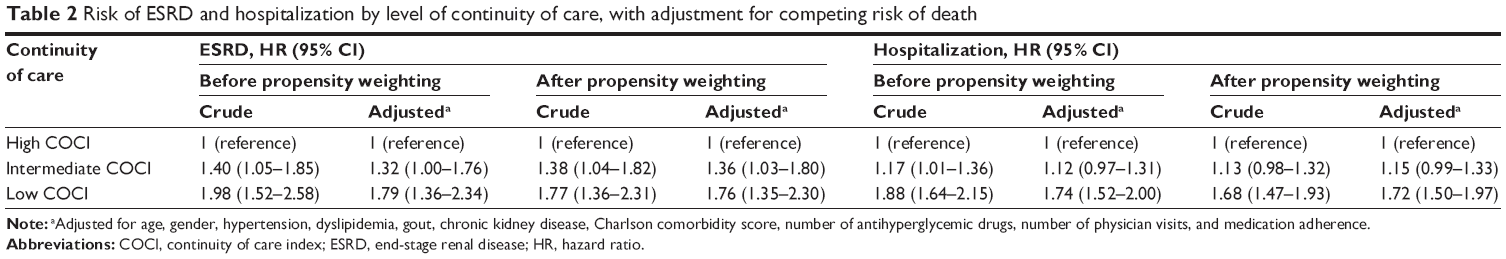 | Table 2 Risk of ESRD and hospitalization by level of continuity of care, with adjustment for competing risk of death |
Table 3 showed the interactive effects of hospitalization and COC level on the risk of ESRD. We treated the nonsubsequent hospitalization and high COC groups as the reference group. Compared to the reference group, the patients with subsequent hospitalization and low COC had the highest risk of ESRD, after using inverse probability weighting with an adjusted HR of 13.06 (95% CI, 9.29–18.35).
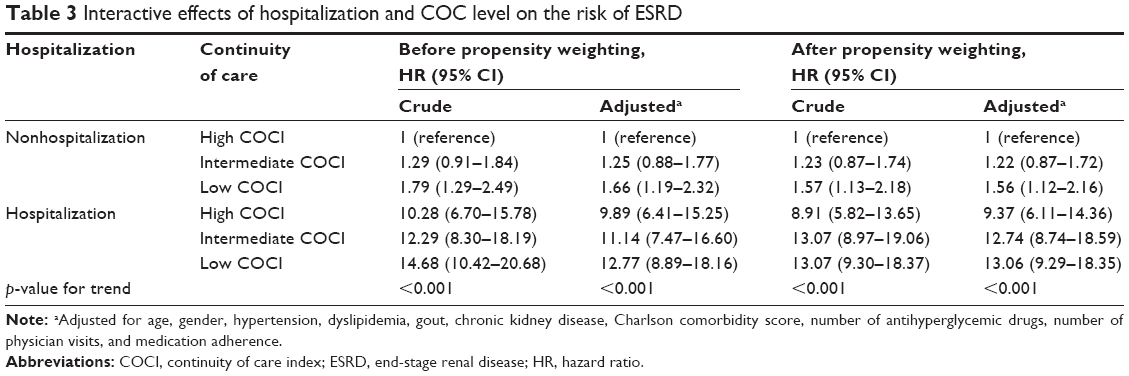 | Table 3 Interactive effects of hospitalization and COC level on the risk of ESRD |
To further assess the robustness of our results, we stratified the study population by age and medication adherence. Among patients aged <65 years with nonadherence, intermediate and low COC groups were significantly associated with the increased risk of ESRD, compared with the high COC group. No significant association was present between COC and ESRD occurrence in patients aged >65 years with adherence. In addition, the low COC group was significantly associated with subsequent hospitalization in all subgroups compared with the high COC group (Figure 4).
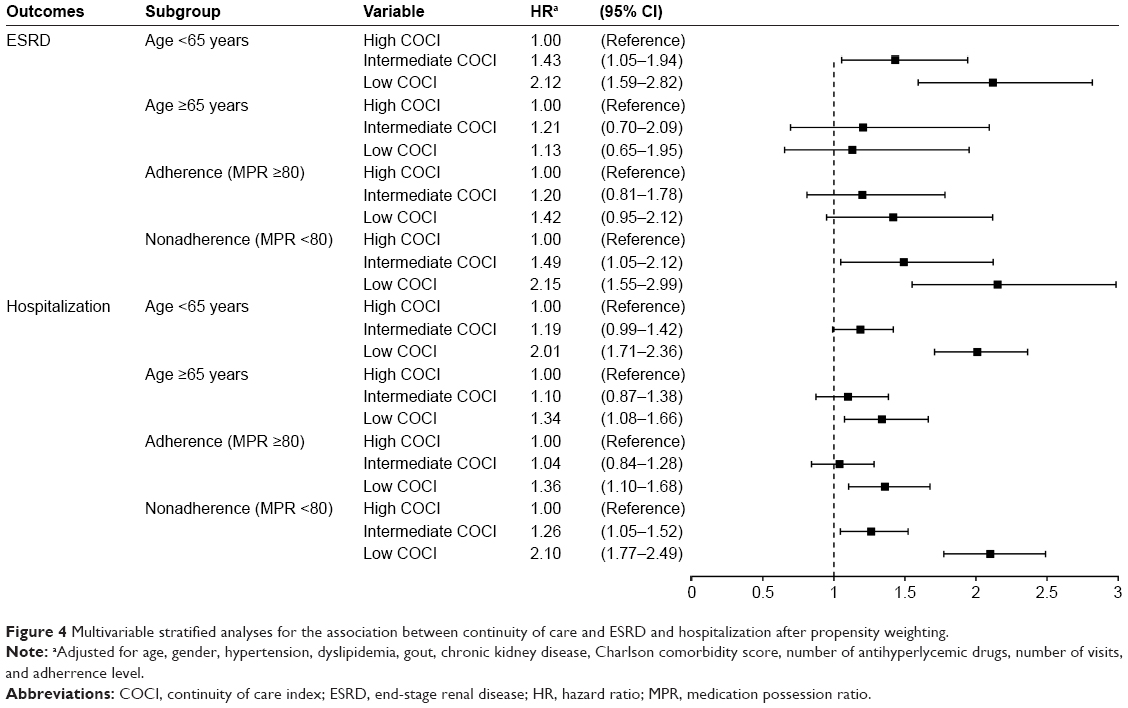 | Figure 4 Multivariable stratified analyses for the association between continuity of care and ESRD and hospitalization after propensity weighting. |
Discussion
This large cohort study using inverse probability weighted analysis revealed that the low COC level was associated with the increased risk of ESRD and subsequent hospitalization in patients with newly diagnosed type 2 DM. With regard to the interactive effects of the hospitalization and COC level, the subsequent hospitalization and low COC level was associated with the highest risk of the ESRD. In addition, the results revealed the inverse association between COC values and comorbidities. Through subgroup analyses, low COC and intermediate COC levels were associated with the increased risk of ESRD in patients aged <65 years or nonadherence of medication. The low COC level was associated with the subsequent hospitalization in all subgroups.
Our results suggested that the low COC level leads to renal progression for patients with DM. A possible explanation is that COC indirectly affected the therapeutic relationship, mutual trust, understanding, communication quality, and satisfaction between patients and health care providers.15,16,43 A qualitative study interviewing 25 patients with DM indicated that relational continuity between patients and physicians is determined by whether patients trust the technical abilities of usual providers.44 Therefore, patients with DM without relational continuity might have poor quality of glycemic control,14 which consequently negatively affects renal function. As in previous studies, glycemic control was associated with renal progression45 and ESRD11 in patients with DM in this study.
Compared with the high COC level, the intermediate and low COC levels were associated with the increased subsequent hospitalization for patients with DM; these results are similar to those in previous studies.13,20,21 Hussey et al examined patients with congestive heart failure, chronic obstructive pulmonary disease, or type 2 DM, and reported that the patients with lower odds of hospitalization and complications have higher levels of care continuity.19 Recently, a study on the diagnosis of dementia Medicaid beneficiaries indicated that a low COC level is associated with high rates of hospitalization, emergency department visits, and testing and higher health care costs.16
We noticed that the low COC level is associated with ESRD and subsequent hospitalization in patients aged <65 years with DM or medication nonadherence. The possible explanation is that patients with early-onset DM have an aggressive disease phenotype than do those with late-onset DM and have a higher risk of the development and progression of complications.46,47 Another study on type 2 DM indicated that early-onset patients had a 20% higher risk of microalbuminuria compared with usual onset patients.48 In addition, Chen and Cheng reported that adherence to antidiabetic medications was positively associated with the degree of COC in patients with newly diagnosed DM.22 This positive association between COC and medication adherence may be because patients and physicians share information and the common objective of treating the disease.49 Therefore, a decreased COC level and adherence might strongly affect disease management, which consequently led to poor health care outcomes. A previous study has indicated that nonadherence to antihyperglycemic medications significantly increase the risk of ESRD.10
The advantages of the current study include the utilization of the LHID2005, which has a large sample size from a comprehensive nationwide database, which enabled our study patients to be highly representative of the entire population of Taiwan. To eliminate the possibility of selection bias, we included only patients newly diagnosed with DM between 2000 and 2010. In addition, we applied inverse probability weighting analysis to induce similar covariate distribution between different COC groups, reducing the effects of confounding in this observational study.
The study has several limitations. The claims data did not include biochemical data on glucose levels and renal function, such as fasting glucose, glycated hemoglobin, serum creatinine, and estimated glomerular filtration rate. Therefore, we could not assess the potential effect by renal function and control of blood glucose on the relationship between COC and the subsequent development of ESRD and hospitalization. However, we used the number of antihyperglycemic drugs as a proxy indicator for disease severity.10 In addition, we lacked details on several potential confounders, namely, level of physicians, body weight, height, family history, socioeconomic status, genetic factors, laboratory examination results, lifestyle, smoking, and alcohol consumption. The aforementioned factors may contribute to outcomes. To reduce these biases, we used inverse probability weighting and multivariable analysis, which were widely used in previous studies that have used claims data to adjust for potential confounders.16,28,29 Exclusion of patients who have less than 3 physician visits from the second to the third year after the first year of the index date might limit the representativeness of the study subjects. Finally, the finding could be different for treatment of type 2 DM worldwide because Taiwan’s health resource may be different from other countries. The generalizability of our findings to DM patients around the world might be limited. Thus, caution needs to be taken because of heath resource differences.
In conclusion, this study offers evidence demonstrating that COC is related to ESRD onset and subsequent hospitalization among patients with DM. We observed that COC has significant adverse effects, especially in patients aged <65 years or nonadherence of medication. Therefore, to reduce the risk of ESRD, we recommended that clinicians should continuously follow-up on the conditions of patients with DM and build trust and understanding between each other. In addition, when patients with type 2 DM should return to the same doctor and adhere to drug therapy, they can effectively reduce the subsequent hospitalization and prevent the onset of ESRD.
Disclosure
The authors report no conflicts of interest in this work.
References
World Health Organization. Global Report on Diabetes; 2016. Available from: http://apps.who.int/iris/bitstream/10665/204871/1/9789241565257_eng.pdf. Accessed February 26, 2018. | ||
Collaboration N. Worldwide trends in diabetes since 1980: a pooled analysis of 751 population-based studies with 4.4 million participants. Lancet. 2016;387(10027):1513–1530. | ||
Seuring T, Archangelidi O, Suhrcke M. The economic costs of type 2 diabetes: a global systematic review. Pharmacoeconomics. 2015;33(8):811–831. | ||
Shen FC, Chen CY, Su SC, Liu RT. The prevalence and risk factors of diabetic nephropathy in Taiwanese type 2 diabetes – a hospital based study. Acta Nephrologica. 2009;23:90–95. | ||
Guan LZ, Tong Q, Xu J. Elevated serum levels of mannose-binding lectin and diabetic nephropathy in type 2 diabetes. PLoS One. 2015;10(3):e0119699. | ||
Elmarakby AA, Sullivan JC. Relationship between oxidative stress and inflammatory cytokines in diabetic nephropathy. Cardiovasc Ther. 2012;30(1):49–59. | ||
American Diabetes Association. Standards of medical care diabetes-2015. Diabetes care. 2015;38:S1–S94. | ||
Kidney Disease: Improving Global Outcomes (KDIGO) CKD Work Group. KDIGO 2012 clinical practice guideline for the evaluation and management of chronic kidney disease. Kidney Int Suppl. 2013;3(1):1–150. | ||
Collins AJ, Foley RN, Chavers B, et al. US renal data system 2013 annual data report. Am J Kidney Dis. 2014;63(1 Suppl):A7. | ||
Chang PY, Chien LN, Lin YF, Chiou HY, Chiu WT. Nonadherence of oral antihyperglycemic medication will increase risk of end-stage renal disease. Medicine. 2015;94(47):e2051. | ||
Perkovic V, Heerspink HL, Chalmers J, et al. Intensive glucose control improves kidney outcomes in patients with type 2 diabetes. Kidney Int. 2013;83(3):517–523. | ||
Agency for Healthcare Research and Quality. Prevention Quality Indicators Overview. 2016. Available from: http://www.qualityindicators.ahrq.gov/modules/pqi_overview.aspx. Accessed December 7, 2016. | ||
Lin W, Huang IC, Wang SL, Yang MC, Yaung CL. Continuity of diabetes care is associated with avoidable hospitalizations: evidence from Taiwan’s National Health Insurance scheme. Int J Qual Health Care. 2010;22(1):3–8. | ||
Parchman ML, Pugh JA, Noel PH, Larme AC. Continuity of care, self-management behaviors, and glucose control in patients with type 2 diabetes. Med Care. 2002;40(2):137–144. | ||
Lin IP, Wu SC, Huang ST. Continuity of care and avoidable hospitalizations for chronic obstructive pulmonary disease (COPD). J Am Board Fam Med. 2015;28(2):222–230. | ||
Amjad H, Carmichael D, Austin AM, Chang CH, Bynum JP. Continuity of care and health care utilization in older adults with dementia in fee-for-service medicare. JAMA Int Med. 2016;176(9):1371–1378. | ||
Jee SH, Cabana MD. Indices for continuity of care: a systematic review of the literature. Med Care Res Rev. 2006;63(2):158–188. | ||
Shin DW, Cho J, Yang HK, et al. Impact of continuity of care on mortality and health care costs: a nationwide cohort study in Korea. Ann Fam Med. 2014;12(6):534–541. | ||
Hussey PS, Schneider EC, Rudin RS, Fox DS, Lai J, Pollack CE. Continuity and the costs of care for chronic disease. JAMA Int Med. 2014;174(5):742–748. | ||
Cho KH, Lee SG, Jun B, Jung BY, Kim JH, Park EC. Effects of continuity of care on hospital admission in patients with type 2 diabetes: analysis of nationwide insurance data. BMC Health Serv Res. 2015;15:107. | ||
Chen CC, Chen SH. Better continuity of care reduces costs for diabetic patients. Am J Manag Care. 2011;17(6):420–427. | ||
Chen CC, Cheng SH. Continuity of care and changes in medication adherence among patients with newly diagnosed diabetes. Am J Manag Care. 2016;22(2):136–142. | ||
Hong JS, Kang HC. Relationship between continuity of ambulatory care and medication adherence in adult patients with type 2 diabetes in Korea: a longitudinal analysis. Medical Care. 2014;52(5):446–453. | ||
Reeve BB, Smith AW, Arora NK, Hays RD. Reducing bias in cancer research: application of propensity score matching. Health Care Financ Rev. 2008;29(4):69–80. | ||
D’Agostino RB Jr. Propensity score methods for bias reduction in the comparison of a treatment to a non-randomized control group. Stat Med. 1998;17(19):2265–2281. | ||
Wu CY, Shieh JJ, Shen JL, Liu YY, Chang YT, Chen YJ. Association between antidiabetic drugs and psoriasis risk in diabetic patients: results from a nationwide nested case-control study in Taiwan. J Am Acad Dermatol. 2015;72(1):123–130. | ||
Wu CY, Chen YJ, Ho HJ, et al. Association between nucleoside analogues and risk of hepatitis B virus-related hepatocellular carcinoma recurrence following liver resection. JAMA. 2012;308(18):1906–1914. | ||
Wu CY, Chen DY, Shen JL, et al. The risk of cancer in patients with rheumatoid arthritis taking tumor necrosis factor antagonists: a nationwide cohort study. Arthritis Res Ther. 2014;16(5):449. | ||
Chan YH, Yen KC, See LC, et al. Cardiovascular, bleeding, and mortality risks of dabigatran in asians with nonvalvular atrial fibrillation. Stroke. 2016;47(2):441–449. | ||
National Health Insurance Research Database. Introduction to the National Health Insurance Research Database (NHIRD). Taiwan; 2016. Available from: http://nhird.nhri.org.tw/date_01_en.html. Accessed July 12, 2016. | ||
American Diabetes Association. Diagnosis and classification of diabetes mellitus. Diabetes Care. 2010;33(Suppl 1):S62–S69. | ||
Garay-Sevilla ME, Porras JS, Malacara JM. Coping strategies and adherence to treatment in patients with type 2 diabetes mellitus. Rev Invest Clin. 2011;63(2):155–161. | ||
Bice TW, Boxerman SB. A quantitative measure of continuity of care. Med Care. 1977;15(4):347–349. | ||
Cheng SH, Chen CC. Effects of continuity of care on medication duplication among the elderly. Med Care. 2014;52(2):149–156. | ||
Hong JS, Kang HC, Kim J. Continuity of care for elderly patients with diabetes mellitus, hypertension, asthma, and chronic obstructive pulmonary disease in Korea. J Korean Med Sci. 2010;25(9):1259–1271. | ||
Cheng SH, Chen CC, Hou YF. A longitudinal examination of continuity of care and avoidable hospitalization: evidence from a universal coverage health care system. Arch Intern Med. 2010;170(18):1671–1677. | ||
Deyo RA, Cherkin DC, Ciol MA. Adapting a clinical comorbidity index for use with ICD-9-CM administrative databases. J Clin Epidemiol. 1992;45(6):613–619. | ||
Roy L, White-Guay B, Dorais M, Dragomir A, Lessard M, Perreault S. Adherence to antihypertensive agents improves risk reduction of end-stage renal disease. Kidney Int. 2013;84(3):570–577. | ||
Austin PC. An introduction to propensity score methods for reducing the effects of confounding in observational studies. Multivariate Behav Res. 2011;46(3):399–424. | ||
Austin PC, Stuart EA. Moving towards best practice when using inverse probability of treatment weighting (IPTW) using the propensity score to estimate causal treatment effects in observational studies. Stat Med. 2015;34(28):3661–3679. | ||
Austin PC, Grootendorst P, Anderson GM. A comparison of the ability of different propensity score models to balance measured variables between treated and untreated subjects: a Monte Carlo study. Stat Med. 2007;26(4):734–753. | ||
Austin PC. The use of propensity score methods with survival or time-to-event outcomes: reporting measures of effect similar to those used in randomized experiments. Stat Med. 2014;33(7):1242–1258. | ||
Reddy A, Pollack CE, Asch DA, Canamucio A, Werner RM. The effect of primary care provider turnover on patient experience of care and ambulatory quality of care. JAMA In Med. 2015;175(7):1157–1162. | ||
Naithani S, Gulliford M, Morgan M. Patients’ perceptions and experiences of ‘continuity of care’ in diabetes. Health Expect. 2006;9(2):118–129. | ||
Chang PY, Chien LN, Lin YF, Chiu WT, Chiou HY. Simultaneous control of glycemic, blood pressure, and lipid significantly reduce the risk of renal progression in diabetes patients. Eur J Intern Med. 2016;36:87–92. | ||
Song SH, Hardisty CA. Early onset type 2 diabetes mellitus: a harbinger for complications in later years – clinical observation from a secondary care cohort. QJM. 2009;102(11):799–806. | ||
Pinhas-Hamiel O, Zeitler P. Acute and chronic complications of type 2 diabetes mellitus in children and adolescents. Lancet. 2007;369(9575):1823–1831. | ||
Hillier TA, Pedula KL. Complications in young adults with early-onset type 2 diabetes: losing the relative protection of youth. Diabetes Care. 2003;26(11):2999–3005. | ||
Donaldson MS. Continuity of care: a reconceptualization. Med Care Res Rev. 2001;58(3):255–290. |
Supplementary materials
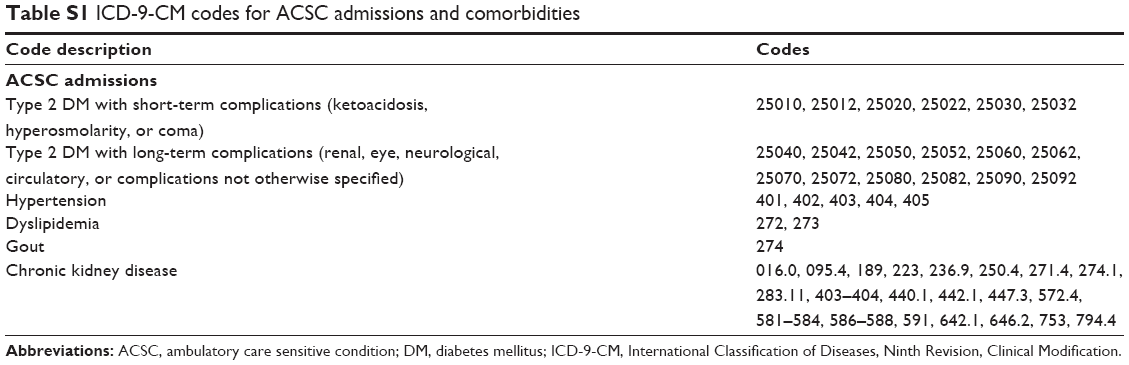 | Table S1 ICD-9-CM codes for ACSC admissions and comorbidities |
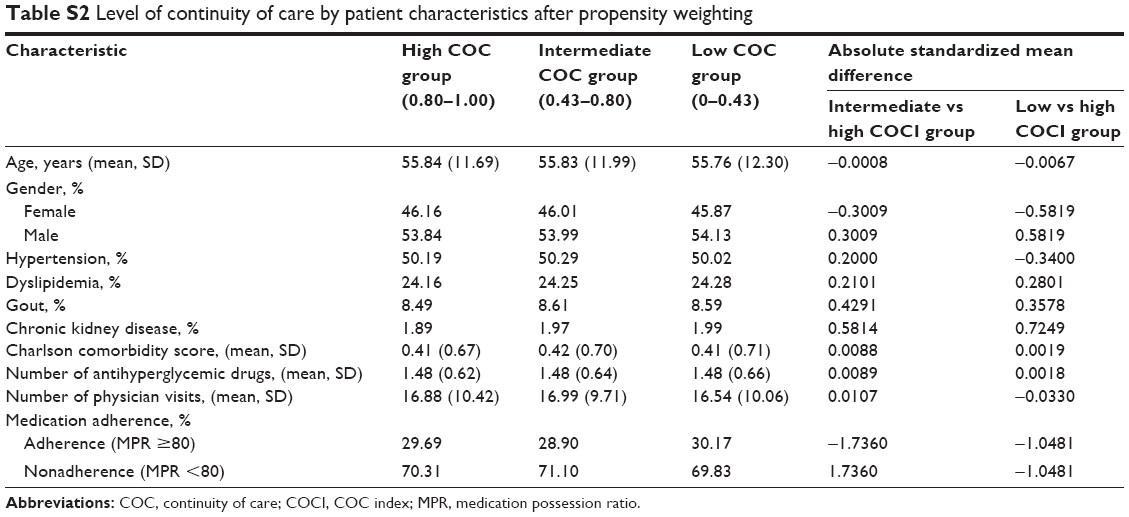 | Table S2 Level of continuity of care by patient characteristics after propensity weighting |
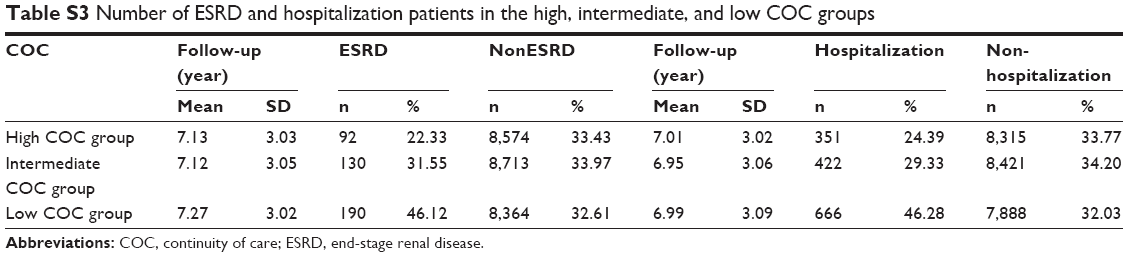 | Table S3 Number of ESRD and hospitalization patients in the high, intermediate, and low COC groups |
 © 2018 The Author(s). This work is published and licensed by Dove Medical Press Limited. The
full terms of this license are available at https://www.dovepress.com/terms.php
and incorporate the Creative Commons Attribution
- Non Commercial (unported, v3.0) License.
By accessing the work you hereby accept the Terms. Non-commercial uses of the work are permitted
without any further permission from Dove Medical Press Limited, provided the work is properly
attributed. For permission for commercial use of this work, please see paragraphs 4.2 and 5 of our Terms.
© 2018 The Author(s). This work is published and licensed by Dove Medical Press Limited. The
full terms of this license are available at https://www.dovepress.com/terms.php
and incorporate the Creative Commons Attribution
- Non Commercial (unported, v3.0) License.
By accessing the work you hereby accept the Terms. Non-commercial uses of the work are permitted
without any further permission from Dove Medical Press Limited, provided the work is properly
attributed. For permission for commercial use of this work, please see paragraphs 4.2 and 5 of our Terms.