")
Back to Journals » Eye and Brain » Volume 9
Contextual modulation revealed by optical imaging exhibits figural asymmetry in macaque V1 and V2
Authors Zarella MD, Ts'o DY
Received 2 February 2016
Accepted for publication 2 February 2017
Published 11 April 2017 Volume 2017:9 Pages 1—12
DOI https://doi.org/10.2147/EB.S105609
Checked for plagiarism Yes
Review by Single anonymous peer review
Peer reviewer comments 3
Editor who approved publication: Professor Margaret Wong-Riley
Mark D Zarella, Daniel Y Ts’o
Department of Neurosurgery, SUNY Upstate Medical University, Syracuse, NY, USA
Abstract: Neurons in early visual cortical areas are influenced by stimuli presented well beyond the confines of their classical receptive fields, endowing them with the ability to encode fine-scale features while also having access to the global context of the visual scene. This property can potentially define a role for the early visual cortex to contribute to a number of important visual functions, such as surface segmentation and figure–ground segregation. It is unknown how extraclassical response properties conform to the functional architecture of the visual cortex, given the high degree of functional specialization in areas V1 and V2. We examined the spatial relationships of contextual activations in macaque V1 and V2 with intrinsic signal optical imaging. Using figure–ground stimulus configurations defined by orientation or motion, we found that extraclassical modulation is restricted to the cortical representations of the figural component of the stimulus. These modulations were positive in sign, suggesting a relative enhancement in neuronal activity that may reflect an excitatory influence. Orientation and motion cues produced similar patterns of activation that traversed the functional subdivisions of V2. The asymmetrical nature of the enhancement demonstrated the capacity for visual cortical areas as early as V1 to contribute to figure–ground segregation, and the results suggest that this information can be extracted from the population activity constrained only by retinotopy, and not the underlying functional organization.
Keywords: striate, extrastriate, segmentation, figure–ground, functional organization
Introduction
Cortical areas early in the visual hierarchy have been implicated in figure–ground processing and the extraction of information about surfaces and their boundaries. Some neurons in V1 are well equipped to identify discontinuities in textures often associated with the boundary between adjacent or occluding surfaces. These neurons become highly suppressed by large homogeneous fields that extend into their extraclassical surrounds, and correspondingly often become unsuppressed by the background if it is different from the foreground in some feature.1–8 Therefore, it has been hypothesized that V1 neurons, with small classical receptive fields, make use of their large extraclassical surrounds to perform computations important for figure–ground segregation,9 allowing them to encode information individually about the surface configuration of the visual scene.
Although modulations from long-range influences have been demonstrated extensively in single V1 units, it remains unclear how this response property extends to the population and whether it depends on the spatial organization of the cortex and its associated functional specialization. Using visual evoked potentials, Bach and Meigen10 showed that response magnitudes in V1 were affected by the spatial configuration of the stimulus, revealing that figure–ground interactions evoked higher-magnitude responses than homogeneous fields. Although this study very effectively demonstrated that aggregate activity was increased in the presence of figure–ground cues, the spatial limitations of the technique make it unclear whether the observed enhancement was due to extraclassical modulation or was dominated by classical receptive field responses to the figure–ground border. This technique also lacked the spatial resolution to reveal a potential dependence of this enhancement on the functional organization of the cortical areas examined, including the activity across functional subdivisions and retinotopic enhancement patterns.
Optical imaging provides the opportunity to examine extraclassical modulation at the level of neuronal ensembles while preserving the spatial distributions of these signals at a scale fine enough to discriminate between figural and background responses. Here, we report the existence of extraclassical modulation in the population activity of V1 and V2 related to the spatial configuration of the stimulus. The stimulus, composed of drifting line gratings in which only the orientation or motion differed from the background, evoked an increase in activity consistent with single-unit studies. We found that response enhancement was confined to the putative figural region in figure–ground arrangements, demonstrating a spatial asymmetry that made it possible to distinguish between activity belonging to the figural and background regions. Although the distribution of response enhancement strongly obeys the retinotopic organization of these areas, it appears to be less dependent on the well-known compartmentalization of V2. These results establish a possible role for early visual cortical areas in figure–ground segregation that is retinotopically specific, but generalizes across the local organization of the cortex.
Materials and methods
Optical imaging
We used intrinsic optical signal imaging to compare activations in macaque primary visual cortex in response to stimulus configurations presented in a figure–ground arrangement. Optical imaging consists of measuring the light reflected from an exposed region of cortex and correlating the reflectance patterns with the onset of a visual stimulus. Hemodynamic changes that accompany neuronal activation manifest as reflectance patterns that can be detected with sensitive photodetection apparatus, such as an array of photodiodes or a camera.11 We generated high-spatial-resolution images using a charge-coupled device (CCD) camera (Photometrics, Tucson, AZ, US) sensitive to the near-infrared spectrum.
Surgical preparation
Reflectance images were acquired from the exposed cortices of five macaque monkeys. Monkeys were anesthetized and paralyzed with an intravenous infusion of sodium thiopental and vecuronium bromide. Heart rate, expired CO2, and body temperature were monitored throughout the experiment. A craniotomy and duratomy were performed to expose a ~1 cm2 region of cortex just posterior to the lunate sulcus to reveal areas V1 and V2 within approximately 5° eccentricity. A sealed chamber was implanted over the craniotomy site and filled with silicone oil to reduce the movement of the cortex associated with respiration and pulse. We positioned the camera above the chamber to image the underlying cortex while the monkey viewed stimuli presented on a monitor 114 cm away. The eyes were converged to a point at the center of the screen with the aid of a Risley prism. Eyelids were sutured open, and atropine and neosynephrine drops were applied to the eyes to dilate the pupils and resist accommodation. Contact lenses were fitted with the appropriate refractive power to ensure that the stimulus falling on the retina was in focus. This was verified with an ophthalmoscope, as well as estimated based on the sizes of V1 receptive fields measured electrophysiologically. All surgical procedures were approved by the institutional review board at SUNY Upstate Medical University. All animal-handling procedures were performed according to the Guide for the Care and Use of Laboratory Animals of the National Institutes of Health and followed the guidelines of the Animal Welfare Act.
Visual stimuli
Stimuli were constructed from drifting line gratings (line width 3 pixels, spatial frequency 0.85 cycles/°, temporal frequency 3 Hz) displayed at nearly 100% contrast and at one of four orientations separated by 45°: horizontal, vertical, and two oblique orientations. The direction of motion of the gratings alternated at 0.5-second intervals during each trial. The gratings were used in four different stimulus configurations: 1) a full-field homogeneous grating that encompassed the central 16° of visual space; 2) a small square-spot grating surrounded by a blank field; 3) a full-field stimulus composed of a square grating identical in size and position to the spot stimulus, but surrounded by a grating of opposite orientation (termed the “orientation-contrast condition”); and 4) a stimulus configuration as in 3, but instead surrounded by a grating of the same orientation and moving in the opposite direction to that of the center (termed the “motion-contrast condition”). The size of the center patch was chosen to meet two criteria. First, it had to be small enough so that both the center and background responses could be visualized in the craniotomy window simultaneously. Second, it had to be larger than typical classical receptive-field diameters at the eccentricities examined, to be able to investigate extraclassical receptive-field effects. These constraints typically resulted in center patch sizes of approximately 2° in visual angle.
The location at which the spot stimulus was to be placed on the screen was determined before optical imaging took place. We identified the location in visual space that corresponded to the retinotopic position of the exposed cortex through electrophysiological means, by hand-mapping the receptive fields of cells before and after the optical imaging session. The purpose of recording after the session was to ensure that eye position did not drift over the course of the experiment. This procedure also helped us fine-tune eye convergence by separately measuring the receptive-field positions in each eye and adjusting the prism as necessary.
Stimuli were presented monocularly in random sequence with the aid of a shutter system that positioned an opaque panel in front of the unstimulated eye throughout the duration of each trial. In total, 33 different stimulus presentations were used: four orientations × four stimulus configurations x two monocular presentations (left/right) + one blank control, where no stimulus appeared. Each stimulus presentation lasted 3.5 seconds and was separated by a 5.5-second interstimulus interval, during which both eye shutters remained closed.
Image acquisition and analysis
For each trial, the cortex was illuminated by 630 nm light, and ten images were obtained at a period of 0.35 seconds, starting 0.7 seconds prior to the onset of the stimulus. Therefore, for each trial, two prestimulus frames were recorded, and the remaining frames were acquired with a stimulus present. The CCD camera accumulated the incident light throughout the capture period, such that each image obtained consisted of the temporal sum of all captured light in the 0.35-second period that preceded it. Images were combined in blocks of four, so that each recorded data point represented the mean of four identical trials.
To generate functional maps, poststimulus frames were averaged together, and the average of the prestimulus frames was subtracted to generate a fractional change in reflectance value:
|
|
For most analyses, images obtained separately from left- and right eye stimulation were averaged. Maps representing ocular dominance, on the other hand, were formed by subtracting images obtained during right-eye stimulation from images obtained during left-eye stimulation. Ocular dominance maps were summed across all four orientations tested, mitigating any potential confound with orientation maps. These maps helped us to identify the location of the V1–V2 border by virtue of the fact that V2 lacks organization for ocular dominance.12 Likewise, orientation maps were generated by subtracting orthogonal orientations while averaging across left- and right-eye trials.
ROC analysis
Central to the aims of this work was the ability to compare the strength of activation across the cortex for two different stimulus conditions across repeated trials. We performed receiver-operating characteristic (ROC) analysis to determine which pixels in the image were more strongly activated by one condition than the other. By computing the area under the ROC curve (AUC) derived from the two conditions being compared, we quantified the difference in activation of a single pixel within the context of the underlying noise properties of that pixel. For clarity, AUC values are graphically represented as pseudocolor images, with the color map derived from ramps of full-width half-maximum values of 0.28 centered on AUC values of R 0.75, G 0.5, and B 0.25.
Regions of interest
In order to quantify the activation strength within a particular locale, regions of interest (ROIs) were selected in various parts of the image to represent putative figural- and background-representing locations. We used spot-activation maps (ie, spot-condition versus homogeneous-condition AUC maps, eg, Figure 1A) to determine the positions and shapes of these ROIs using an automated procedure. This procedure consisted of first low-pass filtering the image using a Gaussian kernel with σ=2 pixels, and creating a binary mask by passing the activation map through a threshold function. The threshold was chosen for each session to minimize the intraclass variance of the black and white pixels, but was not allowed to exceed 0.6. To form a singular contiguous mask, gaps in the binary mask were filled by setting equal to one all pixels bounded entirely by other pixels that were equal to one. The resultant binary mask defined the outer contours of the figural ROI. An ellipse was placed elsewhere in the image manually to define the background ROI. When possible, it was placed at least two hypercolumns in distance away from the edge of the corresponding figural ROI and positioned so that it contained a minimal number of vascular artifacts. Background ROIs were always placed in homogeneous condition-preferring regions, as assessed by the spot-activation map. A representative pair of ROIs using this procedure is shown in Figure 1A.
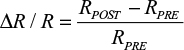
 | Figure 1 Contextual modulation in V1. Notes: (A) A representative spot-activation map from area V1 of monkey 1,047 was taken from the region shown in the inset. The stimulus-spot size was 2°. The value of each pixel represents the area under the receiver-operating characteristic curve (AUC) computed from six blocks of four trials each. Figural (Fig) and background (Bkg) regions of interest are indicated. Scale bar 1 mm. (B) The time courses of the average AUC values within the Fig and Bkg regions of interest in A, normalized by the first prestimulus frame, show the divergence of the responses to the two stimuli. The stimulus appeared at t=0 and persisted throughout the remainder of the time course. Gray shading represents 1 standard deviation. Time values are rounded for clarity. |
To understand the patterns of figural enhancement as they relate to the organization of stripes in V2, the extent of enhancement perpendicular to the orientation of stripes was measured in the four monkeys in which V2-imaging data were obtained. The extent of activation was quantitatively assessed by fitting an ellipse with the same normalized second central moments as the figural ROI, and measuring the length of its axis parallel to the V1–V2 border, which runs approximately perpendicularly to the orientation of stripes near the border.13 Although we did not endeavor to measure stripe widths in each animal in this study, we estimated them in one case (monkey 1,032) that exhibited reliable orientation maps and distinct raw-activation maps, and found our estimate to be consistent with those reported previously in the macaque using optical imaging. Since orientation maps are absent in thin stripes,14–16 and since the overall strength of activation measured with optical imaging is typically greater in thin and thick stripes than in pale stripes,12,17 we used these factors in tandem to estimate stripe widths for this particular experimental session.
Results
Our primary objective was to compare the response magnitudes of figure–ground arrangements to those of homogeneous fields. We hypothesized that figure–ground stimuli produce greater activation than homogeneous stimuli, supporting the notion that feature discontinuities associated with surface boundaries evoke increases in neuronal activity, and highlighting the ubiquitous nature of extraclassical modulation in early cortical areas. Activation strength was measured in areas V1 and V2 using homogeneous, spot, orientation-contrast, and motion-contrast stimulus conditions, each composed of drifting line gratings incorporating four different base orientations. The orientation-contrast and motion-contrast conditions produce the percept of a small figural region superimposed on a much larger background, and served as the figure–ground conditions. The spot condition, the only one of the four that lacked a background, was the same size as the figural region in the figure–ground conditions, and was included to aid in identifying the retinotopic location of the figural region.
We obtained images from four V1 exposures and four V2 exposures from a total of five monkeys (in three monkeys, we were able to simultaneously image both V1 and V2). In four monkeys, we probed extraclassical modulation using both orientation-contrast and motion-contrast configurations; in the fifth monkey, orientation contrast only was tested. The activation strength for each pixel was compared across conditions by computing the AUC generated from repeated measurements during the session. In Figure 1A, a map of AUC values derived from the spot and homogeneous conditions (termed “spot-activation map”) is shown for a single experimental session. Pixels with AUC values >0.5 were more strongly activated by the spot condition, whereas pixels with AUC values <0.5 were more strongly activated by the homogeneous condition. AUC values tended to diverge from the neutral value of 0.5 approximately 1,000 ms after stimulus onset (Figure 1B), consistent with the long time courses usually observed using intrinsic-signal optical imaging.11,18 To maximize image signal quality, only image frames after this time point were incorporated into the activation maps. The spatial distribution of AUC values indicates that the cortical representation of the spot was confined to the lower-left portion of the image in this session, and that this region exhibited a relative enhancement in activation, presumably due to the absence of surround suppression. These results allowed us to identify the retinotopic location of the spot on the cortex, which could then be used to discriminate between the figural and background regions of the figure–ground displays.
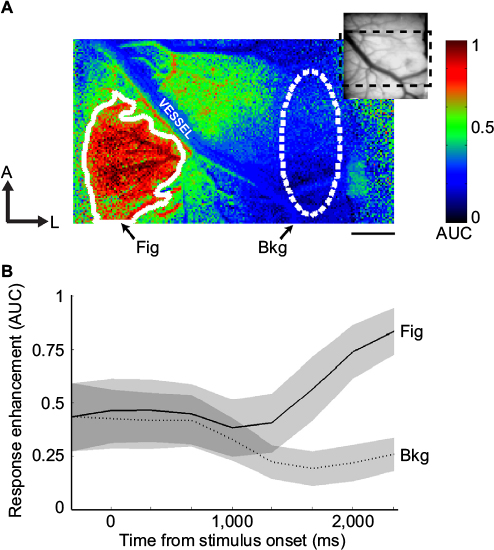
In Figure 2, AUC maps obtained from a second experimental session are shown. From the spot-enhancement map (left panel), it is clear that the position of the spot emerges within two well-confined regions on the right of the image, corresponding to V1 and V2. For reference, the corresponding difference map computed without ROC analysis is shown in Figure S1A (left panel). The V1–V2 border was precisely determined by analyzing the ocular dominance map, as described in the Materials and methods section and shown for this case in Figure S1B. Shown in the middle and right panels of Figure 2 are the activation patterns elicited by orientation-contrast and motion-contrast stimuli, respectively. Similar to the preceding analysis, AUC values >0.5 indicate stronger activation by figure–ground stimulation, while AUC values <0.5 signify stronger activation by the homogeneous field. These images show patterns of activation colocalized with the activation pattern from the spot-activation map, implying that the population activity within the figural region was enhanced by the figure–ground configuration.
 | Figure 2 Optical imaging reveals figural enhancement. Notes: Activation maps were obtained from ten blocks of four trials each in monkey 1,045. These images indicate that response enhancement specific to the spot (A), orientation (Ori)-contrast (B), and motion (Mot)-contrast (C) conditions resides in the medial portion of the imaged field, and is present in both V1 (bottom) and V2 (top). Scale bar 1 mm. Abbreviation: AUC, area under the curve. |
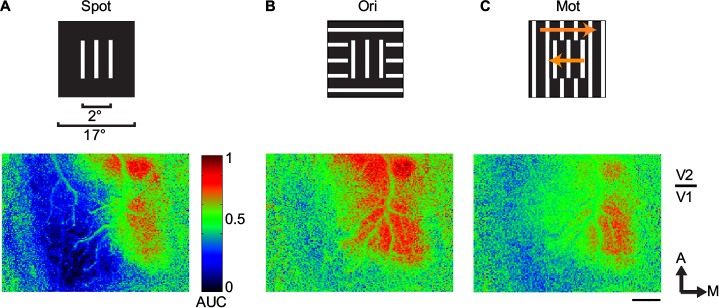
To quantify the consistency of these effects across all five monkeys, we placed ROIs over the putative representations of the figural regions for each session, and examined the distribution of AUC values within the ROI. As described in the Materials and methods section, figural ROIs were selected by an automated annotation process, which used the spot-activation map to determine the boundaries of activation. As an example, one such ROI is superimposed on the map shown in Figure 1A (solid outline). An ellipse of roughly the same size was carefully placed a minimum of 1.5 mm (approximately two hypercolumns in extent)19 away from the figural ROI, serving as the background ROI (dashed outline in Figure 1A). The ROIs derived from the spot-activation maps were then applied to the orientation-contrast and motion-contrast AUC maps. In Figure 3, mean AUC values are shown for the figural and background ROIs from each monkey. For all five monkeys tested, AUC values were higher in the figural region than in the background region for the spot condition, as expected (Figure 3A, Wilcoxon sign-rank test, P<0.01). Likewise, AUC values in V1 and V2 were significantly greater than 0.5 within the figural ROIs for orientation- and motion-based figure–ground arrangements (Wilcoxon sign-rank test, P<0.05), supporting the observation that figure–ground stimuli more strongly activated early visual cortex. This enhancement, however, was generally not present in the background ROIs, which did not significantly differ from 0.5 (Wilcoxon sign-rank test, P=0.715). These results demonstrate a context-dependent effect on activation that was confined to only the figural region of the stimulus. The magnitude of this effect was not significantly different between V1 and V2 (Wilcoxon sign-rank test, P=0.535).
 | Figure 3 Enhancement is confined to the figural (Fig) region. Notes: Area under the curve (AUC) values were obtained from spot (A), orientation (Ori)-contrast (B), and motion (Mot)-contrast (C) conditions from Fig and background (Bkg) regions of interest of all five monkeys, showing the consistent effect across animals. Each point corresponds to the mean AUC value measured in a single animal in the 1- to 2-second period following stimulus onset. |
We used the transition from spot-preferring to homogeneous-preferring regions in the spot-activation maps to estimate the retinotopic position corresponding to the figural region of the figure–ground stimuli. As an additional method to corroborate this procedure, we estimated the position of the figure–ground boundary using high-pass-filtered functional maps. In this way, we reduced the potential influence of low spatial frequency energy that naturally exists in optical imaging maps (Figure S1). This technique also served to minimize the impact of point spread on the estimation of the boundary, as it relied on the comparison of two maps with nearly equal spatial distribution of energy. We exploited the fact that orientation maps produced by orientation-contrast stimuli reversed their polarity in the background relative to those produced by homogeneous stimuli, as a natural consequence of the orthogonal configuration that we used to define orientation contrast. We compared orientation maps derived from homogeneous stimuli (Figure 4A) to orientation maps derived from orientation-contrast stimuli (not pictured). By multiplying these maps together, the correspondence between them is readily observed, and is shown for one session in Figure 4B. Pixels in yellow correspond to a positive relationship between the two maps, whereas pixels in blue indicate regions in which the maps are opposite in sign. Pixels on the left of the spot-activation map-defined boundary (shown in the inset and denoted by the dashed line) exhibit mostly concordant behavior; pixels on the right exhibit mostly discordant behavior. This suggests that the figure–ground boundary lies in the area between these regions. In V1, this boundary matches remarkably well with the boundary estimated from the corresponding spot-activation map. In V2, the differences between these estimates are small, but notable. First, the position of the dashed line is on the rightmost side of the correlated/anticorrelated transition band. This observation implies that the AUC-thresholding procedure employed in the previous figures may slightly overestimate the extent of the figural region compared to the orientation-map procedure. The larger expanse of enhancement may thus indicate that this procedure incorporates receptive fields that represent the boundary itself.
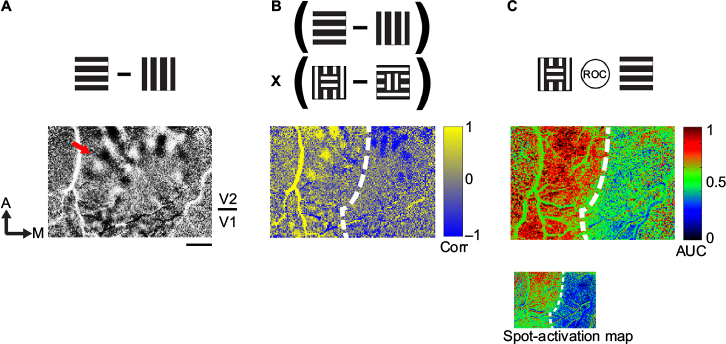 | Figure 4 Localization of the figural region using an orientation map. Notes: (A) A difference image was obtained from the average of six blocks of four trials each from monkey 1,032. This image was constructed by subtracting the mean image obtained with homogeneous vertical gratings from that obtained with homogeneous horizontal gratings. Dark patches indicate areas more strongly activated by horizontal gratings; light patches correspond to stronger vertical activation. Pale and thick stripes contain orientation maps; one such stripe is referenced by the arrow. (B) We multiplied the homogeneous condition-orientation map shown in A with the contrast-orientation map (not pictured). Prior to the multiplication, both maps were high-pass filtered using a Gaussian filter with σ=38.5 pixels. Yellow pixels correspond to mutual activation between maps, while blue pixels correspond to opposite activation. The dashed line is used as a landmark to show the approximate border, defined by the spot-activation map shown in the inset. (C) The orientation contrast-activation map is shown for the imaging session depicted in A and B. The dashed line was defined by the spot-activation map. Scale bar 1 mm. Abbreviations: Corr, correlation; ROC, receiver-operating characteristic; AUC, area under the curve. |
The second notable difference between these two measures is apparent on the left of V2. The orientation contrast-enhanced region in Figure 4C extends leftward beyond the most lateral stripe (denoted by the red arrow in Figure 4A), in an area lacking organization for orientation. Since orientation maps are absent in thin V2 stripes,14–16 this observation implies that figural enhancement is not specific to just one particular stripe type and indeed extends to stripes lacking organization for orientation. This can also be inferred from the lateral extent of V2 activation, shown in Figure 5 for the four monkeys in which V2 was imaged. Each outline depicts the figural ROI for the specified monkey. Asterisks in the first and third panels denote disruptions in the ROI caused by artifacts arising from prominent surface vasculature. For two of the monkeys (the lower two panels), the contiguous-enhancement region in V2 far exceeded typical estimates of stripe widths,13–15,17 implying that response enhancement transcended the functional compartmentalization of V2. This was true not only for spot activation (and presumably, therefore, the presence of surround suppression) but also for orientation-contrast and motion-contrast modulation, which showed similar spatial extents. As in the orientation contrast-activation map in Figure 4C, response enhancement did not obey the boundaries of the orientation map in V2, highlighting the disconnect between the mode of contextual enhancement and the functional organization of the underlying cortex. Rather, the distribution of contextual modulation across the surface of the cortex appeared to be based primarily on retinotopy, and not the specialization of the underlying functional subdomains.
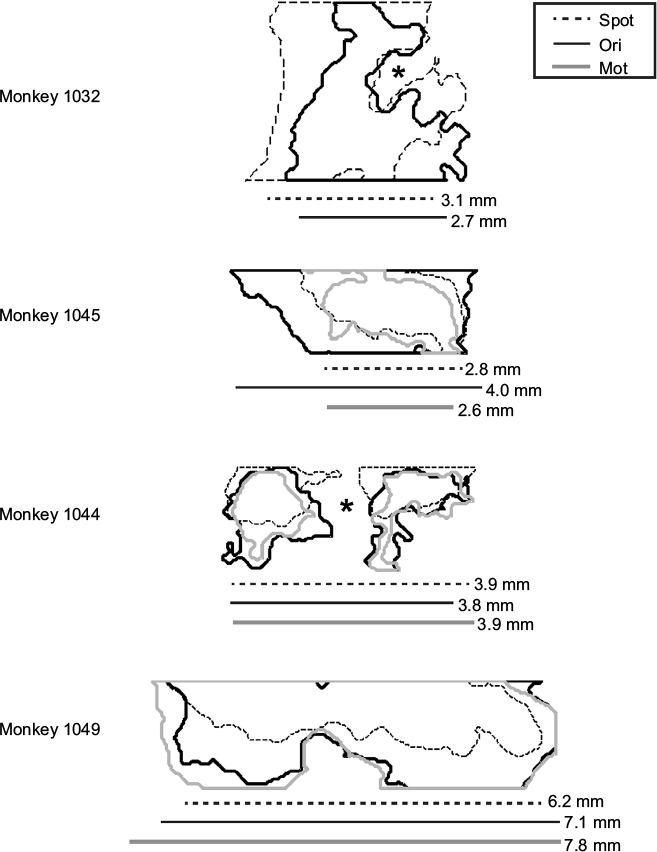 | Figure 5 Figural enhancement extends across a large expanse of V2. Notes: V2-activation maps are shown for all four monkeys in which V2 was imaged. The first case (monkey 1,032) corresponds to the images shown in Figure 4. The second case (monkey 1,045) was previously presented in Figure 2. The outlines correspond to the computed figural regions of interest, as described in the Materials and methods section, which depict the extent of enhancement by spot, orientation (Ori)-contrast, or motion (Mot)-contrast stimulation in comparison to homogeneous stimulation. Asterisks in the first and third cases denote masking of the signal by flare artifacts produced by large surface vasculature. Below each illustration is an estimate of the horizontal extent of these activation regions, taken as the length of the axis parallel to the V1–V2 border of a best-fit ellipse. For each case, the three estimates were generally similar to one another and typically exceeded ~2.5 mm, indicating that figure–ground enhancement usually activated multiple adjacent-stripe compartments. |
Discussion
We have shown that optical imaging reveals response facilitation among neuronal ensembles in V1 and V2, evoked by the presence of orientation and motion discontinuities, and thus may be important for figure–ground segregation and the segmentation of surfaces and textures. This modulation is consistent with the notion that figural enhancement effects are widespread throughout even the earliest visual cortical areas and that figural information can be extracted from the population response.
Extraclassical modulation revealed by optical imaging
The comparison between the spot- and homogeneous-stimulus conditions proved useful for mapping the retinotopic location of the spot in the imaged field, but also revealed surrounding suppression effects. The stimulation within the spot region of visual space was identical for both stimulus conditions, yet the difference in activation was substantial. This indicates that suppression from stimulation beyond the classical receptive fields of neurons is present in the population response, an effect that is consistent with single-unit studies. However, we cannot rule out the possibility that the increased activation may have been due to a reduction in the competition for resources associated with the much smaller stimulus area of the spot condition, leading to more substantial deoxygenation arising from reduced blood volume. We find this unlikely, as activation due to orientation- and motion-contrast stimuli was similar in magnitude to spot activation; if blood-stealing was a dominant source of the observed modulations, we might expect that spot enhancement would also exceed the full-field orientation- and motion-contrast enhancements.
We also considered the possibility that the increase in activation associated with the spot stimulus merely reflected responses to the figure boundary. We find this unlikely, because the extent of enhancement was greater than the area typically activated by focal stimuli.19,20 Although some of the observed enhancement may indicate increased activity in response to the edge of the spot (perhaps reflecting the activation of end-stopped cells), the more interior regions of enhancement likely represented neurons whose receptive fields were entirely enveloped by the spot. Notably, all of the imaging sessions in our data set had regions of enhancement greater than two hypercolumns in width, the approximate extent that must be traversed to find neurons with nonoverlapping receptive fields.21,22 Furthermore, the results from Figure 4 demonstrate that response enhancement was also present in the region defined by the orientation map-based boundary estimate that compared stimuli with similar spatial energy profiles. These results support the notion that extraclassical modulation plays a key role in shaping the response properties of the neuronal ensemble.
Illusory contours have been shown to evoke specific activations that have been revealed by optical imaging. A striking characteristic of the illusory contour signals observed by Ramsden et al23 is that they preferentially activate orientation columns associated with the orientation of the illusory contour. Similarly, Chen et al24 showed that contours defined by motion contrast produce activations that mimic the orientation organization defined by gratings. Despite being able to resolve orientation columns clearly (eg, Figure 4), we did not find patchy enhancement in V1 or any enhancement signal that correlated with orientation maps, making it unlikely that the signal we observed was related to that described by Ramsden et al and Chen et al. Furthermore, we expect that if illusory signals were a prominent feature of the enhancement that we describe, they would not exhibit the figural asymmetry that we observed. However, to our knowledge, this has not been explicitly tested.
Response enhancement due to the presence of figural cues has previously been shown by Gilad and Slovin25 using optical imaging, consistent with the results reported here. Their experiments in awake behaving monkeys demonstrated that figural enhancement was prevalent in V1 when monkeys performed a task in which they were required to discriminate between a closed-figure condition and a control. Although it is not clear whether the enhancement that they observed was task-dependent, our findings in anesthetized animals suggest that it may be the result of an intrinsic mechanism that likely supports figure–ground segregation.
Figural enhancement by orientation and motion contrast
Figure–ground configurations defined by orientation or motion generated greater activation than the homogeneous stimulus within the figural region only. All analyses performed were based on the average of the responses to all four orientations, so when averaged together, every full-field condition consisted of identical parts, regardless of the stimulus group to which it belonged. As a result, any differences in activation must have been the result of the interactions of the stimulus components. Therefore, we conclude that cells within the figural region tend to be enhanced by extraclassical contrast in both the orientation and motion domains. Conversely, areas beyond the figural region were generally not affected by feature contrast. This type of response runs counter to the notion that proximity to the boundary itself induces an increase in activity. Instead, it places an asymmetric constraint on our view of contrast enhancement: for figure–ground arrangements, enhancement due to feature contrast occurs within the figural region only, consistent with the notion of “figural enhancement” previously shown in a subset of electrophysiological responses.26
The results in Figure 3 indicate that although orientation- and motion-contrast exhibited similar enhancement profiles overall, the marked variability in the motion-contrast condition was unique to that stimulus condition. The source of this variability is unclear, but it is important to note that all six data points in Figure 3C demonstrated a reduction in modulation strength in the background region, consistent with the results for the orientation-contrast condition. Also, as noted in Figure 5, the distribution of enhancement for motion-contrast traversed V2 stripes, supporting the notion that figural enhancement is agnostic to functional compartment.
Functional organization of contextual modulation
Area V2 is composed of multiple compartments, or stripes (designated thin, thick, and pale) each spanning roughly 1–1.5 mm in extent and each exhibiting different functional properties and patterns of connectivity with other visual areas.13,27–31 For instance, orientation selectivity has been shown to be more prevalent in thick and pale stripes, while color selectivity may be the most prominent feature in thin stripes,13 which lack an organization for orientation altogether.12 Likewise, functional maps of direction selectivity appear to be confined to thick and pale stripes,32 highlighting the specialization for these features in distinct regions of V2. The highly compartmentalized nature of V2 organization makes it an attractive visual area to study how contextual responses depend on the functional characteristics of the neurons, and whether this trait is another property that is segregated at this step of visual processing.
Despite the vastly different properties typically observed throughout V2, our results suggest that V2 exhibits contextual modulation across all functional compartments. Figure–ground arrangements defined by orientation and motion are both effective at activating cortical territory belonging to adjacent stripes, even though the presence of orientation and direction tuning differs considerably between stripes. This result implies that the visual feature that elicits figure–ground enhancement may not have to be explicitly represented by the classical receptive-field properties of the cell that carries it. We made a similar observation in single units,33 showing that the distribution of orientation and direction tuning in the classical receptive fields of V1 neurons was similar for both orientation contrast- and motion contrast-modulated cell populations. The results presented here extend this concept by revealing that an organization for the visual features that elicit figure–ground enhancement need not be present either. The diversity of the sources of input to different functional compartments and the divergence of their downstream pathways appear to have little impact on the contextual response properties of V2. However, as noted by Chen et al,24 the representation of higher-order contours defined by motion stimuli may in fact be restricted to direction-sensitive domains, highlighting a potential difference between the representation of a figure and the encoding of its contours.
Relationship to previous imaging studies
The findings described here bridge the gap between the incongruent observations previously reported in electrophysiological and imaging studies. Several studies have used functional magnetic resonance imaging to examine the response properties of V1 to stimuli that evoke segmentation. Many have failed to reveal response enhancement within V1, even when positive results were found in extrastriate areas.34–36 The negative imaging results have been at odds with the electrophysiology literature, which generally finds a tendency for single units to exhibit response enhancement to figure–ground and segmentation stimuli. The results shown here provide evidence that the population activity indeed conforms to the predictions made from single-unit studies: early cortical areas are preferentially enhanced within the figural region by figure–ground configurations, suggesting a possible role for V1 and V2 in figure–ground segregation.
We find supporting evidence from evoked-potential studies, where electrical signals were recorded and localized to area V1.37,38 These studies, like ours, demonstrated response enhancement of the population activity in the presence of segmentation cues. Given the much higher spatial resolution of optical imaging, we were able to eliminate the chance that these properties were purely the consequence of border effects, which is a potential shortcoming of many visual evoked-potential studies. Instead, the data presented here demonstrate that response enhancement confined to the figural region is present in the ensemble response.
Zweig et al39 showed by using optical imaging that squares defined by chromatic differences failed to produce activation within the confines of the figure. They noted that this behavior did not extend to achromatic stimuli, which exhibited a response that began at the edges of the square and gradually filled in to the center. As they used voltage-sensitive dyes in their experiments, we did not have the same degree of temporal resolution, and thus cannot distinguish between initial-edge activation and delayed fill.
Different mechanisms underlie contour integration and figure–ground segregation
Recent evidence has suggested that other forms of contextual interactions can be observed in V1 using optical imaging. Kinoshita et al40 measured the optical response to collinear bars, and discovered that the magnitude of the intrinsic optical signal decreased compared to that predicted from the component responses, a result that was opposite in sign to the measured firing rates of single neurons.41,42 The authors reasoned that since reflectance changes tend to follow synaptic rather than spiking activity,43 these results implicate a withdrawal of inhibition when collinear flankers are present. This explanation neatly ties together the optical suppression and electrophysiological facilitation observed. Our imaging results, on the other hand, suggest that not all forms of contextual modulation behave in this manner. Figure–ground arrangements consistently produced facilitation in the optical response. This modulation is of the same sign as the population activity revealed by our own electrophysiological recordings and those described in previous studies.10,44 Our data can be reconciled with the results of Kinoshita et al if the two observations are the consequence of different mechanisms. Angelucci et al45 have described two distinct mechanisms in V1 responsible for contextual effects: one the result of long-range horizontal connections, thought to be important for collinear facilitation,46 and another the result of feedback connections whose temporal properties and spatial extent are commensurate with the known properties of figure–ground enhancement. The differences between the results described here and the work of Kinoshita et al suggest that different cortical mechanisms may be responsible for contour integration and surface representation. While contour integration may make use of long-range horizontal connections and inhibitory influences, our results indicate that cortical responses important for surface segmentation may operate via excitatory influences targeted to the figural representation of a figure–ground stimulus.
Author contributions
MDZ and DYT designed and performed the experiments, MDZ analyzed the data and prepared the manuscript, and MDZ and DYT edited the manuscript and approved the final version.
Acknowledgments
We thank Dorothy Joiner and Sandra McGillis for technical support, and Alessandra Angelucci for helpful comments on the manuscript.
Disclosure
The authors report no conflicts of interest in this work.
References
Cavanaugh JR, Bair W, Movshon JA. Selectivity and spatial distribution of signals from the receptive field surround in macaque V1 neurons. J Neurophysiol. 2002;88(5):2547–2556. | ||
Knierim JJ, van Essen DC. Neuronal responses to static texture patterns in area V1 of the alert macaque monkey. J Neurophysiol. 1992;67(4):961–980. | ||
Sillito AM, Grieve KL, Jones HE, Cudeiro J, Davis J. Visual cortical mechanisms detecting focal orientation discontinuities. Nature. 1995;378(6556):492–496. | ||
Lamme VA. The neurophysiology of figure-ground segregation in primary visual cortex. J Neurosci. 1995;15(2):1605–1615. | ||
Jones HE, Grieve KL, Wang W, Sillito AM. Surround suppression in primate V1. J Neurophysiol. 2001;86(4):2011–2028. | ||
Akasaki T, Sato H, Yoshimura Y, Ozeki H, Shimegi S. Suppressive effects of receptive field surround on neuronal activity in the cat primary visual cortex. Neurosci Res. 2002;43(3):207–220. | ||
Jones HE, Wang W, Sillito AM. Spatial organization and magnitude of orientation contrast interactions in primate V1. J Neurophysiol. 2002;88(5):2796–2808. | ||
Marcus DS, van Essen DC. Scene segmentation and attention in primate cortical areas V1 and V2. J Neurophysiol. 2002;88(5):2648–2658. | ||
Li Z. Visual segmentation by contextual influences via intra-cortical interactions in the primary visual cortex. Network. 1999;10(2):187–212. | ||
Bach M, Meigen T. Similar electrophysiological correlates of texture segregation induced by luminance, orientation, motion and stereo. Vision Res. 1997;37(11):1409–1414. | ||
Grinvald A, Lieke E, Frostig RD, Gilbert CD, Wiesel TN. Functional architecture of cortex revealed by optical imaging of intrinsic signals. Nature. 1986;324(6095):361–364. | ||
Ts’o DY, Frostig RD, Lieke EE, Grinvald A. Functional organization of primate visual cortex revealed by high resolution optical imaging. Science. 1990;249(4967):417–420. | ||
Roe AW, Ts’o DY. Visual topography in primate V2: multiple representation across functional stripes. J Neurosci. 1995;15(5 Pt 2):3689–3715. | ||
Roe AW, Ts’o DY. Specificity of color connectivity between primate V1 and V2. J Neurophysiol. 1999;82(5):2719–2730. | ||
Malach R, Tootell RB, Malonek D. Relationship between orientation domains, cytochrome oxidase stripes, and intrinsic horizontal connections in squirrel monkey area V2. Cereb Cortex. 1994;4(2):151–165. | ||
Shmuel A, Korman M, Sterkin A, et al. Retinotopic axis specificity and selective clustering of feedback projections from V2 to V1 in the owl monkey. J Neurosci. 2005;25(8):2117–2131. | ||
Ts’o DY, Roe AW, Gilbert CD. A hierarchy of the functional organization for color, form and disparity in primate visual area V2. Vision Res. 2001;41(10–11):1333–1349. | ||
Chen-Bee CH, Agoncillo T, Xiong Y, Frostig RD. The triphasic intrinsic signal: implications for functional imaging. J Neurosci. 2007;27(17):4572–4586. | ||
Ts’o DY, Zarella M, Burkitt G. Whither the hypercolumn? J Physiol. 2009;587(Pt 12):2791–2805. | ||
Lu HD, Chen G, Ts’o DY, Roe AW. A rapid topographic mapping and eye alignment method using optical imaging in macaque visual cortex. Neuroimage. 2009;44(3):636–646. | ||
Toth LJ, Rao SC, Kim DS, Somers D, Sur M. Subthreshold facilitation and suppression in primary visual cortex revealed by intrinsic signal imaging. Proc Natl Acad Sci U S A. 1996;93(18):9869–9874. | ||
Hubel DH, Wiesel TN. Uniformity of monkey striate cortex: a parallel relationship between field size, scatter, and magnification factor. J Comp Neurol. 1974;158(3):295–305. | ||
Ramsden BM, Hung CP, Roe AW. Real and illusory contour processing in area V1 of the primate: a cortical balancing act. Cereb Cortex. 2001;11(7):648–665. | ||
Chen M, Li P, Zhu S, et al. An orientation map for motion boundaries in macaque V2. Cereb Cortex. 2016;26(1):279–287. | ||
Gilad A, Slovin H. Population responses in V1 encode different figures by response amplitude. J Neurosci. 2015;35(16):6335–6349. | ||
Lamme VA, Rodriguez-Rodriguez V, Spekreijse H. Separate processing dynamics for texture elements, boundaries and surfaces in primary visual cortex of the macaque monkey. Cereb Cortex. 1999;9(4):406–413. | ||
Shipp S, Zeki S. The functional organization of area V2, I: specialization across stripes and layers. Vis Neurosci. 2002;19(2):187–210. | ||
Xiao Y, Zych A, Felleman DJ. Segregation and convergence of functionally defined V2 thin stripe and interstripe compartment projections to area V4 of macaques. Cereb Cortex. 1999;9(8):792–804. | ||
DeYoe EA, Van Essen DC. Segregation of efferent connections and receptive field properties in visual area V2 of the macaque. Nature. 1985;317(6032):58–61. | ||
Federer F, Ichida JM, Jeffs J, Schiessl I, McLoughlin N, Angelucci A. Four projection streams from primate V1 to the cytochrome oxidase stripes of V2. J Neurosci. 2009;29(49):15455–15471. | ||
Livingstone MS, Hubel DH. Anatomy and physiology of a color system in the primate visual cortex. J Neurosci. 1984;4(1):309–356. | ||
Lu HD, Chen G, Tanigawa H, Roe AW. A motion direction map in macaque V2. Neuron. 2010;68(5):1002–1013. | ||
Zarella MD, Ts’o DY. Cue combination encoding via contextual modulation of V1 and V2 neurons. Eye Brain. 2016;8:177–193. | ||
Kastner S, De Weerd P, Ungerleider LG. Texture segregation in the human visual cortex: a functional MRI study. J Neurophysiol. 2000;83(4):2453–2457. | ||
Schira MM, Fahle M, Donner TH, Kraft A, Brandt SA. Differential contribution of early visual areas to the perceptual process of contour processing. J Neurophysiol. 2004;91(4):1716–1721. | ||
Thielscher A, Kölle M, Neumann H, Spitzer M, Grön G. Texture segmentation in human perception: a combined modeling and fMRI study. Neuroscience. 2008;151(3):730–736. | ||
Lamme VA, van Dijk BW, Spekreijse H. Contour from motion processing occurs in primary visual cortex. Nature. 1993;363(6429):541–543. | ||
Appelbaum LG, Wade AR, Pettet MW, Vildavski VY, Norcia AM. Figure-ground interaction in the human visual cortex. J Vis. 2008;8(9):1–19. | ||
Zweig S, Zurawel G, Shapley R, Slovin H. Representation of color surfaces in V1: edge enhancement and unfilled holes. J Neurosci. 2015;35(35):12103–12115. | ||
Kinoshita M, Gilbert CD, Das A. Optical imaging of contextual interactions in V1 of the behaving monkey. J Neurophysiol. 2009;102(3):1930–1944. | ||
Kapadia MK, Westheimer G, Gilbert CD. Spatial distribution of contextual interactions in primary visual cortex and in visual perception. J Neurophysiol. 2000;84(4):2048–2062. | ||
Kapadia MK, Ito M, Gilbert CD, Westheimer G. Improvement in visual sensitivity by changes in local context: parallel studies in human observers and in V1 of alert monkeys. Neuron. 1995;15(4):843–856. | ||
Das A, Gilbert CD. Long-range horizontal connections and their role in cortical reorganization revealed by optical recording of cat primary visual cortex. Nature. 1995;375(6534):780–784. | ||
Bach M, Schmitt C, Quenzer T, Meigen T, Fahle M. Summation of texture segregation across orientation and spatial frequency: electrophysiological and psychophysical findings. Vision Res. 2000;40(26):3559–3566. | ||
Angelucci A, Levitt JB, Walton EJ, Hupe JM, Bullier J, Lund JS. Circuits for local and global signal integration in primary visual cortex. J Neurosci. 2002;22(19):8633–8646. | ||
Crook JM, Engelmann R, Lowel S. GABA-inactivation attenuates colinear facilitation in cat primary visual cortex. Exp Brain Res. 2002;143(3):295–302. |
Supplementary material
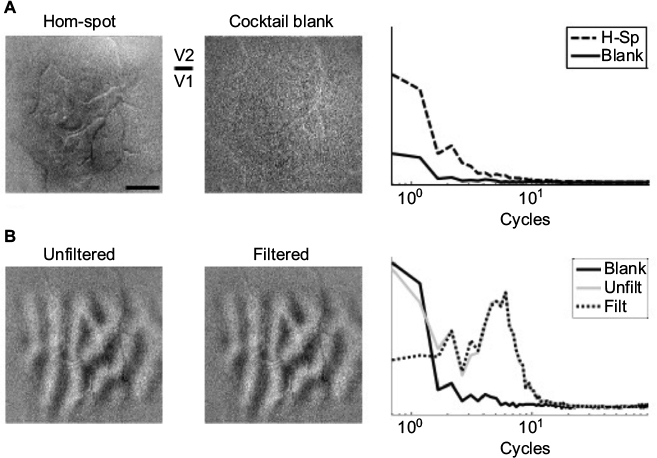 | Figure S1 Spatial characteristics of functional maps using intrinsic signal optical imaging. Notes: (A) Response to spot stimulus minus full-field homogeneous (Hom) stimulus (left). Darker areas correspond to spot-preferring regions. Note that this map corresponds to the case shown in Figure 2 of the manuscript. Response of same tissue to a blank screen (middle). Spatial frequency of both maps collapsed to a single dimension by averaging the 2-D Fourier transform radially (right). Both maps are similarly dominated by low frequencies, indicating that Fourier-based filtering cannot be used to reduce low-frequency artifacts without sacrificing a substantial portion of the signal of interest. The plot is on an absolute scale, showing that stimulated cortex exhibits greater activity than unstimulated cortex. (B) Ocular dominance map of the same exposure. Optical imaging is often used to evaluate functional maps that contain modules typically less than 1 mm in size, making them amenable to high-pass filtering without losing the underlying structure of the maps. The left and middle panes depict the same ocular dominance map unfiltered (Unfilt) and filtered (Filt) (0.2 cycles/mm), respectively. The corresponding spatial frequency profiles of both images are shown at right, with the blank-condition profile overlay. The energy of the blank-condition profile was increased to aid visualization. The V1–V2 border is easily distinguished, based on the disruption of the ocular dominance map. Abbreviation: H-Sp, hom-spot. |
 © 2017 The Author(s). This work is published and licensed by Dove Medical Press Limited. The full terms of this license are available at https://www.dovepress.com/terms.php and incorporate the Creative Commons Attribution - Non Commercial (unported, v3.0) License.
By accessing the work you hereby accept the Terms. Non-commercial uses of the work are permitted without any further permission from Dove Medical Press Limited, provided the work is properly attributed. For permission for commercial use of this work, please see paragraphs 4.2 and 5 of our Terms.
© 2017 The Author(s). This work is published and licensed by Dove Medical Press Limited. The full terms of this license are available at https://www.dovepress.com/terms.php and incorporate the Creative Commons Attribution - Non Commercial (unported, v3.0) License.
By accessing the work you hereby accept the Terms. Non-commercial uses of the work are permitted without any further permission from Dove Medical Press Limited, provided the work is properly attributed. For permission for commercial use of this work, please see paragraphs 4.2 and 5 of our Terms.