Back to Journals » OncoTargets and Therapy » Volume 11
Construction of a specific SVM classifier and identification of molecular markers for lung adenocarcinoma based on lncRNA-miRNA-mRNA network
Authors Zhao J, Cheng W, He X, Liu Y, Li J, Sun J, Li J, Wang F, Gao Y
Received 7 September 2017
Accepted for publication 24 March 2018
Published 25 May 2018 Volume 2018:11 Pages 3129—3140
DOI https://doi.org/10.2147/OTT.S151121
Checked for plagiarism Yes
Review by Single anonymous peer review
Peer reviewer comments 3
Editor who approved publication: Dr Ingrid Espinoza
Jingming Zhao,1 Wei Cheng,1 Xigang He,2 Yanli Liu,1 Ji Li,3 Jiaxing Sun,1 Jinfeng Li,1 Fangfang Wang,1 Yufang Gao4
1Department of Respiratory Medicine, The Affiliated Hospital of Qingdao University, Qingdao, P.R. China; 2Department of Respiratory Medicine, People’s Hospital of Rizhao Lanshan, Lanshan District, Rizhao, P.R. China; 3Department of Pharmacy, Qilu Hospital of Shandong University (Qingdao), Qingdao, P.R. China; 4Department of President’s Office, The Affiliated Hospital of Qingdao University, Qingdao, P.R. China
Background: Novel diagnostic predictors and drug targets are needed for LUAD (lung adenocarcinoma). We aimed to build a specific SVM (support vector machine) classifier for diagnosis of LUAD and identify molecular markers with prognostic value for LUAD.
Methods: The expression differences of miRNAs, lncRNAs and mRNAs between LUAD and normal samples were compared using data from TCGA (The Cancer Genome Atlas) database. A LUAD related miRNA-lncRNA-mRNA network was constructed, based on which feature genes were selected for the construction of LUAD specific SVM classifier. The robustness and transferability of SVM classifier were validated using gene expression profile datasets GSE43458 and GSE10072. Prognostic markers were identified from the network. A set of LUAD-related differentially expressed miRNAs, lncRNAs and miRNAs were identified and a LUAD related miRNA-lncRNA-mRNA network was obtained. The LUAD specific SVM classifier constructed on the basis of the network was robust and efficient for classification of samples from TCGA dataset and two independent validation datasets.
Results: Eight RNAs with prognostic value were identified, including hsa-miR-96, hsa-miR-204, PGM5P2 (phosphoglucomutase 5 pseudogene 2), SFTA1P (surfactant associated 1), RGS20 (regulator of G protein signaling 20), RGS9BP (RGS9-binding protein), FGB (fibrinogen beta chain) and INA (alpha-internexin). Among them, RGS20 and INA were regulated by hsa-miR-96. RGS20 was also regulated by hsa-miR-204, which was a potential target of SFTA1P.
Conclusion: The LUAD specific SVM classifier may serve as a novel diagnostic predictor. hsa-miR-96, hsa-miR-204, PGM5P2, SFTA1P, RGS20, RGS9BP, FGB and INA may serve as prognostic markers in clinical practice.
Keywords: lung adenocarcinoma, lncRNA-miRNA-mRNA network, SVM classifier, molecular marker, prognosis
Introduction
LUAD (lung adenocarcinoma) is the most common subtype of non-small cell lung cancer, accounting for about 40% of lung cancer worldwide.1,2 Molecularly targeted therapies using TKIs (tyrosine kinase inhibitors) are standard treatments for LUAD patients with mutations in EGFR (epidermal growth factor receptor) and fusions of ALK (anaplastic lymphoma kinase), ROS1 (ROS proto-oncogene 1), and RET (rearranged during transfection).3,4 Acquired resistance, however, often occurs approximately 1–2 years after TKI treatment.4 Moreover, few effective therapies have been developed to target alterations in other genes, such as TP53 (tumor protein p53),5 KEAP1 (kelch-like ECH associated protein 1)6 and STK11 (serine/threonine kinase 11).7 Therefore, it is still urgent for developing new drug targets for the diagnosis and treatment of LUAD.
Increasing evidence has highlighted the involvement of ncRNAs (non-coding RNAs) in tumorigenesis.8 Two typical subtypes of ncRNAs are miRNAs (microRNAs) and lncRNAs (long non-coding RNAs).9–11 miRNAs are small ncRNAs with about 22 nucleotides, which can interact with target mRNAs to degrade mRNAs or inhibit the translation of mRNA.9,10 In comparison to miRNAs, lncRNAs are much longer ncRNAs with more than 200 nucleotides and function through more diverse mechanisms.9,11 In addition to directly targeting mRNAs, it has also been shown to function as ceRNAs (competing endogenous RNAs), interacting with miRNAs to indirectly regulate mRNAs.11,12 It is thus believed that interplays between lncRNAs and miRNAs may play an important role in tumorigenesis.12 Recently, investigations about the lncRNA-miRNA-mRNA ceRNA networks provide a better understanding of the roles lncRNA-miRNA interactions in mRNAs regulation and LUAD development.13,14 Important regulatory pathways, as well as therapeutic targets, could be revealed based on lncRNA-miRNA-mRNA networks. For example, MEG3 (maternally expressed 3), MIAT (myocardial infarction associated transcript) and LINC00115 may serve as prognostic lncRNAs and may be involved in regulatory pathways in LUAD.14 According to the lncRNA-miRNA-mRNA network, MEG3 and MIAT regulate MAPK9 (mitogen-activated protein kinase 9) by interacting with miR-106, whereas LINC00115 regulate FGF2 (fibroblast growth factor 2) by interacting with miR-7.14
Two gene expression profile datasets GSE4345815 and GSE1007216 have been used to reveal genes related to LUAD. It has been shown that ETS2 (V-ets erythroblastosis virus E26 oncogene homolog 2) is downregulated in LUAD, using GSE43458 dataset.15 ETS2 may inhibit cancer cell invasion, migration and growth by suppressing MET activation.15 Cigarette smoking related signature genes in LUAD patients have been identified using GSE10072 dataset.16 It is remarkable that most of the signatures are involved in cell cycle, such as NEK2, TTK, and PRC1.16 Though advances have been made to identify LUAD related signatures, efficient diagnostic predictors and potential drug targets of LUAD are still in need.
In order to identify novel diagnostic predictors and molecular markers, we first constructed a LUAD specific lncRNA-miRNA-mRNA ceRNA network in our study, using data from TCGA (The Cancer Genome Atlas). A LUAD specific SVM (support vector machine) classifier was built and prognosis related nodes were identified based on the ceRNA network. GSE43458 and GSE10072 datasets were further used to validate the efficiency and robustness of the SVM classifier in predicting LUAD. The SVM classifier and the prognosis related nodes may contribute to the diagnosis and treatment of LUAD in clinical practice.
Materials and methods
Data source and data preprocessing
The mRNA and miRNA expression data of LUAD-related samples was downloaded from TCGA (https://gdc-portal.nci.nih.gov/). After checking the barcode information of samples, a total of 464 LUAD samples with both mRNA and miRNA data were obtained for subsequent analysis, including 445 LUAD and 19 normal samples. All the clinical information related to these samples was also obtained.
Two independent validation datasets GSE10072 (contributed by Landi et al)16 and GSE43458 (contributed by Kabbout et al)15 were downloaded from GEO (Gene Expression Omnibus) database (https://www.ncbi.nlm.nih.gov/geo/). In total, 107 lung samples (58 LUAD versus 49 normal samples, GPL96 [HG-U133A] platform) were included in the GES10072 dataset, and 110 lung samples (80 LUAD versus 30 normal samples, GPL6244 [HuGene-1_0-st] platform) were included in the GES43458 dataset. The package oligo17 under R was used for background adjustment of expression values and normalization preprocessing of expression profile data, including conversion of the original data format, imputation of missing values and data standardization.
Identification of LUAD related lncRNAs, miRNAs and mRNAs
According to annotation information from HGNC (HUGO Gene Nomenclature Committee, http://www.genenames.org/), the lncRNA data of LUAD-related samples downloaded from TCGA were obtained based on the gene ID. Expression differences of mRNAs and miRNA-seq data between LUAD and normal samples were analyzed using edgeR package18 under R3.0.1 and FDR (false discovery rate) was calculated using multtest package.19 LncRNAs, miRNAs and mRNAs with FDR <0.05 and FC (fold change) >1.5 or <0.67 (|logFC|>0.585) were considered to be significantly differentially expressed between LUAD and normal samples.
Identification of lncRNAs, miRNAs and mRNAs related to clinical features
LUAD samples downloaded from TCGA were binary classified according to clinical information. Classifications included age (≥60 versus <60), gender (female versus male), pathologic M (M1 versus M0), pathologic N (N3 + N2 versus N0 + N1), pathologic T (T3 + T4 versus T1 + T2), pathologic stage (I + II versus III + IV), cancer status (with versus without), smoking history (yes versus no) and vital status (living versus deceased). The mRNAs, miRNAs and lncRNAs related to clinical features were then screened from differentially expressed RNAs between LUAD and normal samples, using edgeR package and multtest package. lncRNAs, miRNAs and mRNAs with FDR <0.05 and |logFC|>0.585 were considered to be related to clinical features.
Construction of LUAD-related lncRNA-miRNA-mRNA ceRNA network
The miRNAs targeted by differentially expressed lncRNAs were predicted using miRcode (version 11, http://www.mircode.org/)20 and starBase (version 2.0)21 databases. Results from these two databases were combined and intersected with differentially expressed miRNAs. The intersection contained differentially expressed miRNAs targeted by differentially expressed lncRNAs. A LUAD-related lncRNA-miRNA regulation network was thus obtained.
Similarly, differentially expressed mRNAs targeted by differentially expressed miRNAs were obtained based on the information of miRTarBase (version 6.0, http://mirtarbase.mbc.nctu.edu.tw).22,23 Then the common PPIs (protein–protein interactions) existed in three databases, including BioGRID (http://thebiogrid.org/),24 HPRD (Human Protein Reference Database, http://www.hprd.org/)25 and DIP (Database of Interacting Proteins, http://dip.doe-mbi.ucla.edu/),26 were identified. PPIs corresponding to differentially expressed mRNAs targeted by differentially expressed miRNAs were extracted and then integrated with differentially expressed miRNA-mRNA regulatory relationships, generating a LUAD-related miRNA-mRNA regulation network.
The lncRNA-miRNA and miRNA-mRNA regulatory networks were combined to obtain a comprehensive lncRNA-miRNA-mRNA ceRNA regulatory network.
Functional and pathway annotation of mRNAs in the ceRNA network
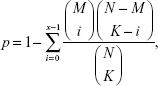
In order to reveal LUAD-related biological functions and pathways, GO (gene ontology) biological process27 analysis and KEGG (Kyoto Encyclopedia of Genes and Genomes) pathway analysis28 were performed for mRNAs in the ceRNA regulatory network. Fisher’s exact test was used during the enrichment process. Fisher’s score could be calculated according to Table 1 and the following equation:
|
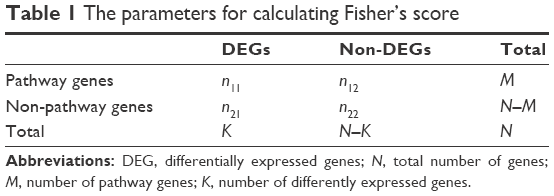 | Table 1 The parameters for calculating Fisher’s score |
where N indicates the total number of genes, M indicates the number of pathway genes, K indicates the number of differentially expressed genes, and the Fisher’s score p indicates the possibility that at least x in K differentially expressed genes were pathway genes.
Construction of SVM classification model
The optimal subset of feature genes used for SVM classification model was selected from differentially expressed mRNAs in the LUAD specific ceRNA network, using recursive feature elimination (RFE),29 an algorithm of machine learning. Specifically, the optimal subset was selected through a leave-one-out cross-validation approach. Expression values of selected feature genes in the combination were used as eigenvalues to estimate the possibility that a sample belonged to certain classification. Based on the possibility, a sample was classified to be LUAD or a normal sample. The optimal subset was the combination giving the best SVM classification accuracy for TCGA samples. The LUAD specific SVM classifier was built based on the optimal subset of feature genes.
GSE10072 and GSE43458 datasets were used to validate the robustness and transferability of the SVM classifier. This SVM classifier was trained with a fivefold cross validation strategy and its performance was assessed by establishing receiver operation characteristic (ROC) curve, followed by detection of prediction accuracy, sensitivity, specificity, positive prediction value, negative prediction value and AUC (area under ROC curve).
Identification of prognosis related mRNAs, miRNAs and lncRNAs
The expression value of each differentially expressed mRNA, miRNA and lncRNA and the survival information of each sample were extracted from TCGA dataset. Prognosis-associated lncRNAs, miRNAs and mRNAs were identified by univariate Cox regression using the survfit function of the survival package (version 2.40-1, https://cran.r-project.org/package=survival)30 under R. Cancerous samples were divided into two groups based on the cutoff (median expression value), followed Kaplan–Meier curve analysis.
Results
Differentially expressed lncRNAs, miRNAs and mRNAs in LUAD samples
A total of 811 lncRNAs, 1,047 miRNAs and 18,013 mRNAs were obtained from mRNA-seq data. RNAs with low expression level (expression value less than 1.0) were removed, with 396 lncRNAs, 517 miRNAs and 14,012 mRNAs remained. Significant differentially expressed lncRNAs, miRNAs and mRNAs were obtained by comparing LUAD and normal samples. In total, 21, 53 and 925 differentially expressed lncRNAs, miRNAs and mRNAs were obtained in LUAD samples. Sample hierarchical cluster analysis was then performed based on the expression value of these differentially expressed RNAs. The results of heatmap (Figure 1A–C) showed that LUAD samples were clustered together and discriminated from normal samples.
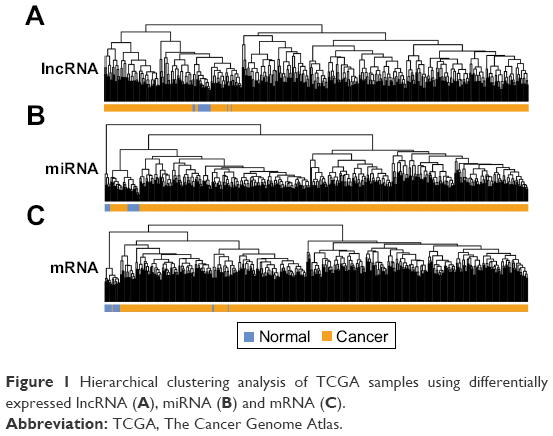 | Figure 1 Hierarchical clustering analysis of TCGA samples using differentially expressed lncRNA (A), miRNA (B) and mRNA (C). |
Key lncRNAs, miRNAs and mRNAs related to clinical features
In order to screen lncRNAs, miRNAs and mRNAs related to clinical features, LUAD samples were binary classified according to age (≥60 versus <60), gender (female versus male), pathologic M (M1 versus M0), pathologic N (N3 + N2 versus N0 + N1), pathologic T (T3 + T4 versus T1 + T2), pathologic stage (I + II versus III + IV), cancer status (with versus without), smoking history (yes versus no) and vital status (living versus deceased). The differentially expressed lncRNAs, miRNAs and mRNAs were further compared and identified between each two groups according to different clinical features, which were summarized in Table 2.
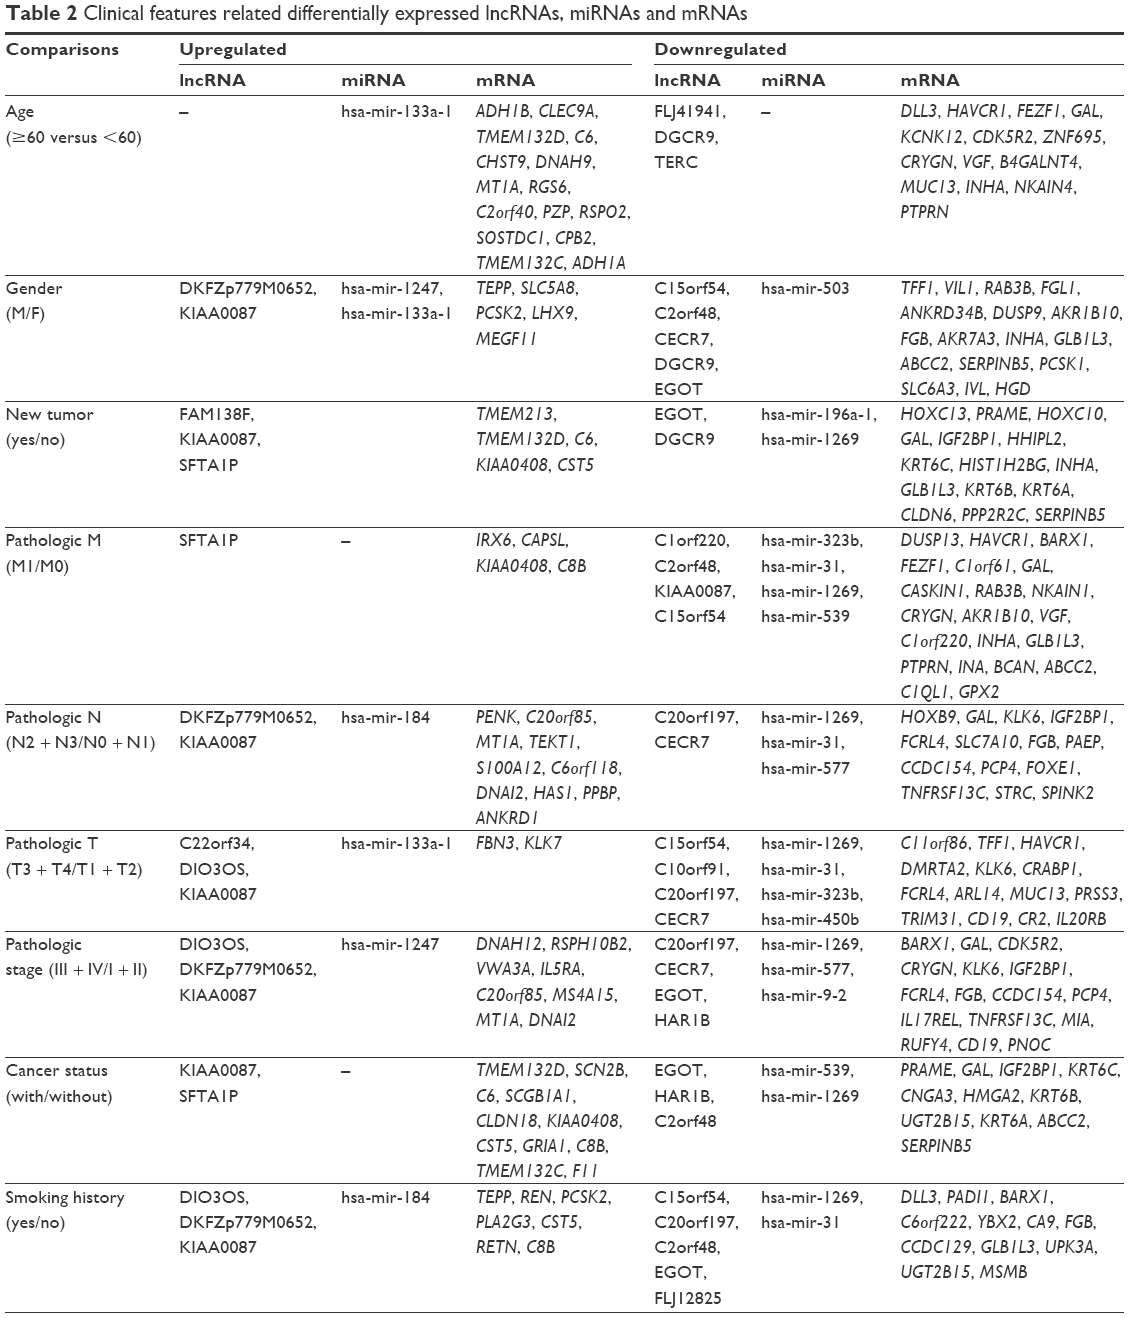 | Table 2 Clinical features related differentially expressed lncRNAs, miRNAs and mRNAs |
The miRNA-lncRNA and miRNA-mRNA regulatory relationships
Elucidation of the physiological roles of lncRNAs is challenging as complex and diverse mechanisms are involved.11 We used bioinformatics methods to predict the roles of lncRNAs in regulating miRNAs in LUAD. The regulatory relationships between significant differentially expressed miRNAs and differentially expressed lncRNAs were predicted using miRecode20 and starBase21 database. We first acquired 264 lncRNA-miRNA regulation pairs from miRecode and 217 regulation pairs from starBase, of which lncRNAs were differentially expressed between LUAD and normal samples. Combining these two sets, a total of 291 lncRNA-miRNA pairs were obtained, 41 of which were LUAD related differentially expressed miRNAs. The 41 lncRNA-miRNA pairs were integrated to build a miRNA-lncRNA regulatory network consisting of 31 nodes, including 6 lncRNAs (3 upregulated versus 3 downregulated) and 25 miRNAs (6 upregulated versus 19 downregulated) (Figure 2A).
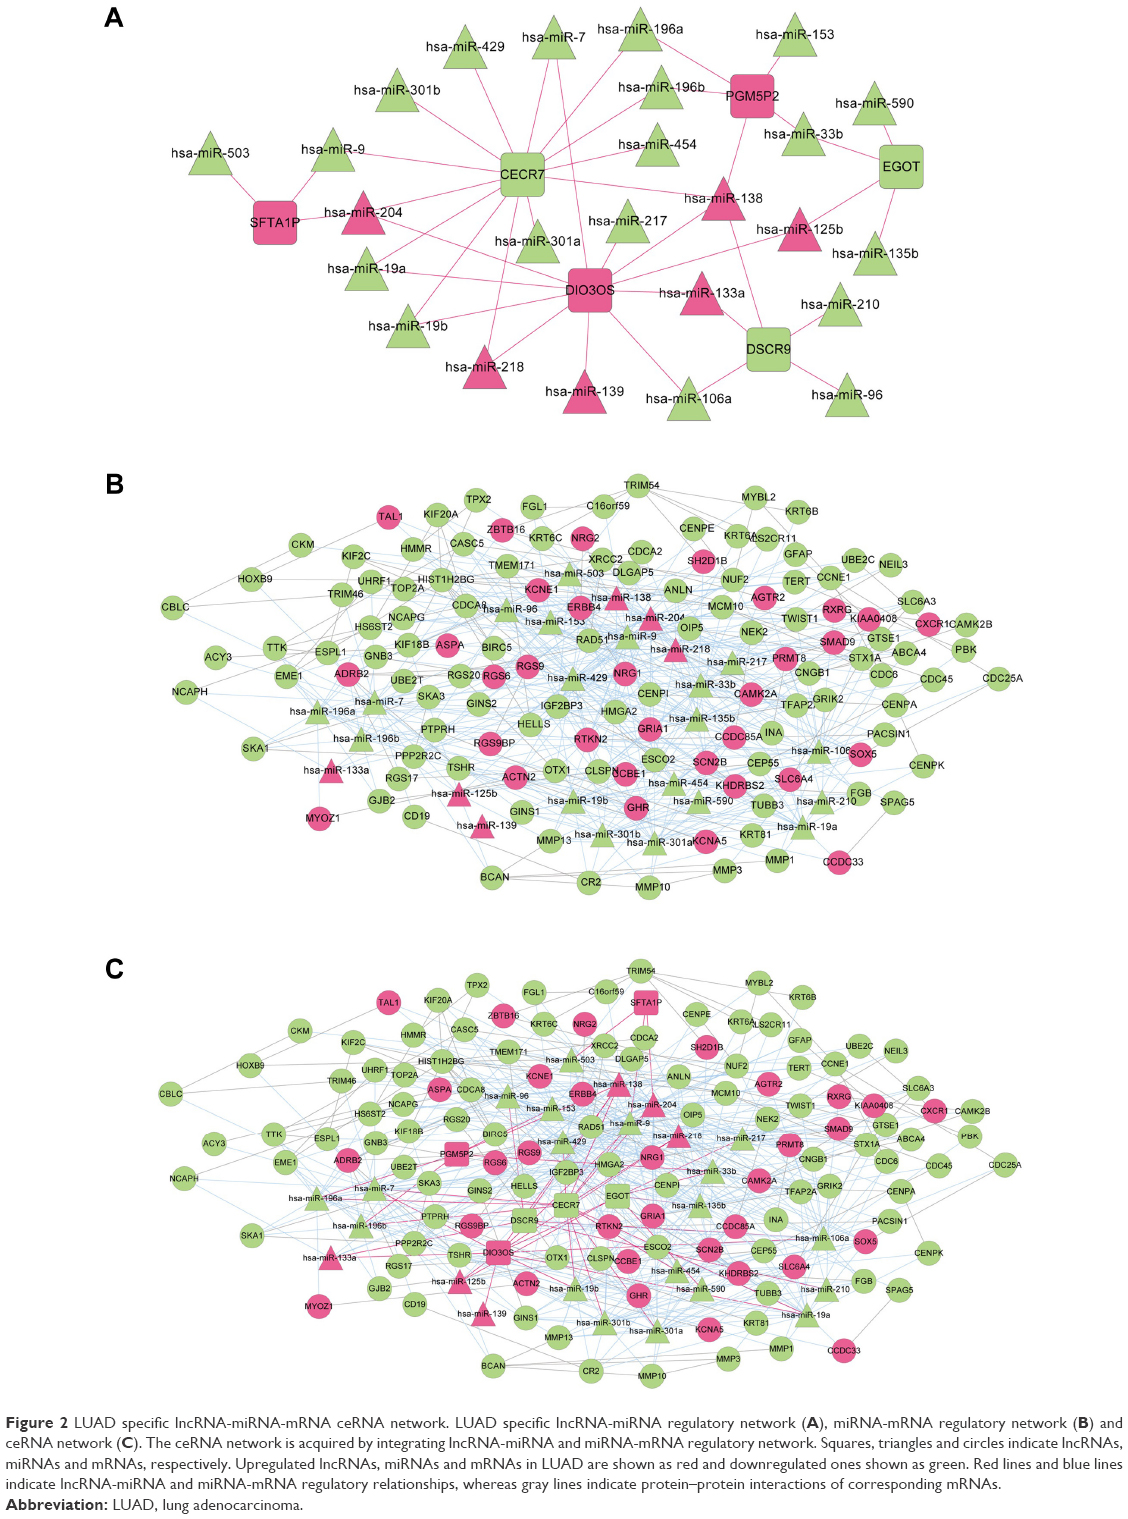 | Figure 2 LUAD specific lncRNA-miRNA-mRNA ceRNA network. LUAD specific lncRNA-miRNA regulatory network (A), miRNA-mRNA regulatory network (B) and ceRNA network (C). The ceRNA network is acquired by integrating lncRNA-miRNA and miRNA-mRNA regulatory network. Squares, triangles and circles indicate lncRNAs, miRNAs and mRNAs, respectively. Upregulated lncRNAs, miRNAs and mRNAs in LUAD are shown as red and downregulated ones shown as green. Red lines and blue lines indicate lncRNA-miRNA and miRNA-mRNA regulatory relationships, whereas gray lines indicate protein–protein interactions of corresponding mRNAs. |
The regulatory relationships between significant differentially expressed miRNAs and significant differentially expressed mRNAs were obtained using miRTarBase database, a database providing the latest and broadest experimental validated miRNA-mRNA interactions.22,23 Most miRNAs in Figure 2A were predicted to have targeted differentially expressed mRNAs, except hsa-miR-139 and hsa-miR-590. A total of 126 differentially expressed mRNAs were found to be targets of these miRNAs. Based on the information of BioGRID, HPRD and DIP databases, PPIs corresponding to these target mRNAs were predicted. A miRNA-mRNA network was constructed by integrating miRNA-mRNA regulatory relationships and PPIs of target mRNAs. As shown in Figure 2B, the miRNA-mRNA regulatory network contained 25 miRNAs (including hsa-miR-139 and hsa-miR-590) and 126 mRNAs, which formed a total of 549 edges, 115 of which were mRNA-mRNA interactions and 434 were miRNA-mRNA regulation relationships.
Construction of lncRNA-miRNA-mRNA ceRNA network
To provide an insight about how lncRNAs and miRNAs cooperate to regulate mRNAs in LUAD, a ceRNA network (Figure 2C) was constructed, through the integration of lncRNA-miRNA network and miRNA-mRNA network. All nodes in the ceRNA network were LUAD related differentially expressed lncRNAs, miRNAs or mRNAs. A total of 157 nodes were included in the ceRNA network, including 6 lncRNAs, 25 miRNAs (including hsa-miR-139 and hsa-miR-590) and 126 mRNAs. In total, 588 edges were formed, including 39 lncRNA-miRNA regulation relationships, 434 miRNA-mRNA regulation relationships and 115 PPIs of corresponding mRNAs.
In order to reveal the functional processes involved in LUAD development and progression, mRNAs in the ceRNA network (Figure 2C) were subjected to Fisher’s exact test-based GO biological process analysis. We acquired 18 significantly related GO biological processes, most of which were associated with cell cycle (Table 3). We also performed KEGG pathway analysis for mRNAs in the ceRNA network, and 5 significant KEGG pathways were identified, including ErbB signaling pathway, cell cycle, homologous recombination, neuroactive ligand-receptor interaction and pathways in cancer (Table 3).
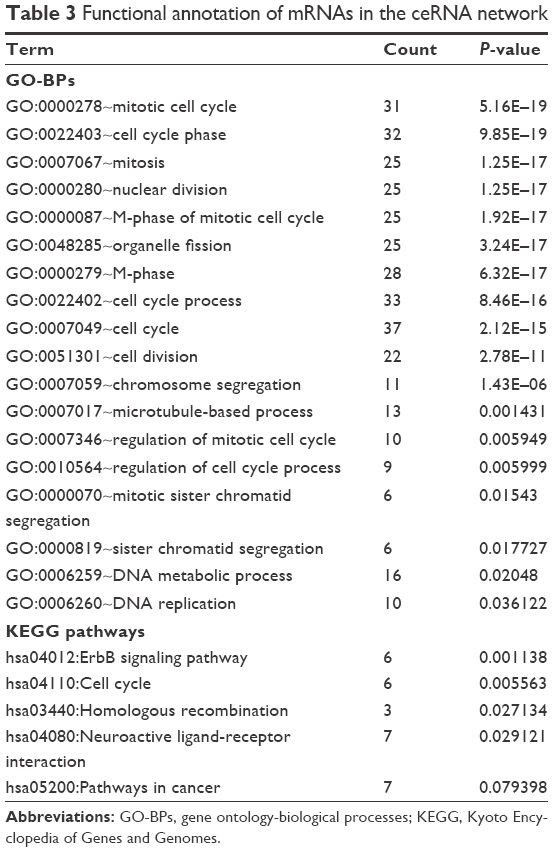 | Table 3 Functional annotation of mRNAs in the ceRNA network |
SVM classification model of cancerous samples
In order to provide an efficient and reliable molecular tool for LUAD diagnosis, we build a LUAD specific SVM classifier based on the feature genes associated with LUAD. Optimal subset of feature genes was selected from differentially expressed mRNAs in the ceRNA network (Figure 2C) using RFE.29 The accuracy reached the best (95.3%) when the number of selected feature genes in the optimal subset was 44 (Figure 3A). The 44 selected feature genes were summarized in Table 4 and used for the construction of LUAD specific SVM classifier. Scatter plot of TCGA samples based on the SVM classifier was shown as Figure 3B.
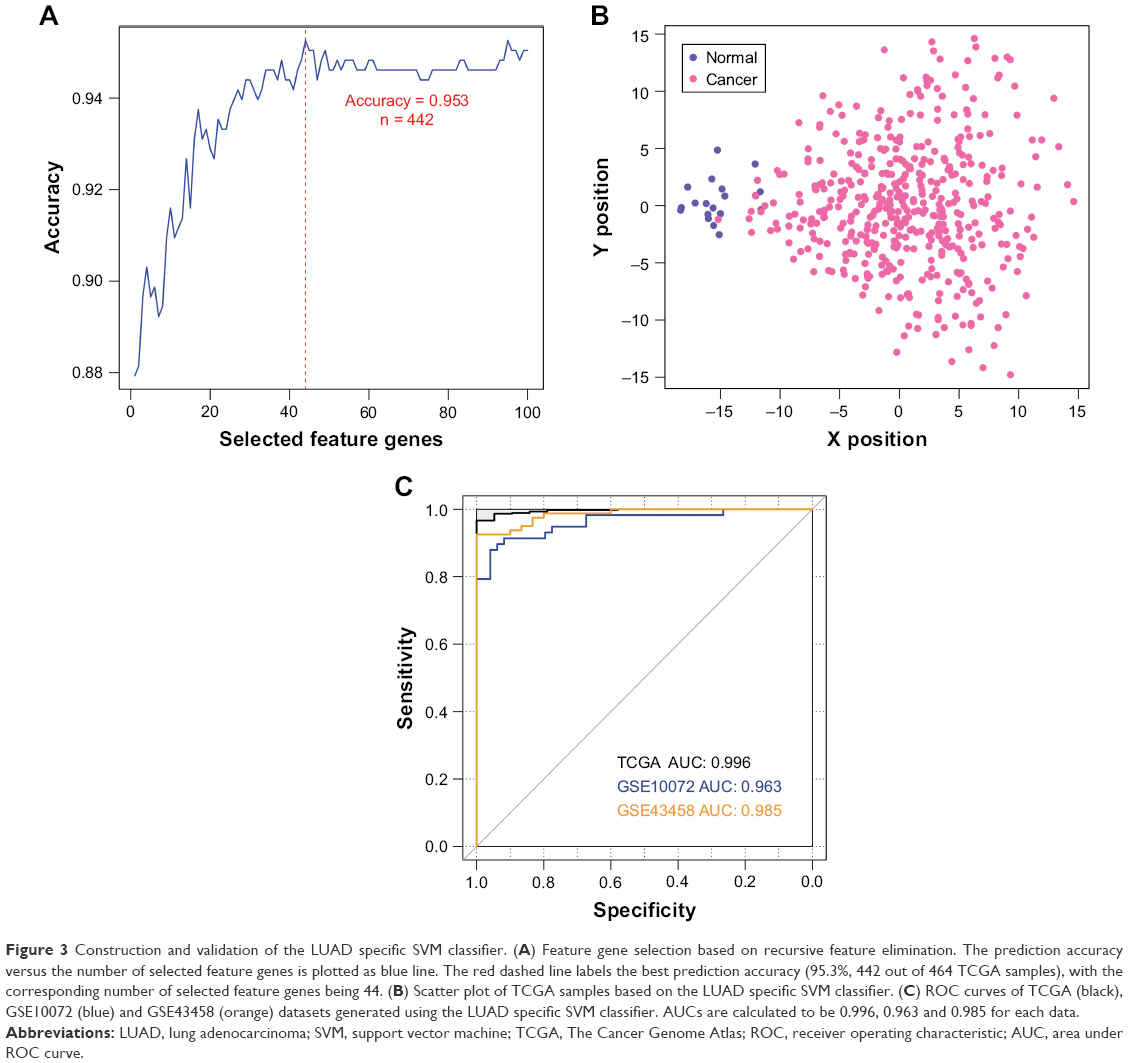 | Figure 3 Construction and validation of the LUAD specific SVM classifier. (A) Feature gene selection based on recursive feature elimination. The prediction accuracy versus the number of selected feature genes is plotted as blue line. The red dashed line labels the best prediction accuracy (95.3%, 442 out of 464 TCGA samples), with the corresponding number of selected feature genes being 44. (B) Scatter plot of TCGA samples based on the LUAD specific SVM classifier. (C) ROC curves of TCGA (black), GSE10072 (blue) and GSE43458 (orange) datasets generated using the LUAD specific SVM classifier. AUCs are calculated to be 0.996, 0.963 and 0.985 for each data. |
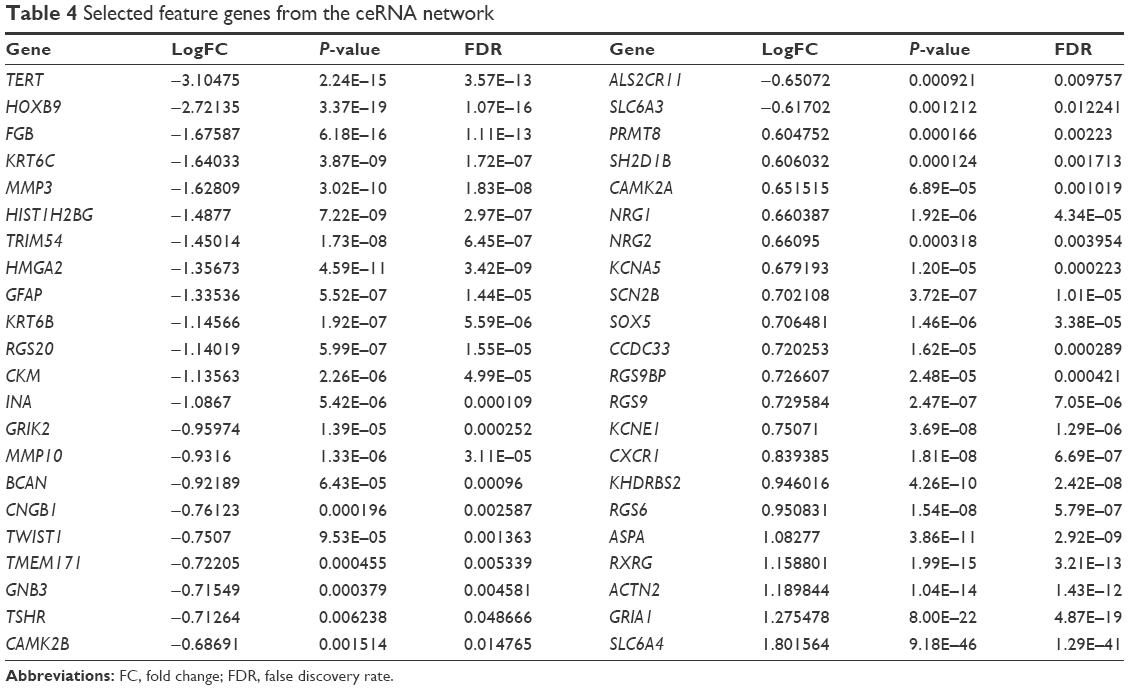 | Table 4 Selected feature genes from the ceRNA network |
To validate the robustness and transferability of the SVM classifier, two independent datasets under accession number of GSE1007216 and GSE4345815 were downloaded from GEO. After normalization, samples in the validation datasets were classified using the SVM classifier. As a result, samples in the GSE10072 dataset could be correctly classified with an accuracy of 90.7% (97 out of 107 samples), and samples in the GSE43458 dataset could be classified with a precision of 97.3% (107 out of 110 samples) (Table 5). Besides prediction accuracy, the performance of our SVM classification model were also assessed using sensitivity, specificity, positive prediction value, negative prediction value and AUC (area under ROC curve) (Figure 3C, Table 5).
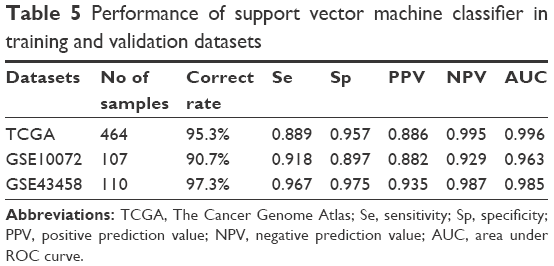 | Table 5 Performance of support vector machine classifier in training and validation datasets |
The lncRNAs, miRNAs and mRNAs related to prognosis
Prognosis-related RNAs for LUAD were identified from differentially expressed lncRNAs, miRNAs and mRNAs using univariate cox analysis. In total, 5 lncRNAs, 6 miRNAs and 44 mRNAs were identified to be prognosis related (Table 6). Among them, PGM5P2 (phosphoglucomutase 5 pseudogene 2) and SFTA1P (surfactant associated 1) were lncRNAs and hsa-miR-96 and hsa-miR-204 were miRNAs in the ceRNA network. RGS20 (regulator of G protein signaling 20), RGS9BP (RGS9-binding protein), FGB (fibrinogen beta chain) and INA (alpha-internexin) were mRNAs in the feature subset of the SVM classifier. According to the ceRNA network (Figure 2C), two miRNA-mRNA pairs and an lncRNA-miRNA-mRNA triplet were formed among these prognosis related RNAs, specifically hsa-miR-96-INA, hsa-miR-96-RGS20 and SFTA1P-hsa-miR-204-RGS20.
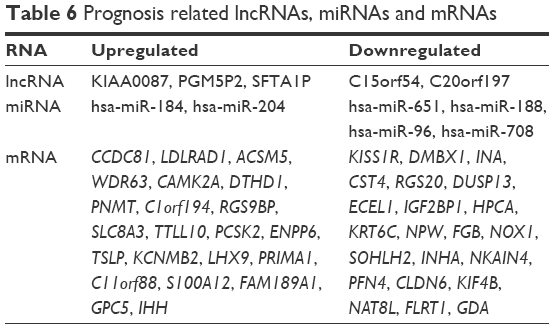 | Table 6 Prognosis related lncRNAs, miRNAs and mRNAs |
We further performed Kaplan–Meier curve analyses for these prognosis-related RNAs (Figure 4). Our results showed that LUAD patients with higher expression level of PGM5P2, SFTA1P, RGS9BP and INA had a better prognosis, and patients with higher expression level of hsa-miR-96, hsa-miR-204, RGS20 and FGB had a worse prognosis (Figure 4). Meanwhile, the expression level of PGM5P2, SFTA1P, hsa-miR-204 and RGS9BP were downregulated in LUAD samples whereas hsa-miR-96, RGS20, FGB and INA were upregulated.
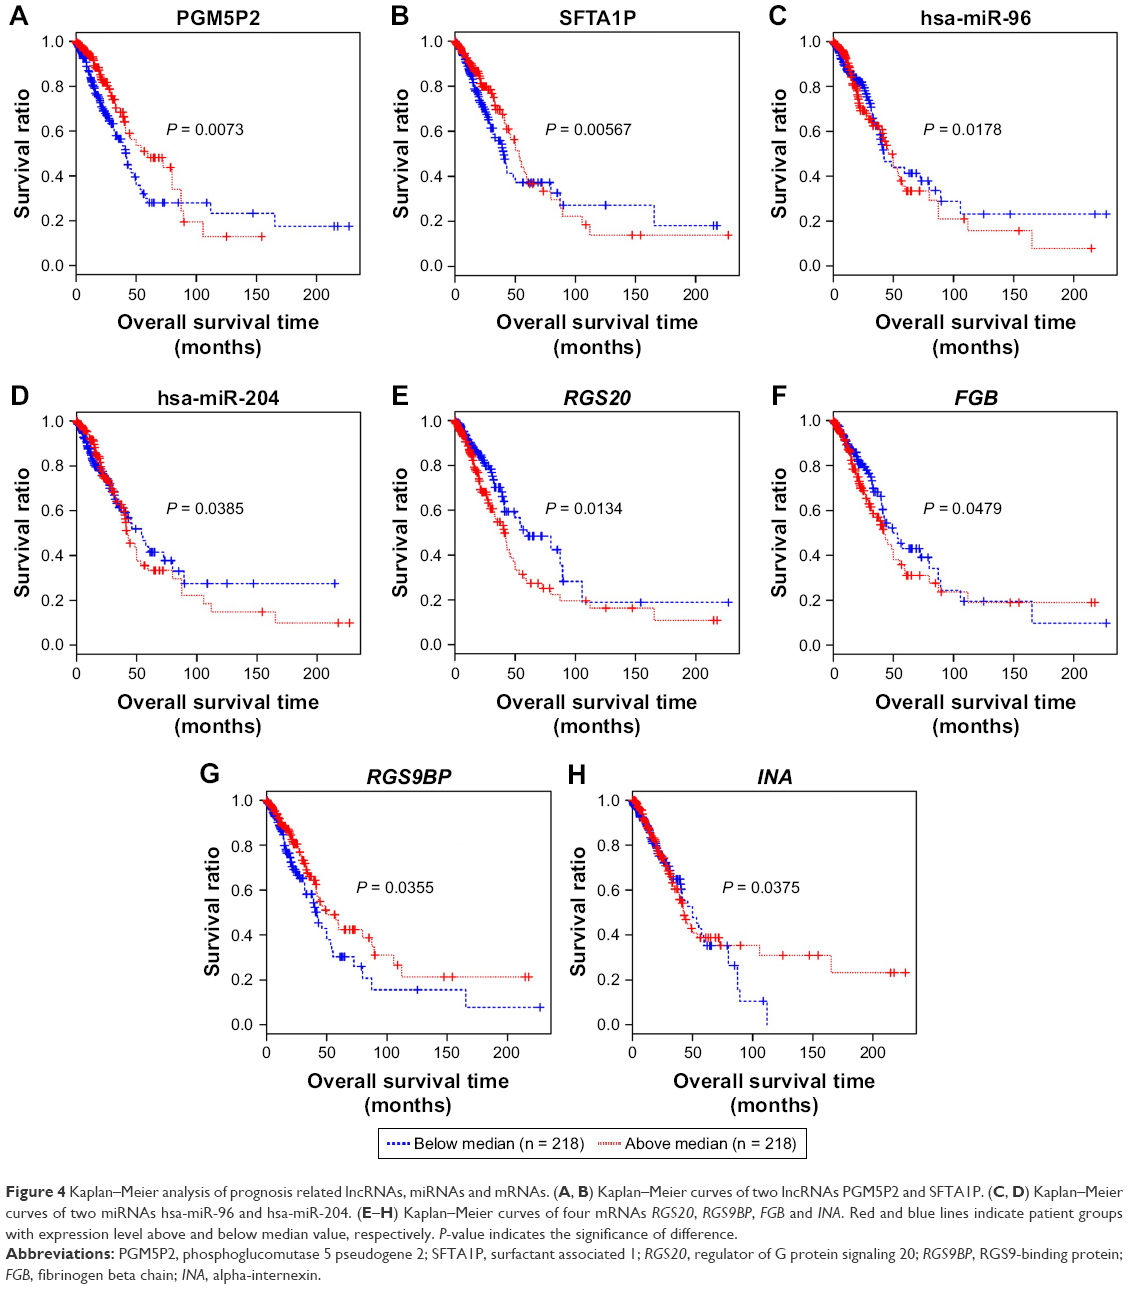 | Figure 4 Kaplan–Meier analysis of prognosis related lncRNAs, miRNAs and mRNAs. (A, B) Kaplan–Meier curves of two lncRNAs PGM5P2 and SFTA1P. (C, D) Kaplan–Meier curves of two miRNAs hsa-miR-96 and hsa-miR-204. (E–H) Kaplan–Meier curves of four mRNAs RGS20, RGS9BP, FGB and INA. Red and blue lines indicate patient groups with expression level above and below median value, respectively. P-value indicates the significance of difference. |
Discussion
In the present study, we constructed a ceRNA network delineating interplays among differentially expressed lncRNAs, miRNAs and mRNAs between LUAD and normal samples. An optimal subset of 44 selected feature genes was identified in the network and the SVM classifier SVM constructed with these 44 feature genes could accurately classify samples in both TCGA training data and GSE10072 and GSE43458 validation data. Remarkably, we also identified key prognosis-related RNAs in the ceRNA network, including 2 miRNAs (hsa-miR-96, hsa-miR-204), 2 lncRNAs (PGM5P2, SFTA1P) and 4 selected feature mRNAs (RGS20, RGS9BP, FGB, INA). Among the 8 prognostic RNAs, higher expression level of PGM5P2, SFTA1P, RGS9BP and INA were shown to correlate with better prognosis, indicating tumor-suppressive roles of these RNAs. Meanwhile, higher expression levels of hsa-miR-96, hsa-miR-204, RGS20 and FGB were found to correlate with worse prognosis, indicating tumor-promoting roles of these RNAs.
Most of these RNAs have been previously shown to be involved in certain types of cancers. INA is a neuronal intermediate filament protein,31 correlated with better prognosis of glioblastoma.32,33 RGS20 is a negative regulator of heterotrimeric G proteins and may promote cancer cell metastasis by upregulating vimentin and downregulating E-cadherin.34,35 FGB is one component of fibrinogen, which is a critical for tumor cell proliferation, angiogenesis and cancer metastasis.36,37 Elevated plasma level of fibrinogen is a strong indicator of poor prognosis of various tumors, such as breast tumor,38 prostate cancer,39 and lung cancer.40 SFTA1P is a lncRNA tumor suppressor functioning through inhibiting LUAD cell migration, invasion and metastasis.41–43 RGS9BP is an anchor protein of RGS9, was also identified as being involved in bladder cancer,44 though the role it played remained elusive. The function of PGM5P2 is also unclear, however, it is implicated that PGM5P2 may be involved in pro-apoptosis and antiangiogenesis process,45 which is essential for the development and progression of cancer. Considering their roles in different cancer types, it is reasonable that these genes may play a role in the development and progression of LUAD. However, further studies are still needed to gain an insight into the roles of these molecules in LUAD.
The remaining two RNAs, however, was found to play controversial roles in different cancer types. hsa-miR-96 is involved in various cancers, however, divergent roles are reported with respect to different cancer types.46,47 It is shown that hsa-miR-96 can suppress tumor invasion in renal cell carcinoma47 and colorectal cancer,48 but it can promote cancer cell proliferation and invasion in breast cancer,49,50 bladder cancer46 and lung cancer.51 hsa-miR-204 has been reported to be a tumor suppressor in clear cell renal cell carcinoma, induced by VHL and functioning through inhibiting macroautophage by targeting LC3B.52 Besides, its variant hsa-miR-204-5p is also involved in endometrial carcinoma, and is shown to suppress the clonogenic growth, migration and invasion of endometrial carcinoma cells.53 However, we found that it played a tumor-promoting role in LUAD. Therefore, we speculate that hsa-miR-96 and hsa-miR-204 may also play divergent roles in different cancer types, which should be addressed in future experimental research.
Further, two miRNA-mRNA regulation pairs and an lncRNA-miRNA-mRNA regulation triplet were formed among these prognosis related RNAs according to the ceRNA network. Specifically, hsa-miR-96 formed two miRNA-mRNA regulation pairs with INA and RGS20, whereas hsa-miR-204 formed an lncRNA-miRNA-mRNA regulation triplet with SFTA1P and RGS20. We speculate that hsa-miR-96 may target INA and RGS20 in LUAD, whereas hsa-miR-204 may target RGS20 and regulated by SFTA1P. However, further experimental and functional studies are needed to disclose and confirm the pathways these RNAs involved.
However, the limitation of SVM classification model on evaluating the selected feature genes is lack of experiment validation. Further experiments, such as quantitative reverse-transcription PCR and/or western blot methods are still required to confirm our results. Moreover, the Kaplan–Meier curve analysis for these 8 prognosis-related RNAs was performed individually. If the prognostic value of these RNAs is validated by various combination analyses, more valuable results will be obtained for predicting the prognosis of LUAD.
In summary, we constructed a LUAD-specific SVM classification model based on the LUAD-related ceRNA network. The SVM classifier may serve as a novel diagnostic predictor of LUAD. Moreover, we also identified 8 key molecular markers with prognostic value from the ceRNA network, including PGM5P2, SFTA1P, hsa-miR-204, hsa-miR-96, RGS20, RGS9BP, FGB and INA. These molecular markers may be promising prognostic markers and drug targets in future clinical practice.
Acknowledgments
This work was supported by Chinese Medicine Science and Technology Development Project Fund of Shandong Province (project no 2017-200), Postdoctoral Applications Research Project Fund of Qingdao (project no 2016055) and The Affiliated Hospital of Qingdao University Youth Research Fund (2016).
Disclosure
All authors declared that they have no conflicts of interest in this work.
References
Imielinski M, Berger AH, Hammerman PS, et al. Mapping the hallmarks of lung adenocarcinoma with massively parallel sequencing. Cell. 2012;150(6):1107–1120. | ||
Stewart BW, Wild C, editors. World cancer report 2014. Lyon France: International Agency for Research on Cancer, World Health Organization. | ||
Saito M, Suzuki H, Kono K, Takenoshita S, Kohno T. Treatment of lung adenocarcinoma by molecular-targeted therapy and immunotherapy. Surg Today. 2018;48(1):1–8. | ||
Camidge DR, Pao W, Sequist LV. Acquired resistance to TKIs in solid tumours: Learning from lung cancer. Nat Rev Clin Oncol. 2014;11(8):473–481. | ||
Takahashi T, Nau MM, Chiba I, et al. p53: A frequent target for genetic abnormalities in lung cancer. Science. 1989;246(4929):491–494. | ||
Singh A, Misra V, Thimmulappa RK, et al. Dysfunctional KEAP1-NRF2 interaction in non-small-cell lung cancer. PLoS Medicine. 2006;3(10):e420. | ||
Sanchez-Cespedes M, Parrella P, Esteller M, et al. Inactivation of LKB1/STK11 is a common event in adenocarcinomas of the lung. Cancer Res. 2002;62(13):3659–3662. | ||
Morris KV, Mattick JS. The rise of regulatory RNA. Nat Rev Genet. 2014;15(6):423–437. | ||
Liz J, Esteller M. lncRNAs and microRNAs with a role in cancer development. Biochim Biophys Acta. 2016;1859(1):169–176. | ||
Garzon R, Calin GA, Croce CM. MicroRNAs in Cancer. Annu Rev Med. 2009;60:167–179. | ||
Huarte M. The emerging role of lncRNAs in cancer. Nat Med. 2015;21(11):1253–1261. | ||
Tay Y, Rinn J, Pandolfi PP. The multilayered complexity of ceRNA crosstalk and competition. Nature. 2014;505(7483):344–352. | ||
Sui J, Li YH, Zhang YQ, et al. Integrated analysis of long non-coding RNA-associated ceRNA network reveals potential lncRNA biomarkers in human lung adenocarcinoma. Int J Oncol. 2016;49(5):2023–2036. | ||
Li DS, Ainiwaer JL, Sheyhiding I, Zhang Z, Zhang LW. Identification of key long non-coding RNAs as competing endogenous RNAs for miRNA-mRNA in lung adenocarcinoma. Eur Review Med Pharmacol Sci. 2016;20(11):2285–2295. | ||
Kabbout M, Garcia MM, Fujimoto J, et al. ETS2 mediated tumor suppressive function and MET oncogene inhibition in human non-small cell lung cancer. Clin Cancer Res. 2013;19(13):3383–3395. | ||
Landi MT, Dracheva T, Rotunno M, et al. Gene expression signature of cigarette smoking and its role in lung adenocarcinoma development and survival. PLoS One. 2008;3(2):e1651. | ||
Carvalho B, Bengtsson H, Speed TP, Irizarry RA. Exploration, normalization, and genotype calls of high-density oligonucleotide SNP array data. Biostatistics. 2007;8(2):485–499. | ||
Robinson MD, McCarthy DJ, Smyth GK. edgeR: A bioconductor package for differential expression analysis of digital gene expression data. Bioinformatics. 2010;26(1):139–140. | ||
Ge Y, Dudoit S, Speed TP. Resampling-based multiple testing for microarray data analysis. Test. 2003;12(1):1–77. | ||
Jeggari A, Marks DS, Larsson E. miRcode: A map of putative microRNA target sites in the long non-coding transcriptome. Bioinformatics. 2012;28(15):2062–2063. | ||
Li J-H, Liu S, Zhou H, Qu L-H, Yang J-H. starBase v2. 0: decoding miRNA-ceRNA, miRNA-ncRNA and protein–RNA interaction networks from large-scale CLIP-Seq data. Nucleic Acids Res. 2014;42(D1):D92–D97. | ||
Hsu S-D, Lin F-M, Wu W-Y, et al. miRTarBase: A database curates experimentally validated microRNA–target interactions. Nucleic Acids Res. 2011;39(Suppl.1):D163–D169. | ||
Chou C-H, Chang N-W, Shrestha S, et al. miRTarBase 2016: Updates to the experimentally validated miRNA-target interactions database. Nucleic Acids Res. 2016;44(D1):D239–D247. | ||
Chatr-Aryamontri A, Breitkreutz BJ, Oughtred R, et al. The BioGRID interaction database: 2015 update. Nucleic Acids Res. 2015;43(Database issue):D470–D478. | ||
Keshava Prasad TS, Goel R, Kandasamy K, et al. Human protein reference database – 2009 update. Nucleic Acids Res. 2009;37(Database issue):D767–D772. | ||
Salwinski L, Miller CS, Smith AJ, Pettit FK, Bowie JU, Eisenberg D. The Database of interacting proteins: 2004 update. Nucleic Acids Res. 2004;32(Database issue):D449–D451. | ||
Ashburner M, Ball CA, Blake JA, et al. Gene ontology: Tool for the unification of biology. The Gene Ontology Consortium. Nat Genet. 2000;25(1):25–29. | ||
Kanehisa M, Goto S. KEGG: Kyoto encyclopedia of genes and genomes. Nucleic Acids Res. 2000;28(1):27–30. | ||
Baur B, Bozdag S. A feature selection algorithm to compute gene centric methylation from probe level methylation data. PLoS One. 2016;11(2):e0148977. | ||
Singh R, Mukhopadhyay K. Survival analysis in clinical trials: Basics and must know areas. Perspect Clin Res. 2011;2(4):145–148. | ||
Lariviere RC, Julien JP. Functions of intermediate filaments in neuronal development and disease. J Neurobiol. 2004;58(1):131–148. | ||
Suh JH, Park CK, Park SH. Alpha internexin expression related with molecular characteristics in adult glioblastoma and oligodendroglioma. J Korean Med Sci. 2013;28(4):593–601. | ||
Mokhtari K, Ducray F, Kros JM, et al. Alpha-internexin expression predicts outcome in anaplastic oligodendroglial tumors and may positively impact the efficacy of chemotherapy: European Organization for Research and Treatment of Cancer trial 26951. Cancer. 2011;117(13):3014–3026. | ||
Li Q, Jin W, Cai Y, et al. Regulator of G protein signaling 20 correlates with clinicopathological features and prognosis in triple-negative breast cancer. Biochemi Biophys Res Commun. 2017;485(3):693–697. | ||
Yang L, Lee MM, Leung MM, Wong YH. Regulator of G protein signaling 20 enhances cancer cell aggregation, migration, invasion and adhesion. Cell Signal. 2016;28(11):1663–1672. | ||
Perisanidis C, Psyrri A, Cohen EE, et al. Prognostic role of pretreatment plasma fibrinogen in patients with solid tumors: A systematic review and meta-analysis. Cancer Treat Rev. 2015;41(10):960–970. | ||
Palumbo JS, Degen JL. Mechanisms coupling the hemostatic system to colitis-associated cancer. Thromb Res. 2010;125(Suppl. 2):S39–S43. | ||
Krenn-Pilko S, Langsenlehner U, Stojakovic T, Pichler M, Gerger A, Kapp KS, Langsenlehner T. An elevated preoperative plasma fibrinogen level is associated with poor disease-specific and overall survival in breast cancer patients. Breast. 2015;24(5):667–672. | ||
Thurner EM, Krenn-Pilko S, Langsenlehner U, et al. The association of an elevated plasma fibrinogen level with cancer-specific and overall survival in prostate cancer patients. World J Urol. 2015;33(10):1467–1473. | ||
Palumbo JS, Kombrinck KW, Drew AF, Grimes TS, Kiser JH, Degen JL, Bugge TH. Fibrinogen is an important determinant of the metastatic potential of circulating tumor cells. Blood. 2000;96(10):3302–3309. | ||
Zhao W, Luo J, Jiao S. Comprehensive characterization of cancer subtype associated long non-coding RNAs and their clinical implications. Sci Rep. 2014;4:6591. | ||
Zhang H, Xiong Y, Xia R, Wei C, Shi X, Nie F. The pseudogene-derived long noncoding RNA SFTA1P is down-regulated and suppresses cell migration and invasion in lung adenocarcinoma. Tumour Biol. 2017;39(2):1010428317691418. | ||
Huang GQ, Ke ZP, Hu HB, Gu B. Co-expression network analysis of long noncoding RNAs (IncRNAs) and cancer genes reveals SFTA1P and CASC2 abnormalities in lung squamous cell carcinoma. Cancer Biol Ther. 2017;18(2):115–122. | ||
Yang Z, Li C, Fan Z, et al. Single-cell sequencing reveals variants in ARID1A, GPRC5A and MLL2 driving self-renewal of human bladder cancer stem cells. Eur Urol. 2017;71(1):8–12. | ||
Miao Y, Cui L, Chen Z, Zhang L. Gene expression profiling of DMU-212-induced apoptosis and anti-angiogenesis in vascular endothelial cells. Pharm Biol. 2016;54(4):660–666. | ||
Wu Z, Liu K, Wang Y, Xu Z, Meng J, Gu S. Upregulation of microRNA-96 and its oncogenic functions by targeting CDKN1A in bladder cancer. Cancer Cell Int. 2015;15:107. | ||
Yu N, Fu S, Liu Y, et al. miR-96 suppresses renal cell carcinoma invasion via downregulation of Ezrin expression. J Exp Clin Cancer Res. 2015;34:107. | ||
Ress AL, Stiegelbauer V, Winter E, et al. MiR-96-5p influences cellular growth and is associated with poor survival in colorectal cancer patients. Mol Carcinog. 2015;54(11):1442–1450. | ||
Lin H, Dai T, Xiong H, et al. Unregulated miR-96 induces cell proliferation in human breast cancer by downregulating transcriptional factor FOXO3a. PLoS One. 2010;5(12):e15797. | ||
Guttilla IK, White BA. Coordinate regulation of FOXO1 by miR-27a, miR-96, and miR-182 in breast cancer cells. J Biol Chem. 2009;284(35):23204–23216. | ||
Guo H, Li Q, Li W, Zheng T, Zhao S, Liu Z. MiR-96 downregulates RECK to promote growth and motility of non-small cell lung cancer cells. Mol Cell Biochem. 2014;390(1–2):155–160. | ||
Mikhaylova O, Stratton Y, Hall D, et al. VHL-regulated MiR-204 suppresses tumor growth through inhibition of LC3B-mediated autophagy in renal clear cell carcinoma. Cancer Cell. 2012;21(4):532–546. | ||
Bao W, Wang HH, Tian FJ, et al. A TrkB-STAT3-miR-204-5p regulatory circuitry controls proliferation and invasion of endometrial carcinoma cells. Mol Cancer. 2013;12:155. |
 © 2018 The Author(s). This work is published and licensed by Dove Medical Press Limited. The
full terms of this license are available at https://www.dovepress.com/terms
and incorporate the Creative Commons Attribution
- Non Commercial (unported, 3.0) License.
By accessing the work you hereby accept the Terms. Non-commercial uses of the work are permitted
without any further permission from Dove Medical Press Limited, provided the work is properly
attributed. For permission for commercial use of this work, please see paragraphs 4.2 and 5 of our Terms.
© 2018 The Author(s). This work is published and licensed by Dove Medical Press Limited. The
full terms of this license are available at https://www.dovepress.com/terms
and incorporate the Creative Commons Attribution
- Non Commercial (unported, 3.0) License.
By accessing the work you hereby accept the Terms. Non-commercial uses of the work are permitted
without any further permission from Dove Medical Press Limited, provided the work is properly
attributed. For permission for commercial use of this work, please see paragraphs 4.2 and 5 of our Terms.