Back to Journals » International Journal of General Medicine » Volume 15
Construction and Evaluation of a Nomogram to Predict Gallstone Disease Based on Body Composition
Authors Lu J ![]() , Tong G
, Tong G ![]() , Hu X, Guo R, Wang S
, Hu X, Guo R, Wang S ![]()
Received 24 March 2022
Accepted for publication 22 June 2022
Published 2 July 2022 Volume 2022:15 Pages 5947—5956
DOI https://doi.org/10.2147/IJGM.S367642
Checked for plagiarism Yes
Review by Single anonymous peer review
Peer reviewer comments 4
Editor who approved publication: Dr Scott Fraser
Jian-hui Lu,1 Gen-xi Tong,2 Xiang-yun Hu,2 Rui-fang Guo,1 Shi Wang2
1Department of Clinical Nutrition Center, Inner Mongolia People’s Hospital, Hohhot, Inner Mongolia, People’s Republic of China; 2Department of Hepatobiliary, Pancreatic and Spleen Surgery, Inner Mongolia People’s Hospital, Hohhot, Inner Mongolia, People’s Republic of China
Correspondence: Rui-fang Guo, Department of Clinical Nutrition Center, Inner Mongolia People’s Hospital, Hohhot, Inner Mongolia, People’s Republic of China, Email [email protected] Shi Wang, Department of Hepatobiliary, Pancreatic and Spleen Surgery; Inner Mongolia People’s Hospital, Hohhot, Inner Mongolia, People’s Republic of China, Email [email protected]
Purpose: We aimed to analyze the body composition characteristics of gallstone disease (GD) patients with bioelectrical impedance analysis (BIA) and to construct a nomogram to predict GD based on body composition.
Methods: Patients with or without symptomatic cholecystolithiasis or choledocholithiasis diagnosed in Inner Mongolia People’s Hospital from July 2020 to December 2021 were selected as the case group, and healthy subjects during the same period were selected as the control group. The body composition of the two groups was determined by BIA. The risk predictors for GD were extracted to construct a nomogram based on regression analysis. ROC curves were used to evaluate the predictive power of the nomogram, and calibration curves were drawn to evaluate the consistency of the model. The bootstrap method was used to verify the model and evaluate the generalizability of the model.
Results: A total of 1000 individuals were recruited for the study, including 500 GD cases and 500 controls, to evaluate body composition. Multivariate logistic regression analysis showed that sex (OR = 2.292, 95% CI: 1.436– 3.660), BMI (OR = 1.828, 95% CI: 1.738– 1.929), body fat percentage (BFP) (OR = 1.904, 95% CI: 1.811– 2.205) and waist circumference (WC) (OR = 1.934, 95% CI: 1.899– 1.972) were risk predictors of GD. The AUC was 0.770 (95% CI: 0.741– 0.799). The calibration curve showed that the C-index was 0.767. The prediction model was validated internally with 1000 bootstrap resamples. The accurate value was 0.72, and the kappa value was 0.43. All of the indices indicated that the model was well constructed and could be used to predict the incidence of GD.
Conclusion: A nomogram model of gallstone disease based on sex, BMI, BFP and WC was constructed with good discrimination, calibration and generalizability and can be used for the noninvasive and convenient prediction of gallstone disease in the general population.
Keywords: gallstone disease, cholelithiasis, bioelectrical impedance analysis, BIA, body composition, nomogram, prediction model
Introduction
Gallstones or cholelithiasis are a major public health problem in Europe and other developed countries and affect up to 20% of the population.1 Gallstone disease is the most common gastrointestinal disorder for which patients are admitted to hospitals in European countries and the United States. They are considered a disease of developed populations but are present around the world.2,3 An epidemiological survey showed that the prevalence rate of gallstone disease in Chinese adults is 10%–15% and has been increasing gradually in recent years.4 Interdisciplinary care for patients with gallstone disease has advanced considerably during recent decades due to growing insight into the pathophysiological mechanisms and remarkable technical developments in endoscopic and surgical procedures. In contrast, primary prevention for this common disease is still in its infancy.2 Although previous studies have identified many modifiable risk factors for gallstone disease,5 there is a lack of prediction models for gallstone disease. A nomogram is a statistical model based on a logistic regression used for individualized risk prediction and analysis of clinical events, which quantifies the risk of clinical events through various risk factors and graphically presents relevant risk factors to easily obtain their risk probability values.6 At present, nomograms have been widely used in the risk assessment and prognostic analysis of tumors,7,8 liver fibrosis,9 acute pancreatitis10 and other diseases, but there has been no study on the prediction of gallstone disease. This project intended to measure the body composition of GD patients by BIA to expound on the characteristics of the body composition of GD patients and construct a nomogram to predict gallstone disease, which could help prevent this disease.
Methods
Patients
Patients with or without symptomatic cholecystolithiasis or choledocholithiasis diagnosed in Inner Mongolia People’s Hospital from July 2020 to December 2021 were selected as the case group. Diagnosis is based on a combination of clinical signs2 and abdominal ultrasound diagnosis.11 Clinical signs means the characteristic symptoms of gallbladder stones, ie, episodic attacks of severe pain in the right upper abdominal quadrant or epigastrium for at least 15–30 minutes with radiation to the right back or shoulder and a positive reaction to analgesics, irregular periodicity of the pain, onset at approximately 1 h after meals, onset during the evening or at night, awakening the patient from sleep, nausea and vomiting may be present, and identified by medical history and physical examination. Asymptomatic patients refer to those who have no subjective discomfort due to gallstones indicated by abdominal ultrasound during health examination. To ensure the study conclusions were more representative of the general population, the selected cases and controls were from the general Asian population rather than the Mongolian population. In addition, the case requirements were patients with cholelithiasis who were first detected by physical examination or presented with specific symptoms, and controls were healthy individuals who underwent physical examination at the same time. Cases were excluded if they met the following criteria: (1) complicated with tumor, diabetes, hyperthyroidism, hypothyroidism, liver cirrhosis, glucocorticoid use and other conditions affecting body composition or causing fat redistribution; and (2) physical disability, implantation of cardiac stents, pacemakers, steel nails, and steel plates. Figure 1 shows a flow chart of the subject selection process. Overall, 1000 subjects were included in the study.
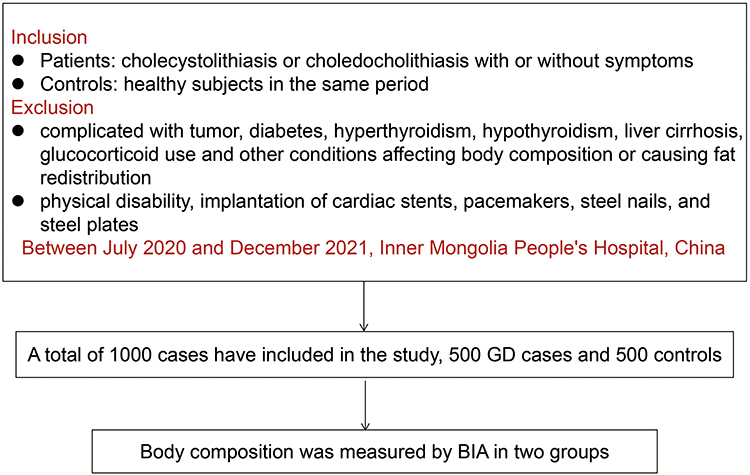 |
Figure 1 A flow chart of the subject selection process. According to the inclusion and exclusion criteria, 500 GD cases and 500 controls were finally included, and the body composition characteristics of the two groups were determined. A nomogram was constructed to predict GD based on body composition. |
Data Collection
Body weight was measured with the participants wearing thin clothing and to the nearest 0.1 kg. Body height was measured with the participants barefoot. Body composition was measured by BIA. BIA was performed on all participants with InBodyS10 (Biospace, Seoul, Korea) device.12 Before the measurement, the participants were asked to empty their bladders and did not eat for at least 4 h. Subjects stood for 30 min before the BIA measurement was taken, as the water in the body was distributed at a stable state. After that time, electrodes were placed on the thumbs and middle fingers of the right and left hands as well as on the ankles of the right and left lower limbs, and then the participants were measured. The study indicators included age, sex, height, weight, BMI, muscle, skeletal muscle, body fat, BFP, bone content, WC and visceral fat area (VFA).
Definitions
BMI was calculated as the weight in kilograms divided by height in meters squared (kg/m2). Overweight and obesity were defined as a BMI of 24–27.9 kg/m2 and BMI≥28 kg/m2, respectively.13 WC was defined as abdominal obesity, with a WC ≥90 cm for men and ≥80 cm for women.14 Excess BFP was defined as a BFP> 20% for men and BFP > 30% for women.15 Excess VFA was defined as a VFA≥100 cm2.16
Statistical Analysis
Statistical analyses were performed using SPSS software (version 21.0, IBM Corp, US). Categorical variables were reported as numbers and percentages [n (%)], and continuous variables were reported as medians with interquartile ranges [M (P25, P75)]. The Wilcoxon rank-sum test and univariate logistic regression analysis were performed to identify significant variables, and a multivariate logistic regression model was established to determine the risk factors for gallstone disease. Variables with a P value < 0.05 were selected and incorporated into the nomogram to predict the incidence of gallstone disease using statistical software R version 4.1.2. The nomogram measurement was carried out using the area under the ROC curve and calibration curves. The AUC and C-index represented the nomogram’s capacity to discriminate and the calibration degree, respectively. The accuracy of the model and potential model overfit were assessed by bootstrap validation with 1000 resamplings. An AUC and C-index ≥0.70 and kappa value ≥0.4 were considered to indicate a relatively good construction of the prediction model. All tests were two-sided, and P <0.05 was considered statistically significant.
Results
Demographics and Body Composition
This study included 500 patients with GD and 500 controls primarily to explore the differences in body composition characteristics between the two groups and to construct a nomogram prediction model for gallstone disease in individuals. The median age of GD patients was 55 (43, 64) years, 67% were female, and two-thirds of patients had clinical symptoms. The median age of healthy controls was 52 (40, 63) years and 58% were female. Age, sex and BMI had P values of < 0.05 in both groups, suggesting that they may be confounding factors in this study. The results of the Wilcoxon rank-sum test showed that all of body composition indexes were significant differences between the two groups (P < 0.05). The variables of weight, body fat, BFP, WC and VFA were higher in the GD group than in the control group, while the height, muscle, skeletal muscle mass and bone content were lower in the GD group than in the control group (Table 1).
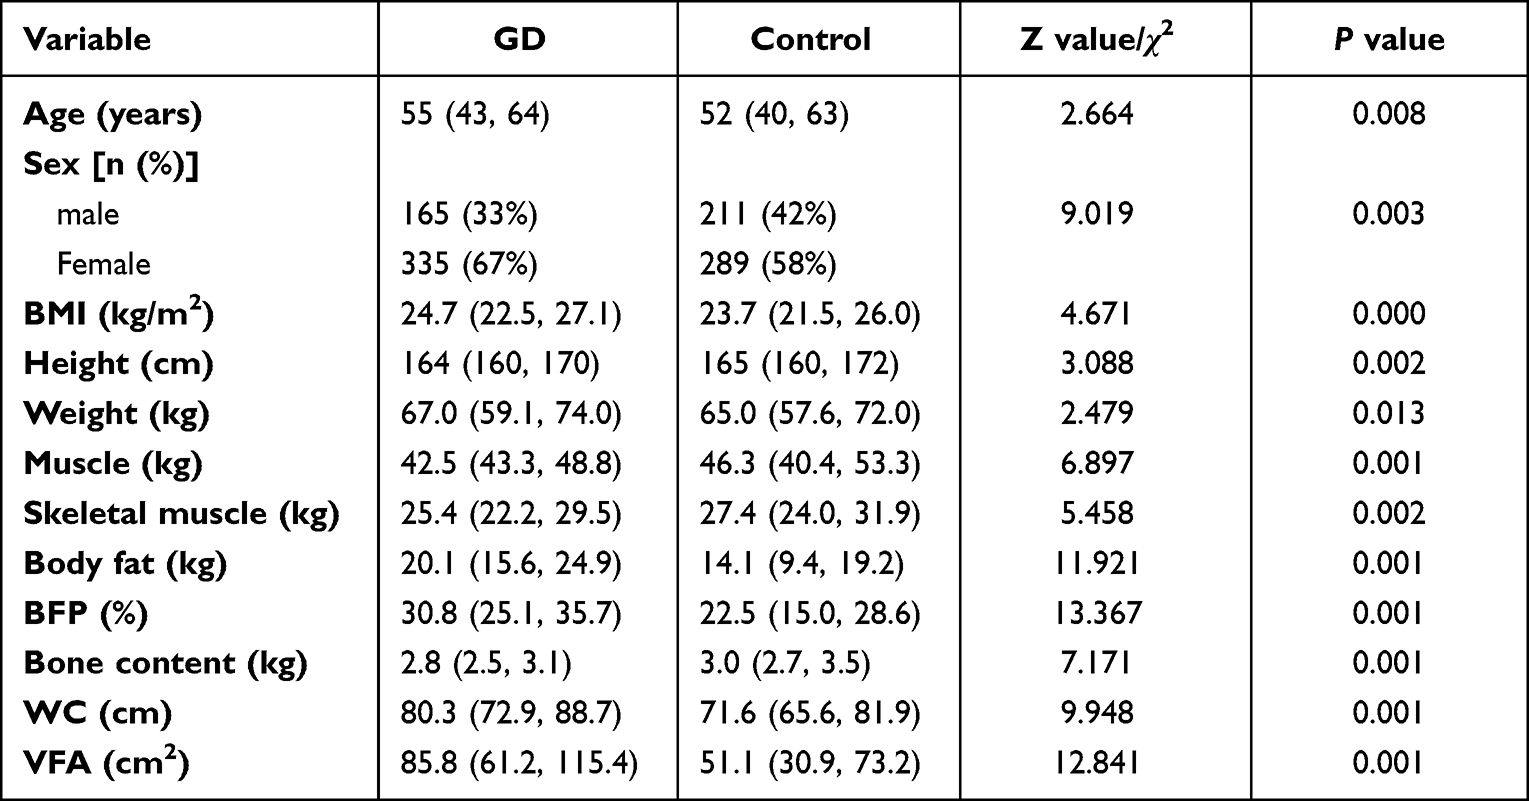 |
Table 1 Baseline Characteristics and Body Composition in Two Groups |
Body Composition After Adjustment for Confounding Factors
After adjusting for age, sex and BMI by univariate logistic regression, the results showed that muscle, skeletal muscle, body fat, BFP, bone content, WC and VFA were still significantly different between the two groups (P < 0.05) (Table 2).
 |
Table 2 Body Composition Adjusted for Age, Sex and BMI |
Subgroup Analysis of Body Composition
Group by sex, after adjusting for age and BMI, the results showed that all of body composition indicators were significantly different between male and female GD patients and the control group (P < 0.05). Obesity indices showed that both male and female GD patients were overweight (male BMI 24.6 kg/m2, female BMI 25.0 kg/m2) and had excess BFPs (male BFP 23.8%, female BFP 33.8%). Abdominal obesity (WC 80.1 cm) was found in female with GD, but no abdominal obesity (WC 80.9 cm) was found in male. Although the difference in VFA between the two groups was significant, it did not exceed the standard (Table 3).
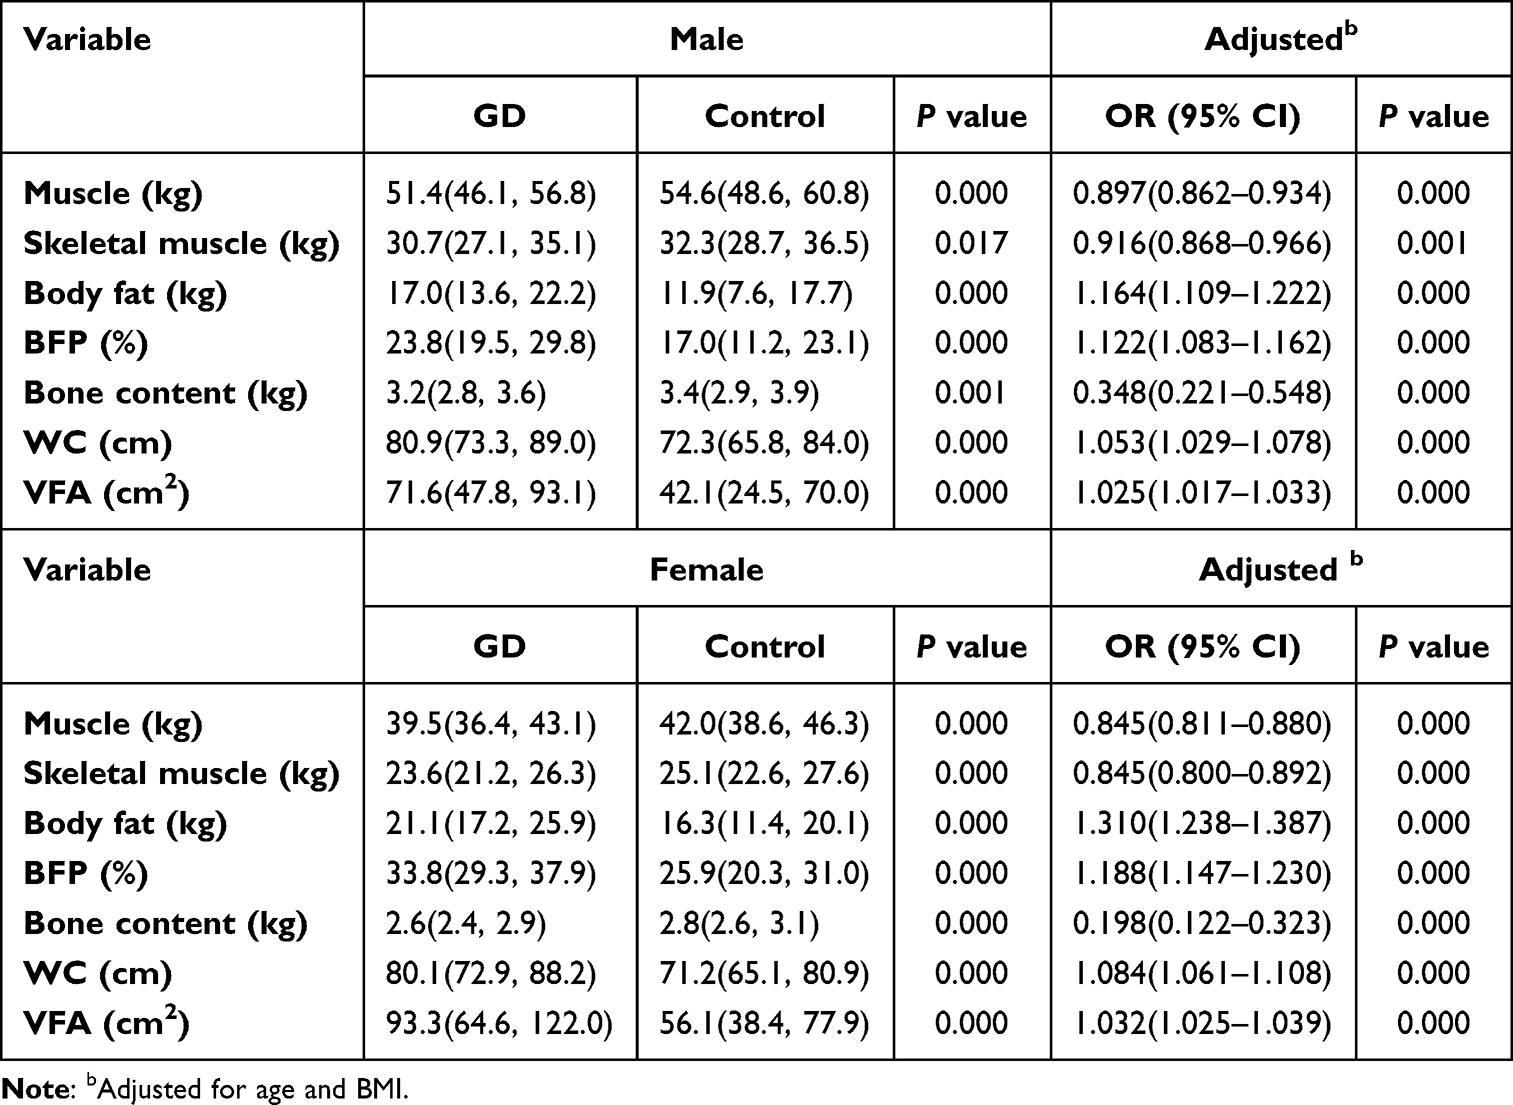 |
Table 3 Subgroup Analysis of Body Composition (Grouped by Sex) |
Predictor Screening
Gallstone disease and healthy controls were the dependent variables, and the above-mentioned variables with significantly different after adjusting for age, sex and BMI, and important demographic indicators sex and BMI were taken as independent variables. A multivariable logistic regression model was constructed to screen the risk predictors of gallstone disease, showing that sex, BMI, WC and BFP were risk predictors, and skeletal muscle and bone content were protective factors (Table 4).
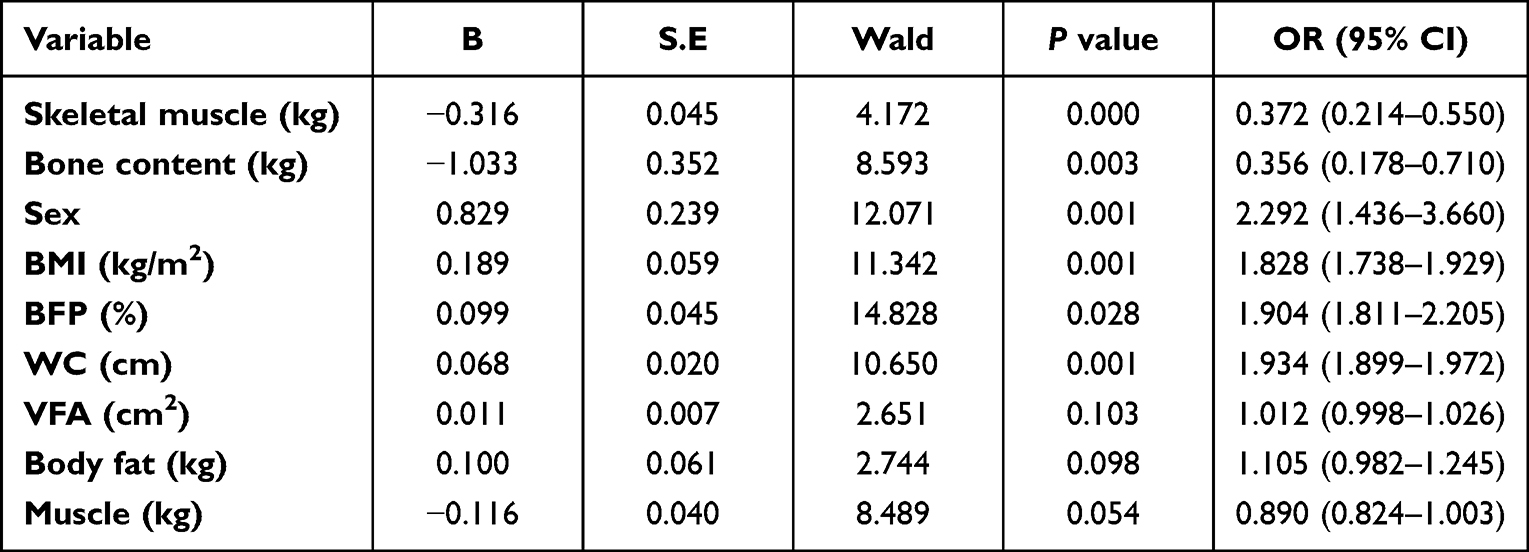 |
Table 4 Multivariate Logistic Regression Analysis of Risk Predictors for Gallstone Disease |
Construction and Application of the Nomogram Prediction Model
The nomogram to predict GD was created based on the following 4 independent risk factors: sex, BMI, WC and BFP (Figure 2). The values of the 4 risk predictors were projected upward to the integral line at the top of the nomogram to obtain the corresponding integral, and the integral of all independent risk predictors was then summed to obtain the total score. Then, the probability of GD could be predicted by the total score line at the bottom of the line. For example, for female with a BMI of 24 kg/m2, BFP of 32% and WC of 85 cm, the probability of GD was 79.9%.
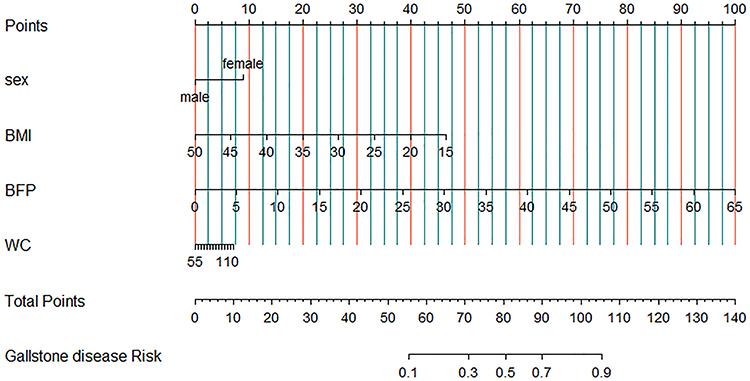 |
Figure 2 Nomogram predicting gallstone disease. Each variable in the figure, such as BMI, sex, BFP and WC in this study, correspond to the points at the top, and the sum of the scores of all variables is total points. Different total points correspond to the occurrence probability of gallstone disease at the bottom. Abbreviations: BFP, body fat percentage; WC, waist circumference. |
Evaluation of the Nomogram
ROC curves were used to evaluate the ability of the nomogram to predict the risk of GD, and the AUC was 0.770 (95% CI: 0.741–0.799) (Figure 3). A calibration plot of the nomogram demonstrated good agreement between the assessment and actual observations (Figure 4). The C-index of the nomogram was 0.767. The accuracy of the model and potential model overfit were assessed by bootstrap validation with 1000 resamplings. The accurate value was 0.72, and the kappa value was 0.43, indicating that the prediction model was well constructed and could be used to predict the risk of gallstone disease.
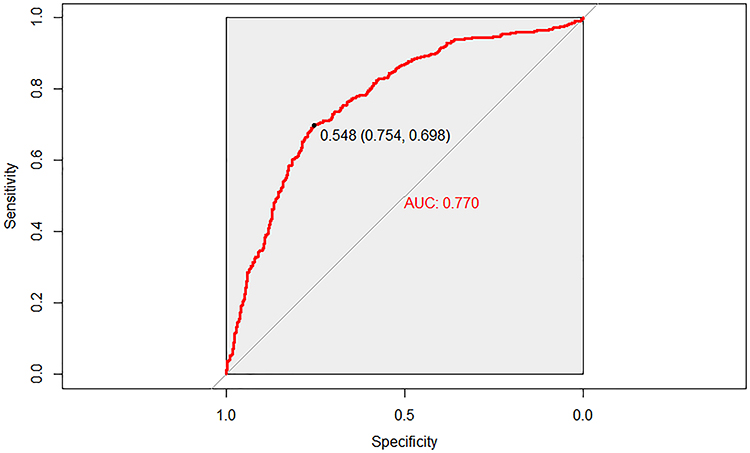 |
Figure 3 ROC curve of the prediction model for gallstone disease. The AUC was 0.770 (95% CI: 0.741–0.799), the 0.548 (0.754, 0.698) on the curve in the figure is the cut off value and the specificity and sensitivity corresponding to the cut off value. |
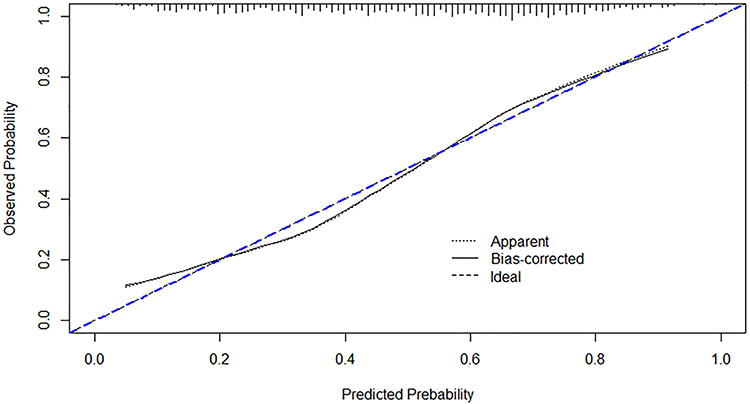 |
Figure 4 Calibration curve of the prediction model for the nomogram. In the calibration plots, the X-axis is the predicted probability, and the Y-axis is the observed (actual) probability. The 45°blue line represents a perfect prediction with an ideal model, and the black dotted line represents the performance of the nomogram. |
Discussion
Cholelithiasis (gallstone disease) affects approximately 10%~20% of adults globally and is among the hepatobiliary diseases associated with the highest socioeconomic costs.17,18 In addition, cholelithiasis is also an important risk factor for gallbladder cancer, and it is increasingly recognized as a public health concern that needs more attention.17,19 Although epidemiological studies have identified risk factors associated with cholelithiasis, primary prevention remains weak.3 We found that there are few individual-based risk prediction models for cholelithiasis. The Model 97 prediction model (Shanghai, China) was used to predict the population at high risk of cholelithiasis, and the results showed that it had good reproducibility and stability, but the accuracy of the female prediction model for the high-risk population was only 44%.20 Kadah et al generated a diagnostic equation [age (year) ×0.1 + CBD width (mm) by US ×1 + GGT (U/L) ×0.005] to predict CBD (common bile duct) stones, suggesting that this score is a very strong predictor for CBD stones. However, the limitations of this study were in choosing the maximal values of the laboratory tests obtained before endoscopic ultrasound without considering laboratory trends over time and not discriminating between the two groups because there are no firm data regarding the accurate width after cholecystectomy.21 Radmard et al22 showed that anthropometric indicators to predict gallstone disease risk vary with sex, and waist-hip ratio may be the only preferred indicator for men to assess gallstone disease risk, while the waist-to-height ratio, waist-to-hip ratio, visceral fat thickness and BMI were all associated with gallstone disease risk in women. In summary, these previous studies have some limitations or cannot effectively predict the risk of individual cholelithiasis.
A number of epidemiological studies have found an increased risk of gallbladder disease with greater BMI.23 Overweight and obesity are well-established risk factors for gallstone disease.24 Obesity increases the risk of gallstone disease in part because of an increased turnover of cholesterol associated with body fat, and cholesterol production is linear with body fat. Because increased cholesterol has a higher concentration relative to bile acids and phospholipids, it increases the possibility of excreting precipitated cholesterol gallstones in bile.25–27 Other studies have found that increased BMI and obesity are related to increased gallbladder volume after gallbladder contraction, decreased gallbladder contraction ability and decreased sensitivity to cholecystokinin, all of which are related to the formation of stones.28–30 However, the strength of the association has varied between studies, with some studies reporting twofold to threefold increases in risk among obese persons, while other studies using more refined and/or extreme categorizations of BMI have reported up to fivefold to sevenfold increases in risk among obese persons.22 In recent years, waist circumference, waist-hip ratio, visceral fat area/thickness and other indicators have often been used to further explain the relationship between obesity and fat distribution and cholelithiasis, and the results of different studies are both similar and different. Our study, for the first time, constructed a prediction model for gallstone disease based on sex and body composition, and the evaluation and internal verification of the model proved it to be satisfactory as a risk prediction model for cholelithiasis in individuals. This suggests that high-risk individuals should take measures to prevent GD. Another advantage of this study is that it integrated obesity-related indices reported in previous studies and included other body composition indices measured by BIA, which included more comprehensive anthropometric parameters and analyzed the body composition characteristics of GD patients.
In our study, we found that body fat, BFP, WC and VFA in patients with cholelithiasis were higher than those in the controls after adjusting for age, sex and BMI. A multivariate logistic regression model was established, and BMI, BFP and WC were found to be independent risk factors for GD. There are many reports about BMI and WC and cholelithiasis23,31,32 that show general obesity and abdominal obesity are positively correlated with the risk of gallbladder disease, and study have reported that in metabolically healthy individuals, both BMI and WC have a linear dose relationship with gallstones, when different metabolic health and obesity standards are adopted, the relationship between metabolically healthy obesity and gallstones remains unchanged.33 In addition, studies have reported that in patients with a BMI < 25, even those with normal weight, gallstone disease was still significantly associated with visceral and subcutaneous fat area, and CT measurement of adipose tissue, but not BMI, was a better predictor of risk for gallstone disease.34 In our study, the level of VFA in patients with cholelithiasis was higher than that in healthy controls, but it was no significant difference. Abdominal obesity was observed in women but not in men, consistent with the report by Tsai et al.32 The excess body fat percentage of both male and female GD patients were consistent with a previous report,34 and it had the greatest contribution to the prediction model of the nomogram, which may be closely related to the occurrence of GD. Research has reported that biliary tract diseases, including gallbladder cancer, extrahepatic bile duct cancer, ampullary cancer, cholelithiasis (presence of gallstones), cholecystitis and cholangitis, may be directly linked with body fatness, possibly through increases in inflammation, insulin resistance and insulin-like growth factor levels, oxidative stress, cholesterol levels, and adipokine levels.24 However, studies33 have suggested that body fat percentage is only related to the risk of cholelithiasis in women. This is expected to be verified by relevant studies in the future. In our study, we found that the muscle and skeletal muscle mass and bone content of gallstone disease patients were lower than those of healthy controls, and skeletal muscle, bone content are protective factors against gallstone disease.
Of course, the present study had several limitations. First, we selected patients from the outpatient service. Although asymptomatic patients were the first to consult, approximately two-thirds of the patients had symptoms, which may have resulted in selection bias. Second, although we integrated most obesity-related indicators reported in previous studies and included other body composition indicators to comprehensively analyze the body composition characteristics of patients with gallstone disease, we did not include waist-to-hip ratio data this time, because waist circumference is already the best indicator to represent types of obesity. In addition, the waist-hip ratio may have a large error due to artificial measurement. Finally, although our nomograms were internally validated using bootstrap validation, future studies are needed to externally validate the proposed nomograms.
Conclusion
In our study, for the first time, a simple and effective risk prediction model for gallstone disease based on body composition was constructed. Body composition indicators BMI, body fat percentage and waist circumference, as well as important demographic characteristics indicators sex were used as predictors to construct a nomogram prediction model for gallstone disease, and it has been verified that had good performances.
Ethics and Consent
This study was conducted in accordance with the Declaration of Helsinki and has been approved by the Ethics Committee of Inner Mongolia People’s Hospital, China (NO.202000101L). The body composition with bioelectrical impedance analysis in this study was non-invasive, convenient and does not involve human biological materials, the informed consent and cooperation of the patients have been obtained.
Funding
This study was funded by the Natural Science Fund Project of Inner Mongolia (No.: 2019 MS08081) and Science and Technology Planning Project of Inner Mongolia (No.: 201602097).
Disclosure
The authors have declared that no competing interest exists.
References
1. Farthing M, Roberts SE, Samuel DG, et al. Survey of digestive health across Europe: final report. Part 1: the burden of gastrointestinal diseases and the organisation and delivery of gastroenterology services across Europe. United European Gastroenterol J. 2014;2(6):539–543.
2. European Association for the Study of the Liver. EASL clinical practice guidelines on the prevention, diagnosis and treatment of gallstones. J Hepatol. 2016;65(1):146–181. doi:10.1016/j.jhep.2016.03.005
3. Jones MW, Weir CB, Ghassemzadeh S. Gallstones (Cholelithiasis). In: StatPearls. Treasure Island (FL): StatPearls Publishing Copyright © 2022, StatPearls Publishing LLC.; 2022.
4. Qi-ping LU. 20 years of clinical study on cholelithiasis: progress, problems and prospects. Chin J Pract Surg. 2020;40(01):42–47.
5. Lam R, Zakko A, Petrov JC, Kumar P, Duffy AJ, Muniraj T. Gallbladder disorders: a comprehensive review. Disease-A-Month. 2021;67(7):101130. doi:10.1016/j.disamonth.2021.101130
6. Iasonos A, Schrag D, Raj GV, Panageas KS. How to build and interpret a nomogram for cancer prognosis. J Clin Oncol. 2008;26(8):1364–1370. doi:10.1200/JCO.2007.12.9791
7. Wei FZ, Mei SW, Chen JN, et al. Nomograms and risk score models for predicting survival in rectal cancer patients with neoadjuvant therapy. World j Gastroenterol. 2020;26(42):6638–6657. doi:10.3748/wjg.v26.i42.6638
8. Kim Y, Margonis GA, Prescott JD, et al. Nomograms to predict recurrence-free and overall survival after curative resection of adrenocortical carcinoma. JAMA Surg. 2016;151(4):365–373. doi:10.1001/jamasurg.2015.4516
9. Hu P, Hu X, Lin Y, et al. A combination model of radiomics features and clinical biomarkers as a nomogram to differentiate nonadvanced from advanced liver fibrosis: a retrospective study. Acad Radiol. 2021;28(Suppl 1):S45–s54. doi:10.1016/j.acra.2020.08.029
10. Chen Q, Lin S, Huang Y, Pan J. Establishment of a rograph to predict the severity of the first episode of acute pancreatitis. Chin J Pancreatol. 2019;2019:420–424.
11. Ren W-D, editor. Ultrasound Diagnostics. CLc; 2013.
12. Lebiedowska A, Hartman-Petrycka M, Błońska-Fajfrowska B. How reliable is BMI? Bioimpedance analysis of body composition in underweight, normal weight, overweight, and obese women. Ir J Med Sci. 2021;190(3):993–998. doi:10.1007/s11845-020-02403-3
13. Zhang H, Xu H, Song F, Xu W, Pallard-Borg S, Qi X. Relation of socioeconomic status to overweight and obesity: a large population-based study of Chinese adults. Ann Hum Biol. 2017;44(6):495–501. doi:10.1080/03014460.2017.1328072
14. Tchang BG, Saunders KH, Igel LI. Best practices in the management of overweight and obesity. Med Clin North Am. 2021;105(1):149–174. doi:10.1016/j.mcna.2020.08.018
15. Hu L, Huang X, You C, et al. Prevalence of overweight, obesity, abdominal obesity and obesity-related risk factors in southern China. PLoS One. 2017;12(9):e0183934. doi:10.1371/journal.pone.0183934
16. Yuji M. New criteria for ‘obesity disease’ in Japan. Circ J. 2002;66(11):987–992. doi:10.1253/circj.66.987
17. Chen L, Yang H, Li H, He C, Yang L, Lv G. Insights into modifiable risk factors of cholelithiasis: a Mendelian randomization study. Hepatology. 2021;75(4):785–796.
18. Lammert F, Gurusamy K, Ko CW, et al. Gallstones. Nat Rev Dis Primers. 2016;2:16024. doi:10.1038/nrdp.2016.24
19. Stinton LM, Shaffer EA. Epidemiology of gallbladder disease: cholelithiasis and cancer. Gut Liver. 2012;6(2):172–187. doi:10.5009/gnl.2012.6.2.172
20. Jiang Z-Y, Han T-Q, Chen S, et al. Follow-up study on high risk population of gallbladder stone disease and evaluation of the accuracy of prediction model. Dig Surg. 2002;1(6):400–403.
21. Kadah A, Khoury T, Mahamid M, Assy N, Sbeit W. Predicting common bile duct stones by non-invasive parameters. Hepatobiliary Pancreat Dis Int. 2020;19(3):266–270. doi:10.1016/j.hbpd.2019.11.003
22. Radmard AR, Merat S, Kooraki S, et al. Gallstone disease and obesity: a population-based study on abdominal fat distribution and gender differences. Ann Hepatol. 2015;14(5):702–709. doi:10.1016/S1665-2681(19)30765-3
23. Aune D, Norat T, Vatten LJ. Body mass index, abdominal fatness and the risk of gallbladder disease. Eur J Epidemiol. 2015;30(9):1009–1019. doi:10.1007/s10654-015-0081-y
24. Hou L, Shu XO, Gao YT, et al. Anthropometric measurements, physical activity, and the risk of symptomatic gallstone disease in Chinese women. Ann Epidemiol. 2009;19(5):344–350. doi:10.1016/j.annepidem.2008.12.002
25. Portincasa P, Moschetta A, Palasciano G. From lipid secretion to cholesterol crystallization in bile. Relevance in cholesterol gallstone disease. Ann Hepatol. 2002;1(3):121–128. doi:10.1016/S1665-2681(19)32170-2
26. Bray GA. Medical consequences of obesity. J Clin Endocrinol Metab. 2004;89(6):2583–2589. doi:10.1210/jc.2004-0535
27. Wang Y-C, Zhang W-L, Wang X-H. Overview of risk factors related to cholelithiasis in China. Chin J Geriatric Multiorgan Dis. 2018;17(8):636–640.
28. Petroni ML. Review article: gall-bladder motor function in obesity. Aliment Pharmacol Ther. 2000;14(Suppl 2):48–50. doi:10.1046/j.1365-2036.2000.014s2048.x
29. Di Ciaula A, Wang DQ, Portincasa P. Gallbladder and gastric motility in obese newborns, pre-adolescents and adults. J Gastroenterol Hepatol. 2012;27(8):1298–1305. doi:10.1111/j.1440-1746.2012.07149.x
30. Man S, Gao Y, Lv J, et al. Metabolically healthy obesity was significantly associated with increased risk of gallstones. Eur j Endocrinol. 2022;186(2):275–283. doi:10.1530/EJE-21-0802
31. Tsai CJ, Leitzmann MF, Willett WC, Giovannucci EL. Prospective study of abdominal adiposity and gallstone disease in US men. Am J Clin Nutr. 2004;80(1):38–44. doi:10.1093/ajcn/80.1.38
32. Tsai CJ, Leitzmann MF, Willett WC, Giovannucci EL. Central adiposity, regional fat distribution, and the risk of cholecystectomy in women. Gut. 2006;55(5):708–714. doi:10.1136/gut.2005.076133
33. Hsu HY, Huang CY, Hwang LC. Sex difference of the predictive value of BMI, waist circumference and percentage body fat mass for gallstone disease. Br J Nutr. 2019;121(8):955–960. doi:10.1017/S000711451900028X
34. Park M, Song DY, Je Y, Lee JE. Body mass index and biliary tract disease: a systematic review and meta-analysis of prospective studies. Prev Med. 2014;65:13–22. doi:10.1016/j.ypmed.2014.03.027
 © 2022 The Author(s). This work is published and licensed by Dove Medical Press Limited. The
full terms of this license are available at https://www.dovepress.com/terms
and incorporate the Creative Commons Attribution
- Non Commercial (unported, 3.0) License.
By accessing the work you hereby accept the Terms. Non-commercial uses of the work are permitted
without any further permission from Dove Medical Press Limited, provided the work is properly
attributed. For permission for commercial use of this work, please see paragraphs 4.2 and 5 of our Terms.
© 2022 The Author(s). This work is published and licensed by Dove Medical Press Limited. The
full terms of this license are available at https://www.dovepress.com/terms
and incorporate the Creative Commons Attribution
- Non Commercial (unported, 3.0) License.
By accessing the work you hereby accept the Terms. Non-commercial uses of the work are permitted
without any further permission from Dove Medical Press Limited, provided the work is properly
attributed. For permission for commercial use of this work, please see paragraphs 4.2 and 5 of our Terms.