Back to Journals » Cancer Management and Research » Volume 12
Construction and Comprehensive Analysis of a ceRNA Network to Reveal Potential Novel Biomarkers for Triple-Negative Breast Cancer
Authors Ma L, Song G, Li M, Hao X, Huang Y, Lan J, Yang S, Zhang Z, Zhang G, Mu J ![]()
Received 7 May 2020
Accepted for publication 19 July 2020
Published 7 August 2020 Volume 2020:12 Pages 7061—7075
DOI https://doi.org/10.2147/CMAR.S260150
Checked for plagiarism Yes
Review by Single anonymous peer review
Peer reviewer comments 2
Editor who approved publication: Dr Ahmet Emre Eşkazan
Lifei Ma,1,2 Guiqin Song,1 Meiyu Li,3 Xiuqing Hao,4 Yong Huang,1 Jinping Lan,1 Siqian Yang,5 Zetian Zhang,6 Guohui Zhang,3 Jiao Mu3,7
1College of Laboratory Medicine, Hebei North University, Zhangjiakou, Hebei 075000, People’s Republic of China; 2State Key Laboratory of Medical Molecular Biology, Institute of Basic Medical Sciences, Chinese Academy of Medical Sciences, School of Basic Medicine, Peking Union Medical College, Beijing 100005, People’s Republic of China; 3Department of Forensic Medicine, Hebei North University, Zhangjiakou, Hebei 075000, People’s Republic of China; 4Department of Pathology, The First Affiliated Hospital of Hebei North University, Zhangjiakou, Hebei 075000, People’s Republic of China; 5College of Life Sciences and Medicine, Zhejiang Sci-Tech University, Hangzhou, Zhejiang 310018, People’s Republic of China; 6Department of Gastroenterology, The First Affiliated Hospital of Hebei North University, Zhangjiakou, Hebei 075000, People’s Republic of China; 7Department of Biomedical Engineering, School of Biological Science and Medical Engineering, Beihang University, Beijing 100191, People’s Republic of China
Correspondence: Jiao Mu; Guohui Zhang Department of Forensic Medicine, Zhangjiakou, Hebei 075000, People’s Republic of China
Tel +86-18931315882
; +86-18931316008 Email [email protected]; [email protected]
Background: Triple-negative breast cancer (TNBC) is the most common and aggressive type of breast cancer with an unfavourable outcome worldwide. Novel therapeutic targets are urgently required to explore this malignancy. This study explored the ceRNA network and the important genes for predicting the therapeutic targets.
Methods: It identified the differentially expressed genes of mRNAs, lncRNAs and miRNAs between TNBC and non-TNBC samples in four cohorts (TCGA, GSE38959, GSE45827 and GSE65194) to explore the novel therapeutic targets for TNBC. Downstream analyses, including functional enrichment analysis, ceRNA network, protein–protein interaction and survival analysis, were then conducted by bioinformatics analysis. Finally, the potential core protein of the ceRNA network in TNBC was validated by immunohistochemistry.
Results: A total of 1,045 lncRNAs and 28 miRNAs were differentially expressed in the TCGA TNBC samples, and the intersections of 282 mRNAs (176 upregulations and 106 downregulations) between the GEO and TCGA databases were identified. A ceRNA network composed of 7 lncRNAs, 62 mRNAs, 12 miRNAs and 244 edges specific to TNBC was established. The functional assay showed dysregulated genes, and GO, DO and KEGG enrichment analysis were performed. Survival analysis showed that mRNA LIFR and lncRNA AC124312.3 were significantly correlated with the overall survival of patients with TNBC in the TCGA databases (P < 0.05). Finally, the LIFR protein was validated, and immunohistochemical results showed the upregulated expression of LIFR in TNBC tissues.
Conclusion: Thus, our study presents an enhanced understanding of the ceRNA network in TNBC, where the key gene LIFR may be a new promising potential therapeutic target for patients with TNBC.
Keywords: triple-negative breast cancer, ceRNA network, overall survival, novel biomarkers, leukemia inhibitory factor receptor
Introduction
Breast cancer is one of the most common malignant tumours and a primary cause of cancer-related mortality in females worldwide.1 Triple-negative breast cancer (TNBC) is a subtype of breast cancer, in which the estrogen receptor (ER), progesterone receptor (PR) and human epidermal growth factor receptor 2 (HER-2) are not expressed. TNBC accounts for 12%–17% of all invasive breast cancers and has a higher diagnostic rate and more aggressive clinical behaviour in younger females.2 Compared with patients with other subtypes of breast cancer, patients with TNBC are more prone to deterioration and visceral metastasis.3 Given the absence of targeted molecules in precision medicine, patients with TNBC cannot be treated with endocrinal or HER-2-targeted curative therapy.4 Neoadjuvant chemotherapy as a principal option can be applied,5 but multi-drug resistance results in tumour recurrence and metastasis for patients with TNBC.6 Hence, a deeper understanding of the developmental mechanisms of TNBC should be obtained, and novel therapeutic targets should be explored to enhance the overall prognosis of TNBC.
In 2011, Sardina et al presented the competitive endogenous RNA (ceRNA) hypothesis with the theoretical basis that lncRNAs can directly interact by regulating the targeted gene expression and indirectly complete bindings with the seed sequences of miRNAs because of the shared common miRNA response elements (MREs).7 Cytoplasmic lncRNAs influence the reliability and translation mechanism of mRNAs, mainly through the ceRNA regulatory network of binding miRNAs.8 At present, the systematic analysis for the network of lncRNAs, miRNAs and mRNAs has already been confirmed to involve the pathogenesis and progression of cancers, including liver cancer, gallbladder cancer and other malignant tumours.9–14 However, few studies on TNBC have been conducted to date. Moreover, an integrated analysis on the regulatory functions of the lncRNA–miRNA–mRNA ceRNA network related to TNBC still needs to be addressed on the basis of a large-scale sample size and research approaches.
To diagnose patients with TNBC in this study, we explored new indicators of the regulatory mechanism of TNBC and identified implicated targets for this incurable cancer therapy. Amongst the bioinformatics approaches, we determined the differentially expressed genes (DEGs) between TNBC and non-TNBC to analyse the gene expression profiles from the downloadable The Cancer Genome Atlas (TCGA) and Gene Expression Omnibus (GEO) databases. The genome was analysed from multiple aspects because it is an extremely complex and interactive network.15 Then, Gene Ontology (GO) functional annotation, Disease Ontology (DO) and Kyoto Encyclopedia of Genes and Genomes (KEGG) pathway enrichment analysis were conducted for the filtered DEGs. Afterwards, the ceRNA network associated with TNBC, including 7 lncRNAs, 62 mRNAs and 12 miRNAs, was constructed. Kaplan–Meier survival analysis of key genes after screening from the ceRNA network demonstrated that lncRNA AC124312.3 and mRNA leukaemia inhibitory factor receptor (LIFR) were prognostic biomarkers for patients with TNBC. LIFR may be considered a tumour suppressor and metastasis inhibitor of TNBC, and its deregulation may be related to AC124312.3. Immunohistochemical results further verified that LIFR protein level was markedly upregulated in TNBC. The prime candidate RNAs that emerged in the ceRNA network could enhance the understanding on the critical factor during the oncogenesis and metastasis of TNBC on the cellular molecular level. The results of this study could provide accurate reference to therapeutic targets or valuable diagnostic indicators for the clinical diagnosis, treatment and prognostic evaluation of TNBC.
Materials and Methods
Data Retrieval and Patient Samples
RNA sequencing data and clinical information with human TNBC were manually retrieved from the TCGA and GEO database portals. The TCGA database (https://portal.gdc.cancer.gov/) and the GEO database (https://www.ncbi.nlm.nih.gov/geo/) are composed of PB-level genomic data, which are publicly available and free of charge. The vast amount of genome sequence information from these sites helps scientists to explore tumour pathogenesis. Breast cancer tissues from 20 pairs of patients were collected and reviewed as TNBC after post-operative histopathological examination by haematoxylin-eosin staining and immunohistochemistry from the First Affiliated Hospital of Hebei North University from December 2016 to December 2019. Our workflow for the comprehensive bioinformatics methods of the ceRNA network is to elucidate therapeutically applicable biomarkers in TNBC (Figure 1).
 |
Figure 1 Flowchart for comprehensive bioinformatics analysis of ceRNA network to reveal potential prognostic biomarkers for TNBC. |
RNA Sequence Data Processing
The gene expression profiles of the RNA sequence data (lncRNA and mRNA, level 3; Illumina HiSeq RNA-Seq platform) and miRNA sequence data (Illumina HiSeq miRNA-Seq platform) were downloaded from the TCGA “GDC TCGA-BRCA” cohort on University of California, Santa Cruz (UCSC) Xena (https://xena.ucsc.edu/), including 1,104 breast cancer samples and 113 normal samples (up to December 10, 2019).16 Thirteen pairs of TNBC and non-TNBC samples which lacked ER, PR and HER-2 expressions were selected on the basis of the corresponding clinical information, which was also downloaded from TCGA. Principal component analysis (PCA) was used to control the quality and reduce the dimension of all datasets.17 A specific sample with poor quality was removed from the subsequent study. We obtained 10 pairs of TNBC samples from the TCGA dataset. In addition, after a careful review, the size of the datasets was evaluated, and three gene expression profiles (GSE38959,18 GSE4582719 and GSE6519420–22) were screened and downloaded from the GEO. GSE38959 was obtained from the Agilent GPL4133 platform (Agilent-014850 Whole Human Genome Microarray 4x44K G4112F), while GSE45827 and GSE65194 were acquired according to platform GPL570 ([HG-U133_Plus_2] Affymetrix Human Genome U133 Plus 2.0 Array). GSE38959 consisted of 30 TNBC samples and 13 non-TNBC samples, GSE45827 consisted of 41 TNBC samples and 11 non-TNBC samples and GSE65194 consisted of 41 TNBC samples and 11 non-TNBC samples.
Identification of DEGs
The mRNAs and lncRNAs were annotated gene symbols through the Ensembl database (http://www.ensembl.org/index.html, version 99),23 and those excluded from the Ensembl database were not considered. Ten paired TNBC and non-TNBC samples were then compared to detect differentially expressed lncRNAs (DElncRNAs), mRNAs (DEmRNAs) and miRNAs (DEmiRNAs) by applying the limma R package with the cut-off criteria at an adjusted P-value < 0.05 and |log2-fold change (FC)| > 2.24 For the P value, false discovery rate (FDR) was used to adjust the statistically significant multiple tests.25 The DEmRNAs of GSE38959, GSE45827 and GSE65194 were also determined for each dataset using the same criteria above. For mRNAs, lncRNAs and miRNAs which have significantly changed genes (upregulated and downregulated genes), the ggplots2 package in RStudio was used to generate volcano plots. The same mRNAs amongst the four datasets were identified and shown in the Venn diagram using the VennDiagram R package.
Construction of the ceRNA Network
To ensure the reliability of the lncRNAs, miRNAs and mRNAs in the ceRNA network, a novel package called GDCRNATools in R was utilised.26 This package can predict the crosstalk amongst different RNA species through competitive binding with sharing common miRNAs and related regulation mechanisms in TNBC. The competing lncRNA–mRNA pairs were identified by the following criteria: hypergeometric probability (hypergeometric test p-value < 0.01), overall regulation similarity and positive expression correlation intensity of lncRNA and mRNA pairs by sharing miRNAs are measured by Pearson’s correlation (The threshold exceeding the 99th percentile of the distribution).27 To predict the shared target miRNAs of mRNA and lncRNA, the total read counts for 5p and 3p strands of DEmiRNAs were obtained from isoform quantification files, three miRNA–mRNA interactive databases, containing miRcode (http://www.mircode.org/),28 starBase v3.0 (http://starbase.sysu.edu.cn/)29 and miRTarBase (http://mirtarbase.mbc.nctu.edu.tw/),30 were selected, as well as three miRNA–lncRNA interaction databases, namely miRcode (http://www.mircode.org/),28 starBase v3.0 (http://starbase.sysu.edu.cn/)29 and a newly developed algorithm spongeScan (http://spongescan.rc.ufl.edu),31 were retrieved as effective evidence to integrate internally the interactions of miRNA–mRNA and miRNA–lncRNA in the gdcCEAnalysis function of the package to construct the ceRNA network in the TNBC.32 Finally, the gene interaction profile results based on ceRNA network in TNBC were visualised using the Cytoscape (http://www.cytoscape.org/) platform.33
GO, DO and KEGG Pathway Analyses of DEmRNAs and Protein–Protein Interaction
As previously described, the intersecting DEmRNAs of the GO enrichment analysis were explored by the ClusterProfiler R package,34 which contains a biological process, cellular component and molecular function and reveals the functional annotation with correlated mRNAs. The DO enrichment analysis was explored by DOSE R package,35 which detects gene–disease associations. The significant KEGG pathway enrichment of the DE mRNAs was also analysed via ClusterProfiler R package. The threshold was P < 0.05. Search Tool for the Retrieval of Interacting Genes/Proteins (STRING) version 11.036 was applied by importing the gene names of DEmRNAs in the four cohorts and ceRNA network. The connection amongst the results was explored using Cytoscape software.
Survival Analysis of ceRNA Network
To further explore the role of genes in the ceRNA network, the Overall Survival (OS) Kaplan–Meier Estimate was applied for survival analysis by using the survival R package. The key gene expression between the TNBC and non-TNBC samples was also validated by using the ggpubr R package. The datasets involved in this study were composed of TCGA breast cancer samples and filtered using the negative expressions of ER, PR and HER-2 according to their clinical information. In our study, the OS Kaplan–Meier and gene expression levels were applied to evaluate the prognostic values of candidate genes in the TNBC samples selected. Survival analysis was performed after each gene name was submitted in the survival R package. For each gene, the cancerous samples were divided into two subgroups according to the optimal cut-off value (50%) of the gene expression, and the Logrank Test P value of less than 0.05 was presented.37 The mRNA expression of each gene was explored on the basis of the t-test between the TNBC and non-TNBC samples, and the t-test P value of less than 0.05 was considered to be statistically significant.
Immunohistochemistry Validation
We purified 20 pairs of surgically resected breast tissues diagnosed with TNBC by haematoxylin-eosin staining and immunohistochemistry. These methods were used to verify changes in the LIFR protein expression in patients with TNBC.38 A series of paraffin-embedded TNBC tissues sections (5 μm) were sliced using a Leica microtome. The slices were then immersed in xylene for deparaffinization and in different alcohol concentrations for rehydration. Following antigen retrieval, the slices were incubated in 3% hydrogen peroxide at 37 °C for 15 min. Then the slices were blocked with a mixed solution composed of 10% goat serum and 0.25% Triton X-100 for 20 min and incubated with primary antibodies: LIFR (Cat# 22779-1-AP, Proteintech, Rosemont, IL, United States, 1:50 dilution) at 4 °C overnight. The tissue sections were rinsed thrice with PBS and then incubated with a secondary antibody (Bioss, Beijing, China) for 30 min at 37 °C and a S-A/HRP reagent (Bioss, Beijing, China) for 15 min at 37 °C. Finally, DAB was applied to visualise the positive reaction.
Results
PCA Verification of the Independence of Each Group
To distinguish the significant differences between normal and tumour samples in all datasets, PCA is a prominent method for reducing high-dimensional data and evaluating independence without reducing reliability. As shown in Figure 2, the TNBC and non-TNBC samples in these datasets (TCGA, GSE38959, GSE45827 and GSE65194) presented a significant difference after we removed one type of sample that was close to the other types of samples for subsequent analysis. The first two components were enough to divide the two subgroups, indicating that each cluster was independent.
 |
Figure 2 Principal component analysis for microarray studies was conducted in the TCGA and GEO databases. (A–D) Two-dimensional plots of non-TNBC (red dot) and TNBC (blue triangle) groups with the top two dimensions in TCGA, GSE38959, GSE45827 and GSE65194, respectively. Horizontal and vertical axes represent the distribution of each sample within Dim 1 and Dim 2 respectively.Abbreviations: Dim1, Dimension 1; Dim2, Dimension 2. |
DElncRNAs, DEmiRNAs and DEmRNAs in TNBC
The proportion of false positive results can be lessened after selecting the datasets through dimensionality reduction and quality control. Firstly, the DEmRNAs of TCGA, GSE38959, GSE45827 and GSE65194 were explored by using the limma R package subsequent processing for multiple corrections. With the threshold of |log2-fold change (FC)| > 2 and adj. P < 0.05, 2,277 DEmRNAs (including 1,042 upregulated genes and 1,235 downregulated genes) in the TCGA dataset, 1,717 DEmRNAs (including 1,111 upregulated genes and 606 downregulated genes) in the GSE38959 dataset, 3,461 DEmRNAs (including 2,464 upregulated genes and 997 downregulated genes) in the GSE45827 dataset and 3,499 DEmRNAs (including 2,475 upregulated genes and 1,024 downregulated genes) in the GSE65194 dataset were generated and visualised in the volcano map according to the TNBC samples compared with the non-TNBC samples, respectively (Figure 3A–D). A total of 176 upregulated genes and 106 downregulated genes of the intersection mRNAs in the four databases were identified using the Venn diagrams (Figure 3E). The 282 upregulated and downregulated mRNAs and their corresponding log FC and adjusted P values identified by limma are outlined in Table S1.
 |
Figure 3 Identification of Differentially Expressed Genes (DEGs). Volcano map of differently expressed lncRNAs, miRNAs and mRNAs between TNBC and non-TNBC samples. Red spots represent upregulated genes, and blue spots represent downregulated genes. (A) 2,277 DEmRNAs (1,042 upregulated and 1,235 downregulated) in TCGA TNBC cohorts; (B) 1,717 DEmRNAs (1,111 upregulated and 606 downregulated) in GSE38959 TNBC cohorts; (C) 3,461 DEmRNAs (2,464 upregulated and 997 downregulated) in GSE45827 TNBC cohorts; (D) 3,499 DEmRNAs (2,475 upregulated and 1,024 downregulated) in GSE65194 TNBC cohorts; (E) Venn diagrams represent the intersections of differentially expressed genes and 282 DEmRNAs were identified amongst four datasets above; (F) 1,045 DElncRNAs (437 upregulated and 608 downregulated) in TCGA TNBC cohorts; (G) 28 DEmiRNAs (15 upregulated and 13 downregulated) in TCGA TNBC cohorts. |
According to the standard above, 1,045 DElncRNAs (437 upregulations and 608 downregulations; Figure 3F; Table S2) and 28 DEmiRNAs between the TNBC and non-TNBC samples (15 upregulations and 13 downregulations; Figure 3G; Table S3) of TCGA that may be distinguished between normal and cancerous samples were explored and shown in the volcano map with the above standard filtration analysis by using the limma and ggplots2 package.
Construction of a ceRNA Regulatory Network in TNBC
To better understand the effect of lncRNAs on mRNAs mediated by binding with miRNAs in TNBC, we constructed a ceRNA regulatory network according to the above-mentioned results of TNBC by using the GDCRNATools R package and used Cytoscape to visualise the distribution information of the network. From the 28 retrieved DEmiRNAs, we applied the GDCRNATools and predicted that 12 of the DEmiRNAs could interact with 7 DElncRNAs on the basis of the miRcode, starBase and spongeScan databases. These 12 DEmiRNAs were then determined to target 62 DEmRNAs in the miRcode, starBase and miRTarBase databases. A total of 7 DElncRNAs, 12 DEmiRNAs, 62 DEmRNAs, 244 edges and 81 nodes were incorporated to establish a ceRNA network of TNBC. The interactions amongst the DElncRNAs, DEmiRNAs and DEmRNAs are illustrated by Cytoscape in Figure 4.
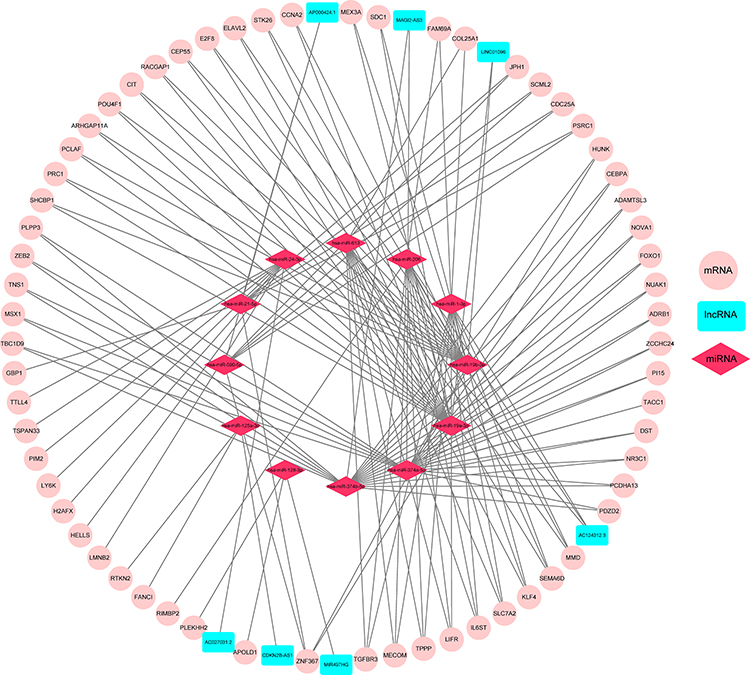 |
Figure 4 CeRNA regulatory network. LncRNA–miRNA–mRNA interactions in TNBC. The nodes highlighted in cyan indicate DElncRNAs, pink indicates DEmRNAs and red stands for DEmiRNAs, respectively. There are 7 DElncRNAs, 12 DEmiRNAs, 62 DEmRNAs and 244 edges in the network. |
GO and DO Term Enrichment Analysis and KEGG Pathway Analysis
To explore the potential biological function characteristics of dysregulated genes involved in the development of TNBC, the functional enrichment analysis and mapping of GO terms and KEGG pathways were performed using the latest databases through the ClusterProfiler R package. DO term analysis was performed using the DOSE package.
The GO analysis findings also suggested that these mRNAs included the biological processes (BPs) of chromosome segregation, sister chromatid segregation, regulation of membrane potential, nuclear division, chromatin assembly, mitotic nuclear division, adenylate cyclase-modulating G protein-coupled receptor signalling pathway and regulation of chromosome segregation (Figure 5A). For the cellular component (CC) of the GO analysis, the mRNAs were substantially enriched in the extracellular matrix, collagen-containing extracellular matrix, nucleosome, condensed chromosome, postsynaptic membrane and transmembrane transporter complex (Figure 5A). The molecular function (MF) of these mRNAs was involved in glycosaminoglycan binding, channel activity, passive transmembrane transporter activity, receptor regulator activity, receptor ligand activity, heparin binding, extracellular matrix structural constituent, amide binding and G protein-coupled peptide receptor activity (Figure 5A). Meanwhile, these mRNAs mainly enriched in several signalling pathways by the KEGG pathway analysis, involving neuroactive ligand-receptor interaction, systemic lupus erythematosus, regulation of lipolysis in adipocytes, retinol metabolism and cell cycle (Figure 5B). Finally, the DO analytical results demonstrated that mRNAs most significantly participated in breast carcinoma (Figure 5C).
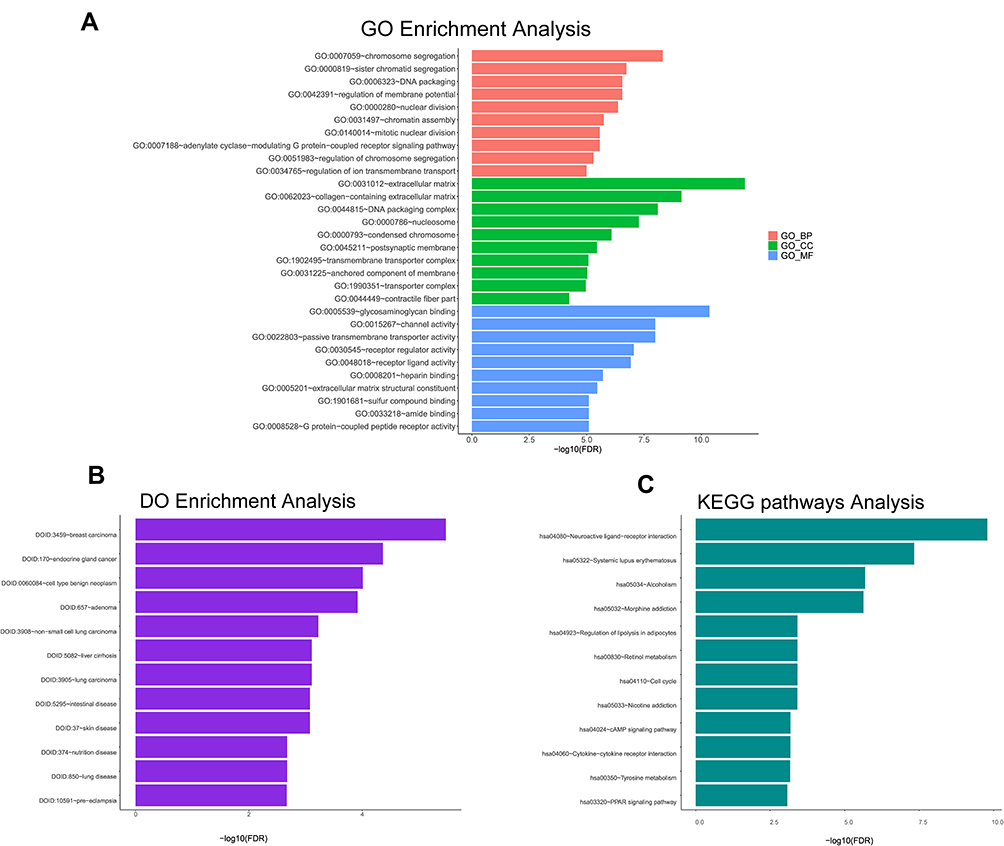 |
Figure 5 Enrichment analysis of GO terms, DO terms and KEGG pathways for differentially expressed mRNAs. The terms with P < 0.05 are considered as significantly enriched. (A) The red bars showing 10 GO terms of biological process; The green bars showing 10 GO terms of cellular component; The blue bars showing 10 GO terms of molecular function. (B) 12 DO terms analysis. (C) 12 KEGG pathways analysis. |
The Network of Core DEmRNAs
The STRING online database was used to study the interactions of mRNAs with different expressions between the TNBC and non-TNBC samples. Thirteen mRNAs of DEGs according to four cohorts were involved in the construction of the ceRNA regulatory network (Figure 6A). The PPI enrichment analysis indicated that the components of an intensely linked network with more than two kinds of proteins were identified by STRING and visualised by Cytoscape (Figure 6B). The results demonstrated 9 DEmRNAs, including 7 upregulated genes (CCNA2, H2AFX, LMNB2, CEP55, SHCBP1, E2F8 and RACGAP1) and 2 downregulated genes (IL6St and LIFR), can interact with one another, the process that is primarily related to leukaemia inhibitory factor signalling pathway and oncostatin-M-mediated signalling pathway.
 |
Figure 6 Venn diagram of mRNAs involved in the differentially expressed genes based on four cohorts and ceRNA regulation network, and the protein-protein interaction network of overlapping genes. (A) Venn diagram demonstrates the intersections of 13 genes between 282 DEmRNAs of four datasets and 62 mRNAs of ceRNA regulation network. (B) The network was constructed by the STRING database for overlapping 9 genes if their connections contain more than two proteins. Red indicates upregulated genes and blue indicates downregulated genes. The network was visualised by Cytoscape software. |
Survival Analysis of ceRNA Network-Associated Genes
To further determine the strong correlations with the prognostic characteristics of potential DEGs of patients with TNBC in the ceRNA network, we evaluated the Kaplan–Meier survival analysis and Log rank test for certain genes by comparing one-half of the 218 patients with higher expression to one-half of patients with lower expression according to the TCGA database and relevant clinical data using the survival R package. The mRNA expression of DEGs between normal and cancerous patients was validated using the same database above with the ggpubr R package. Of the 7 DElncRNAs, 12 DEmiRNAs and 9 selected DEmRNAs in 218 patients, we found the LIFR (mRNA) and AC124312.3 (lncRNA) pair, the expression of which was statistically associated with the overall survival rate (P < 0.05) as shown in Figure 7A and B. The LIFR mRNA and AC124312.3 expression levels were higher in patients diagnosed with non-TNBC than in those with TNBC (P < 0.05) as shown in Figure 7C and D.
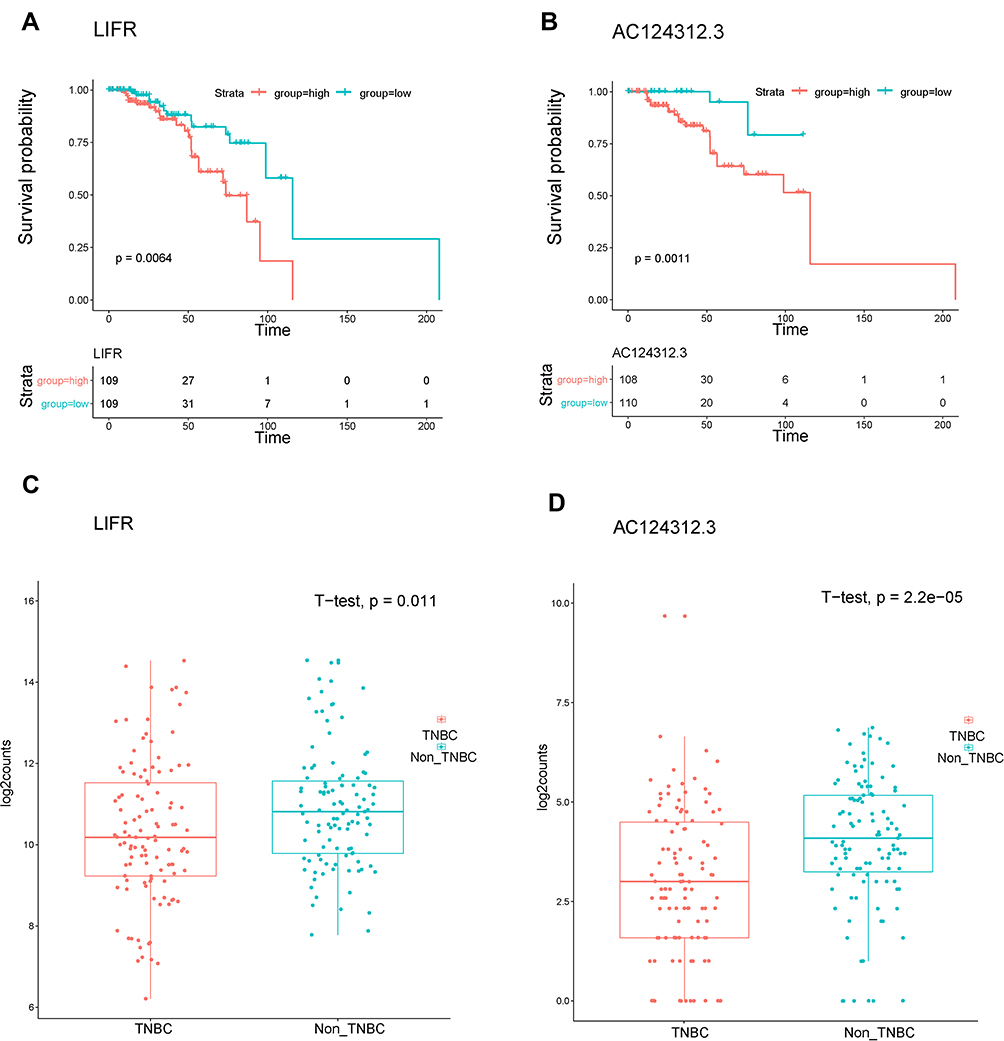 |
Figure 7 Kaplan-Meier survival analysis and gene expression levels of DEGs of the ceRNA network in patients with TNBC using the TCGA dataset. (A and B) Survival curves showing LIFR (mRNA) and AC124312.3 (lncRNA) were related to the overall patient survival rate, respectively. P-value set for this analysis is less than 0.05. (C and D) LIFR and AC124312.3 expression levels were higher in non-TNBC than in TNBC patients, respectively (P < 0.05). |
Validation of LIFR Protein Results in TNBC by Immunohistochemistry
LIFR, one of the top dysregulated mRNAs in the ceRNA network, is positively correlated with the overall survival of patients with TNBC. Thus, the LIFR protein expression was verified through immunohistochemical analysis. A total of 20 TNBC tissues and 20 adjacent tissues which served as control were analysed. As shown in Figure 8, LIFR resided in the plasmalemma and cytolymph, positive staining was brown, and the intensity of LIFR was lower in the TNBC tissues than in the control tissues.
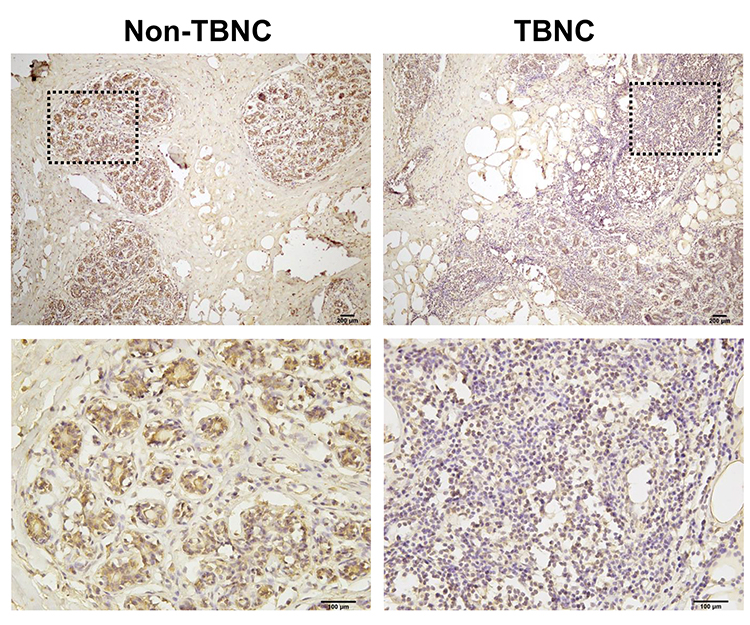 |
Figure 8 Immunohistochemistry analysis of LIFR protein in human TNBC tissues. Representative images of LIFR staining show that the expression of LIFR is lower in TNBC groups than in non-TNBC groups. Enlarged local images are also shown. |
Discussion
Metastatic breast cancer is a heterogeneous disease that is a predominant cause of cancer mortality in women worldwide. TNBC is the most common pathological type of breast cancer, with high metastasis, poor prognosis and devoid of ER, PR and HER-2 amplification.39 Traditional surgical treatment, herceptin and/or anti-estrogen therapies, even neoadjuvant chemotherapy, can significantly reduce the mortality of some patients with TNBC. However, numerous patients are unsatisfied with early diagnosis, current treatments and rehabilitation effects. Hence, identifying TNBC-related regulatory factors during the current research is crucial to access effective TNBC treatments in the near future.40 With the development of high‐throughput sequencing technology, research on lncRNA–mRNA has attracted the attention in transcription factor regulation and has enlightenment significance for disease gene prioritization, such as a specific coordinately regulatory network (CRN),41 especially in ceRNA networks.42 A growing body of evidence has shown that ceRNA‐related genes greatly influence the tumourigenesis, progression and prognosis in a great majority of cancers.43 Although research on the key lncRNAs of the ceRNA network for TNBC is limited, lncRNAs can regulate the expression of target mRNAs as shown in numerous studies, especially in cancer.44 For instance, in gastric cancer, lncRNA MT1JP can play the role of a molecular sponge to absorb miR-92a and affect FBXW7 gene expression.45 In ovarian cancer, lncRNA ABHD11-AS1 is associated with invasion-metastasis cascade through targeting Rhoc.46 In breast cancer, lncRNA-ATB acts a pivotal part in the trastuzumab resistance and tumourigenesis and progression.47 In prostate cancer, lncRNA HOXD-AS1 can regulate proliferation and chemoresistance through adsorbing WDR5.48 In gallbladder cancer, lncRNA H19 can regulate FOXM1 expression through competitive binding with miR-342-3p.14 Thus, lncRNAs as ceRNA play vital biological function in the regulation of gene expression, and core lncRNAs and mRNAs may be novel indicators in the diagnosis and targeted therapy of TNBC.
To improve the detection power of our study, in an initial step, we conducted a better approach by integrating multiple individual datasets to enhance the reliability of results. PCA is a powerful algorithm that is commonly applied to reduce high-dimensional multi-variable problems and evaluate the independence of each group.49 In the current study, the TNBC sample groups were independent of non-TNBC sample groups according to the PCA results in each of the four publicly available databases with TNBC (TCGA, GSE38959, GSE45827 and GSE65194) after removing two type samples close to each other. We identified 282 (176 upregulations and 106 downregulations) intersections of DEmRNAs between GEO data and TCGA data, 1,045 (437 upregulations and 608 downregulations) of DElncRNAs and 28 (15 upregulations and 13 downregulations) of DEmiRNAs on the basis of the TCGA data. Bioinformatics analysis was then conducted according to these DEGs.
To our knowledge, few in-depth studies on determining the importance of TNBC regulatory mechanisms have been conducted. Rare yet reliable lncRNAs, miRNAs and mRNAs associated with TNBC can be considered as molecular biomarkers to study TNBC and stratified risk evaluation. The tumourigenesis and progression of TNBC is a complex process involving multi-factors. However, to a large extent, DEGs are involved in the complex biological process of tumour occurrence, migration and invasion. Under this background and hypothesis, a ceRNA network was established to explore the regulatory mechanism amongst genes, including 7 DElncRNAs, 12 DEmiRNAs, 62 DEmRNAs, 244 edges and 81 nodes that are specific to TNBC.
Furthermore, GO, DO enrichment analysis and KEGG pathway analysis were applied to evaluate the biological multifunction enriched in the dysregulated coding genes. GO analysis can be treated as a controllable process to explore the functions of DEGs and present gene sets and gene products distributed in certain organisms. DO analysis can identify the most significantly enriched genes in cancer. Pathway analysis is used to locate DEGs based on KEGG, Fisher’s exact tests and the significant cut-off as defined by the P-value. We found that GO terms predominantly involved the activities of chromosome segregation, sister chromatid segregation, regulation of membrane potential, nuclear division and mitotic nuclear division in TNBC. Meantime, different expression genes were enriched in glycosaminoglycan binding, channel activity, passive transmembrane transporter activity, receptor regulator activity, receptor ligand activity, extracellular matrix structural constituent, amide binding and G protein-coupled peptide receptor activity. Previous studies have demonstrated that mitotic nuclear division is related to cell multiplication, and a malfunction of this procedure can result in mitotic checkpoint failure and chromosome missegregation.50 Microtubule function plays an important role in the accurate segregation of chromosomes during cell division, delivery of biological nanocargos and positioning and migration of cellular organs.51 Glycosaminoglycan-binding cytokines, such as vascular endothelial growth factor, midkine, heparanase and basic fibroblast growth factor, can be found on the cell surface and extracellular matrix. In addition to various biological functions, GAG-binding cytokines are being paid increasing attention in tumour development and progression.52,53 Analysis of KEGG pathway enrichment revealed considerable enrichment in neuroactive ligand-receptor interaction, systemic lupus erythematosus, regulation of lipolysis in adipocytes, retinol metabolism and cell cycle. This finding indicated some abnormal signalling pathways, some of which play critical roles in TNBC progression, which is rarely shown in previous reports. Lastly, breast carcinoma was significantly enriched by DO analysis. TNBC-related studies have shown that these important GO aspects involved sister chromatid segregation, channel activity, passive transmembrane transporter activity, receptor regulator activity, extracellular matrix structural constituent and other aspects, and the results are consistent with the findings of previous TNBC-related studies.4,54,55 Some new findings of our bioinformatics method require further study via experimental validation. Or analytical results showed that the influence of dysregulated mRNAs in the biological processes, cellular components, molecular functions and pathways may play pivotal roles in the pathogenesis of TNBC, all of which have been well documented. However, the mechanisms related to TNBC still need to be clarified.
Protein–protein interaction network has been suggested to investigate the functional connections of the intersection of DEGs on the basis of four cohorts and the ceRNA network. In TNBC, nine hub genes were identified, including 7 upregulated genes (CCNA2, H2AFX, LMNB2, CEP55, SHCBP1, E2F8 and RACGAP1) and 2 downregulated genes (IL6ST and LIFR). Module analysis of the PPI network illustrated that the leukaemia inhibitory factor signalling pathway and oncostatin-M-mediated signalling pathway might be involved in TNBC development. The mRNA LIFR and lncRNA AC124312.3 pair described a significant correlation with the overall survival rate according to the TCGA database.
Amongst the key genes above, few reports have demonstrated that lncRNA AC124312.3 not only regulated mRNAs LIFR and was highly associated with TNBC according to the ceRNA network analysis but also interacted with many miRNAs which have been known to be involved in TNBC. These results indicated that lncRNA AC124312.3 is an important lncRNA in the progression of TNBC. However, the role of this lncRNA in the development of TNBC remains unclear. Based on the lncRNA AC124312.3-miRNA-mRNA subnetwork, we speculated that lncRNA AC124312.3 might alter the expression of the downstream TNBC associated with mRNA (LIFR) by competitively interacting with miRNA families, including the miR-1-3p, miR-206 and miR-613 families. LIFR is a key modulator in the controlling cytokine–cytokine receptor interaction, cell proliferation and signalling pathways regulating the pluripotency of stem cells and Jak-STAT.56,57 Previous studies have reported that LIFR was regarded as a tumour suppressor and related to pancreatic carcinoma cell metastasis in vitro and in vivo.58 LIFR, as a breast tumour suppressor, has been related to signal transduction upstream of the Hippo-YAP pathway in human breast cancer migration, and its deregulation may be associated with the metastasis of a considerable proportion of breast cancer.56,59 A mechanistic study has shown that lncRNA-CTD-2108O9.1 can effectively suppress tumour activities in breast cancer transformation via the metastasis inhibitory factor LIFR.57 In our study, the expression levels of LIFR and AC124312.3 were lower in patients with TNBC than those with non-TNBC, and both molecules had been related to TNBC based on GO and OS analysis. Therefore, the results indicated that LIFR is probably targeted by lncRNA AC124312.3 to repress the metastasis of TNBC indirectly by competitive binding with the miR-1-3p, miR-206 and miR-613 families. The overexpression of AC124312.3 and LIFR may be linked with the improved prognosis in patients with TNBC. A TNBC-related ceRNA regulatory network can identify potential candidate biomarkers for predicting the tumourigenesis and target therapy of patients with TNBC.
Immunohistochemistry was used to compare the expression levels of genes in the TNBC tissues and further study their potentially important benefit in cancer development. Owing to some limitations of the TNBC samples, this result only confirmed the LIFR protein and LIFR staining, which indicated that the expression of LIFR was lower in the TNBC groups than in the non-TNBC groups. Thus, these results indicated that LIFR might act as a tumour suppressor gene in TNBC. Further studies are required to perform an external validation of lncRNA AC124312.3 and address the underlying mechanism of LIFR and AC124312.3 in TNBC with more exploratory experiments.
Conclusion
In conclusion, our study has identified DEmRNAs, DElncRNAs and DEmiRNAs in TNBC supported by GEO and TCGA databases. A ceRNA network has been constructed to analyse a novel regulatory mechanism for the progression of TNBC at a system-wide level. The results from a series of analyses indicated that LIFR may play an important role in the occurrence and metastasis of TNBC. Our study revealed the potential implications of LIFR for prognostic prediction and therapeutic exploration in TNBC.
Data Sharing Statement
The data analyzed in this study can be downloaded from the TCGA and GEO.
Ethical Approval and Patient Consent
The research protocols were approved by the Ethics Committee of Hebei North University. Informed consents were obtained from all claimed cases.
Disclosure
The authors report no conflicts of interest in this work.
References
1. Bray F, Ferlay J, Soerjomataram I, Siegel RL, Torre LA, Jemal A. Global cancer statistics 2018: GLOBOCAN estimates of incidence and mortality worldwide for 36 cancers in 185 countries. CA Cancer J Clin. 2018;68(6):394–424. doi:10.3322/caac.21492
2. Venkitaraman R. Triple-negative/basal-like breast cancer: clinical, pathologic and molecular features. Expert Rev Anticancer Ther. 2010;10(2):199–207. doi:10.1586/ERA.09.189
3. Bosch A, Eroles P, Zaragoza R, Viña JR, Lluch A. Triple-negative breast cancer: molecular features, pathogenesis, treatment and current lines of research. Cancer Treat Rev. 2010;36(3):206–215. doi:10.1016/j.ctrv.2009.12.002
4. Li MX, Jin LT, Wang TJ, et al. Identification of potential core genes in triple negative breast cancer using bioinformatics analysis. Onco Targets Ther. 2018;11:4105–4112. doi:10.2147/OTT.S166567
5. Foulkes WD, Smith IE, Reis-Filho JS. Triple-negative breast cancer. N Engl J Med. 2010;363(20):1938–1948. doi:10.1056/NEJMra1001389
6. Wein L, Loi S. Mechanisms of resistance of chemotherapy in early-stage triple negative breast cancer (TNBC). Breast. 2017;34:S27–S30. doi:10.1016/j.breast.2017.06.023
7. Sardina DS, Alaimo S, Ferro A, Pulvirenti A, Giugno R. A novel computational method for inferring competing endogenous interactions. Brief Bioinform. 2017;18(6):1071–1081. doi:10.1093/bib/bbw084
8. Cao Z, Pan X, Yang Y, Huang Y, Shen H-B, Hancock J. The lncLocator: a subcellular localization predictor for long non-coding RNAs based on a stacked ensemble classifier. Bioinformatics. 2018;34(13):2185–2194. doi:10.1093/bioinformatics/bty085
9. Tay Y, Rinn J, Pandolfi PP. The multilayered complexity of ceRNA crosstalk and competition. Nature. 2014;505(7483):344–352. doi:10.1038/nature12986
10. Thomson DW, Dinger ME. Endogenous microRNA sponges: evidence and controversy. Nat Rev Genet. 2016;17(5):272–283. doi:10.1038/nrg.2016.20
11. Wang J, Liu X, Wu H, et al. CREB up-regulates long non-coding RNA, HULC expression through interaction with microRNA-372 in liver cancer. Nucleic Acids Res. 2010;38(16):5366–5383. doi:10.1093/nar/gkq285
12. Long J, Bai Y, Yang X, et al. Construction and comprehensive analysis of a ceRNA network to reveal potential prognostic biomarkers for hepatocellular carcinoma. Cancer Cell Int. 2019;19(1):1–2. doi:10.1186/s12935-019-0817-y
13. Bai Y, Long J, Liu Z, et al. Comprehensive analysis of a ceRNA network reveals potential prognostic cytoplasmic lncRNAs involved in HCC progression. J Cell Physiol. 2019;234(10):18837–18848. doi:10.1002/jcp.28522
14. Wang SH, Ma F, Tang ZH, et al. Long non-coding RNA H19 regulates FOXM1 expression by competitively binding endogenous miR-342-3p in gallbladder cancer. J Exp Clin Cancer Res. 2016;35(1):1–12. doi:10.1186/s13046-016-0436-6
15. Jeong H, Mason SP, Barabási AL, Oltvai ZN. Lethality and centrality in protein networks. Nature. 2001;411(6833):41–42. doi:10.1038/35075138
16. Goldman M, Craft B, Hastie M, et al. The UCSC Xena platform for public and private cancer genomics data visualization and interpretation. bioRxiv. 2018:326470. doi:10.1101/326470
17. Lever J, Krzywinski M, Altman N. Points of significance: principal component analysis. Nat Methods. 2017;14(7):641–642. doi:10.1038/nmeth.4346
18. Komatsu M, Yoshimaru T, Matsuo T, et al. Molecular features of triple negative breast cancer cells by genome-wide gene expression profiling analysis. Int J Oncol. 2013;42(2):478–506. doi:10.3892/ijo.2012.1744
19. Gruosso T, Mieulet V, Cardon M, et al. Chronic oxidative stress promotes H2 AX protein degradation and enhances chemosensitivity in breast cancer patients. EMBO Mol Med. 2016;8(5):527–549. doi:10.15252/emmm.201505891
20. Maubant S, Tesson B, Maire V, et al. Transcriptome analysis of wnt3a-treated triple-negative breast cancer cells. PLoS One. 2015;10(4):e0122333. doi:10.1371/journal.pone.0122333
21. Maire V, Baldeyron C, Richardson M, et al. TTK/hMPS1 is an attractive therapeutic target for triple-negative breast cancer. PLoS One. 2013;8(5):e63712. doi:10.1371/journal.pone.0063712
22. Maire V, Némati F, Richardson M, et al. Polo-like kinase 1: a potential therapeutic option in combination with conventional chemotherapy for the management of patients with triple-negative breast cancer. Cancer Res. 2013;73(2):813–823. doi:10.1158/0008-5472.CAN-12-2633
23. Aken BL, Ayling S, Barrell D, et al. The Ensembl gene annotation system. Database. 2016;2016:baw093. doi:10.1093/database/baw093
24. Ritchie ME, Phipson B, Wu D, et al. Limma powers differential expression analyses for RNA-sequencing and microarray studies. Nucleic Acids Res. 2015;43(7):e47. doi:10.1093/nar/gkv007
25. Benjamini Y, Hochberg Y. Controlling the false discovery rate: a practical and powerful approach to multiple testing. J R Stat Soc Ser B. 1995;57(1):289–300. doi:10.1111/j.2517-6161.1995.tb02031.x
26. Li R, Qu H, Wang S, et al. GDCRNATools: an R/Bioconductor package for integrative analysis of lncRNA, miRNA and mRNA data in GDC. Bioinformatics. 2018;34(14):2515–2517. doi:10.1093/bioinformatics/bty124
27. Paci P, Colombo T, Farina L. Computational analysis identifies a sponge interaction network between long non-coding RNAs and messenger RNAs in human breast cancer. BMC Syst Biol. 2014;8(1):83. doi:10.1186/1752-0509-8-83
28. Jeggari A, Marks DS, Larsson E. miRcode: a map of putative microRNA target sites in the long non-coding transcriptome. Bioinformatics. 2012;28(15):2062–2063. doi:10.1093/bioinformatics/bts344
29. Li JH, Liu S, Zhou H, Qu LH, Yang JH. StarBase v2.0: decoding miRNA-ceRNA, miRNA-ncRNA and protein-RNA interaction networks from large-scale CLIP-Seq data. Nucleic Acids Res. 2014;42(D1):D92–D97. doi:10.1093/nar/gkt1248
30. Chou CH, Shrestha S, Yang CD, et al. MiRTarBase update 2018: a resource for experimentally validated microRNA-target interactions. Nucleic Acids Res. 2018;46(D1):D296–D302. doi:10.1093/nar/gkx1067
31. Furió-Tarí P, Tarazona S, Gabaldón T, Enright AJ, Conesa A. spongeScan: a web for detecting microRNA binding elements in lncRNA sequences. Nucleic Acids Res. 2016;44(W1):W176–W180. doi:10.1093/nar/gkw443
32. Li Y, Gu J, Xu F, Zhu Q, Ge D, Lu C. Transcriptomic and functional network features of lung squamous cell carcinoma through integrative analysis of GEO and TCGA data. Sci Rep. 2018;8(1):15834. doi:10.1038/s41598-018-34160-w
33. Shannon P, Markiel A, Ozier O, et al. Cytoscape: a software Environment for integrated models of biomolecular interaction networks. Genome Res. 2003;13(11):2498–2504. doi:10.1101/gr.1239303
34. Yu G, Wang LG, Han Y, He QY. ClusterProfiler: an R package for comparing biological themes among gene clusters. Omi a J Integr Biol. 2012;16(5):284–287. doi:10.1089/omi.2011.0118
35. Yu G, Wang LG, Yan GR, He Q-Y. DOSE: an R/Bioconductor package for disease ontology semantic and enrichment analysis. Bioinformatics. 2015;31(4):608–609. doi:10.1093/bioinformatics/btu684
36. Szklarczyk D, Gable AL, Lyon D, et al. STRING v11: protein-protein association networks with increased coverage, supporting functional discovery in genome-wide experimental datasets. Nucleic Acids Res. 2019;47(D1):D607–D613. doi:10.1093/nar/gky1131
37. Royston P, Choodari-Oskooei B, Parmar MKB, Rogers JK. Combined test versus logrank/Cox test in 50 randomised trials. Trials. 2019;20(1). doi:10.1186/s13063-019-3251-5
38. Mu J, Li M, Wang T, et al. Myelin damage in diffuse axonal injury. Front Neurosci. 2019;13:217. doi:10.3389/fnins.2019.00217
39. Fatima I, El-Ayachi I, Taotao L, et al. The natural compound Jatrophone interferes with Wnt/β-catenin signaling and inhibits proliferation and EMT in human triple-negative breast cancer. PLoS One. 2017;12(12):e0189864. doi:10.1371/journal.pone.0189864
40. Zamberi NR, Abu N, Mohamed NE, et al. The antimetastatic and antiangiogenesis effects of kefir water on murine breast cancer cells. Integr Cancer Ther. 2016;15(4):NP53–NP66. doi:10.1177/1534735416642862
41. Wang S, Wang W, Wang W, et al. Context-specific coordinately regulatory network prioritize breast cancer genetic risk factors. Front Genet. 2020;11:255. doi:10.3389/fgene.2020.00255
42. Guttman M, Rinn JL. Modular regulatory principles of large non-coding RNAs. Nature. 2012;482(7385):339–346. doi:10.1038/nature10887
43. Schmitt AM, Chang HY. Long noncoding RNAs in cancer pathways. Cancer Cell. 2016;29(4):452–463. doi:10.1016/j.ccell.2016.03.010
44. Beermann J, Piccoli MT, Viereck J, Thum T. Non-coding RNAs in development and disease: background, mechanisms, and therapeutic approaches. Physiol Rev. 2016;96(4):1297–1325. doi:10.1152/physrev.00041.2015
45. Zhang G, Li S, Lu J, et al. LncRNA MT1JP functions as a ceRNA in regulating FBXW7 through competitively binding to miR-92a-3p in gastric cancer. Mol Cancer. 2018;17(1):1–11. doi:10.1186/s12943-018-0829-6
46. Wu DD, Chen X, Sun KX, Wang LL, Chen S, Zhao Y. Role of the lncRNA ABHD11-AS1 in the tumorigenesis and progression of epithelial ovarian cancer through targeted regulation of RhoC. Mol Cancer. 2017;16(1):138. doi:10.1186/s12943-017-0709-5
47. Shi SJ, Wang LJ, Yu B, Li YH, Jin Y, Bai XZ. LncRNA-ATB promotes trastuzumab resistance and invasion-metastasis cascade in breast cancer. Oncotarget. 2015;6(13):11652–11663. doi:10.18632/oncotarget.3457
48. Gu P, Chen X, Xie R, et al. lncRNA HOXD-AS1 regulates proliferation and chemo-resistance of castration-resistant prostate cancer via recruiting WDR5. Mol Ther. 2017;25(8):1959–1973. doi:10.1016/j.ymthe.2017.04.016
49. Liu RS, Jin GH, Xiao DR, Li HM, Bai FW, Tang YJ. Screening of the key volatile organic compounds of Tuber melanosporum fermentation by aroma sensory evaluation combination with principle component analysis. Sci Rep. 2015;5. doi:10.1038/srep17954
50. Ko MA, Rosario CO, Hudson JW, et al. Plk4 haploinsufficiency causes mitotic infidelity and carcinogenesis. Nat Genet. 2005;37(8):883–888. doi:10.1038/ng1605
51. Broggini-Tenzer A, Sharma A, Nytko KJ, et al. Combined treatment strategies for microtubule stabilizing agent-resistant tumors. J Natl Cancer Inst. 2015;107(4). doi:10.1093/jnci/dju504
52. Muramatsu T, Muramatsu H. Glycosaminoglycan-binding cytokines as tumor markers. Proteomics. 2008;8(16):3350–3359. doi:10.1002/pmic.200800042
53. Christianson HC, Menard JA, Chandran VI, et al. Tumor antigen glycosaminoglycan modification regulates antibody-drug conjugate delivery and cytotoxicity. Oncotarget. 2017;8(40):66960–66974. doi:10.18632/oncotarget.16921
54. Dong P, Yu B, Pan L, Tian X, Liu F. Identification of key genes and pathways in triple-negative breast cancer by integrated bioinformatics analysis. Biomed Res Int. 2018;2018:1–10. doi:10.1155/2018/2760918
55. Yang F, Liu YH, Dong SY, et al. Co-expression networks revealed potential core lncRNAs in the triple-negative breast cancer. Gene. 2016;591(2):471–477. doi:10.1016/j.gene.2016.07.002
56. Iorns E, Ward TM, Dean S, et al. Whole genome in vivo RNAi screening identifies the leukemia inhibitory factor receptor as a novel breast tumor suppressor. Breast Cancer Res Treat. 2012;135(1):79–91. doi:10.1007/s10549-012-2068-7
57. Wang M, Wang M, Wang Z, et al. Long non-coding RNA-CTD-2108O9.1 represses breast cancer metastasis by influencing leukemia inhibitory factor receptor. Cancer Sci. 2018;109(6):1764–1774. doi:10.1111/cas.13592
58. Ma D, Jing X, Shen B, et al. Leukemia inhibitory factor receptor negatively regulates the metastasis of pancreatic cancer cells in vitro and in vivo. Oncol Rep. 2016;36(2):827–836. doi:10.3892/or.2016.4865
59. Hergovich A. YAP-Hippo signalling downstream of leukemia inhibitory factor receptor: implications for breast cancer. Breast Cancer Res. 2012;14(6):326. doi:10.1186/bcr3349
 © 2020 The Author(s). This work is published and licensed by Dove Medical Press Limited. The
full terms of this license are available at https://www.dovepress.com/terms
and incorporate the Creative Commons Attribution
- Non Commercial (unported, 3.0) License.
By accessing the work you hereby accept the Terms. Non-commercial uses of the work are permitted
without any further permission from Dove Medical Press Limited, provided the work is properly
attributed. For permission for commercial use of this work, please see paragraphs 4.2 and 5 of our Terms.
© 2020 The Author(s). This work is published and licensed by Dove Medical Press Limited. The
full terms of this license are available at https://www.dovepress.com/terms
and incorporate the Creative Commons Attribution
- Non Commercial (unported, 3.0) License.
By accessing the work you hereby accept the Terms. Non-commercial uses of the work are permitted
without any further permission from Dove Medical Press Limited, provided the work is properly
attributed. For permission for commercial use of this work, please see paragraphs 4.2 and 5 of our Terms.